Below, please find the latest High-Volume ETF Cutline report, which shows how far above or below their respective long-term trend lines (39-week SMA) my currently tracked ETFs are positioned.
This report covers the HV ETF Master List from Thursday’s StatSheet and includes 312 High Volume ETFs, defined as those with an average daily volume of more than $5 million, of which currently 265 (last week 244) are hovering in bullish territory. The yellow line separates those ETFs that are positioned above their trend line (%M/A) from those that have dropped below it.
In case you are not familiar with some of the terminology used in the reports, please read the Glossary of Terms. If you missed the original post about the Cutline approach, you can read it here.
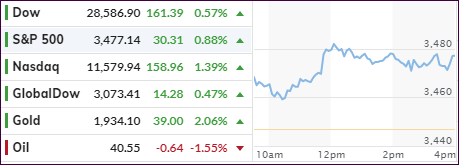
Despite Tuesday’s pullback, equities picked up steam and closed higher with the Dow sporting its best week since August, while the S&P 500 added +3.85% over the past five trading days, with the Nasdaq showing similar gains.
Despite the non-stop stimulus tug-of-war, today Trump indicated that “Covid relief negotiations are moving along. Go Big!” That is quite a turnaround from his Tuesday tweet of negotiations being postponed till after the elections. Well, you would need to read his book “The Art of the Deal” to make sense out of this and to see where he is coming from.
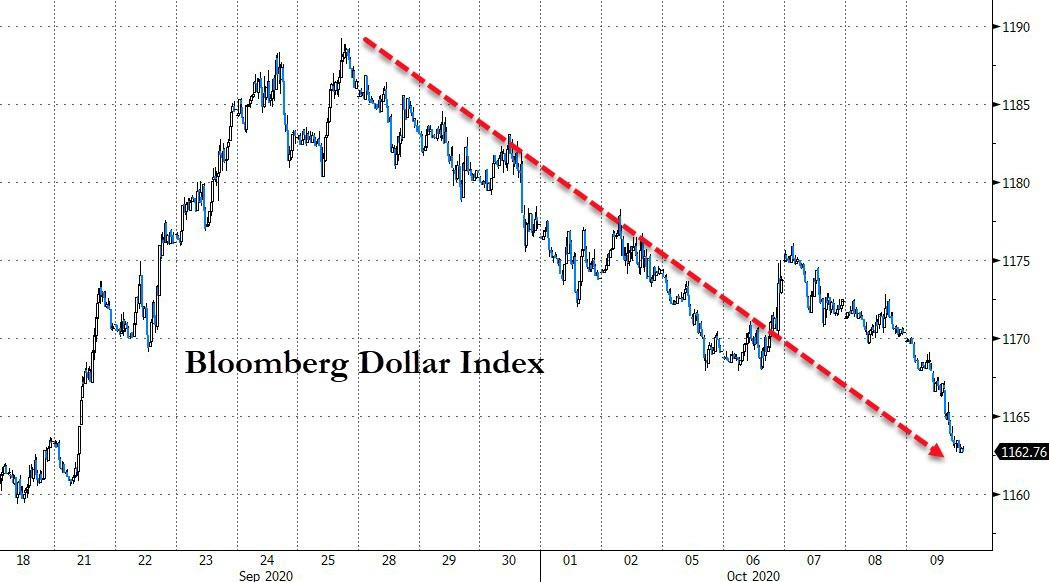
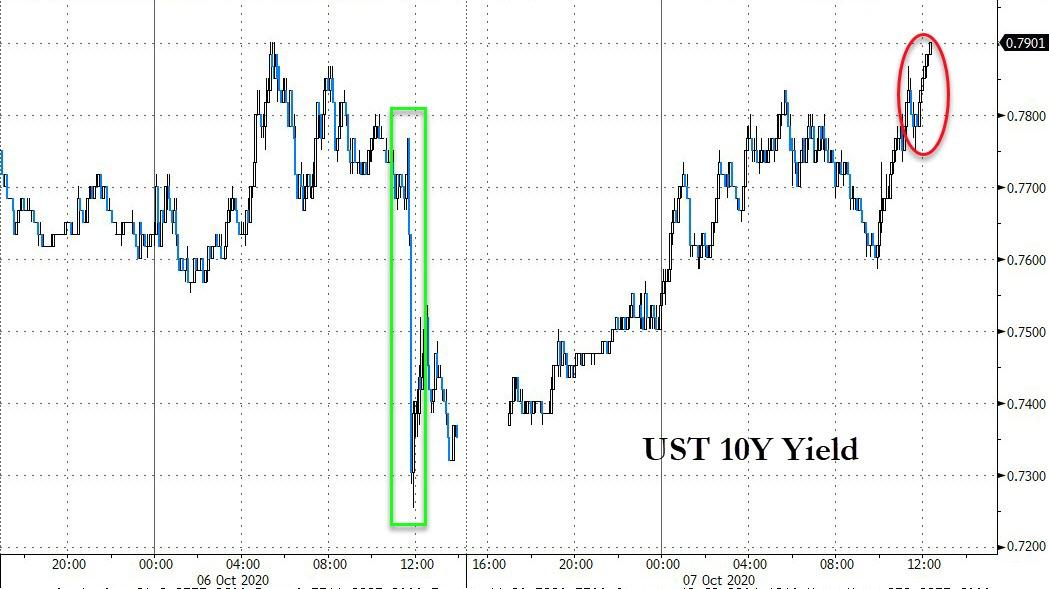
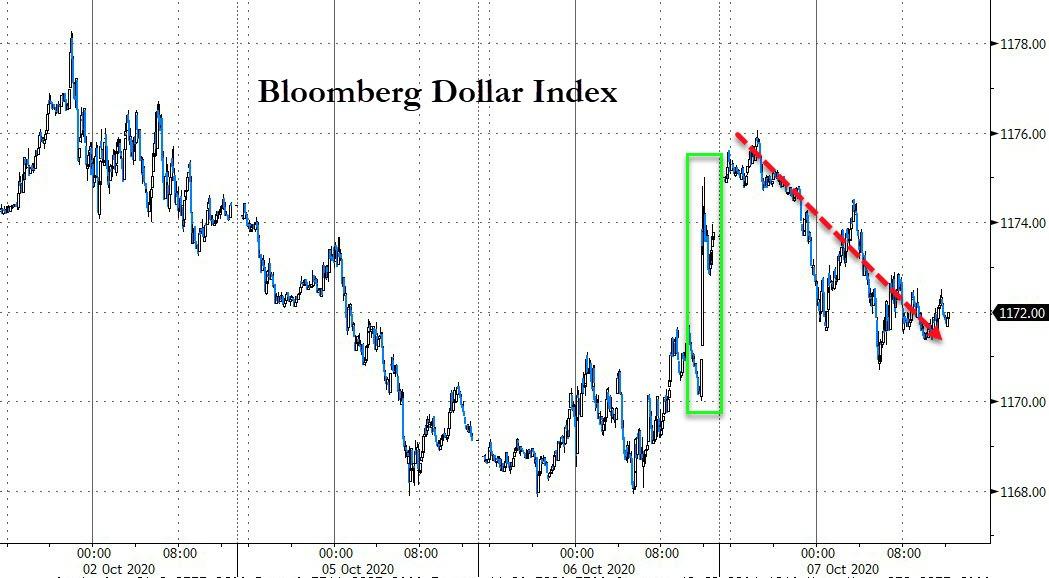
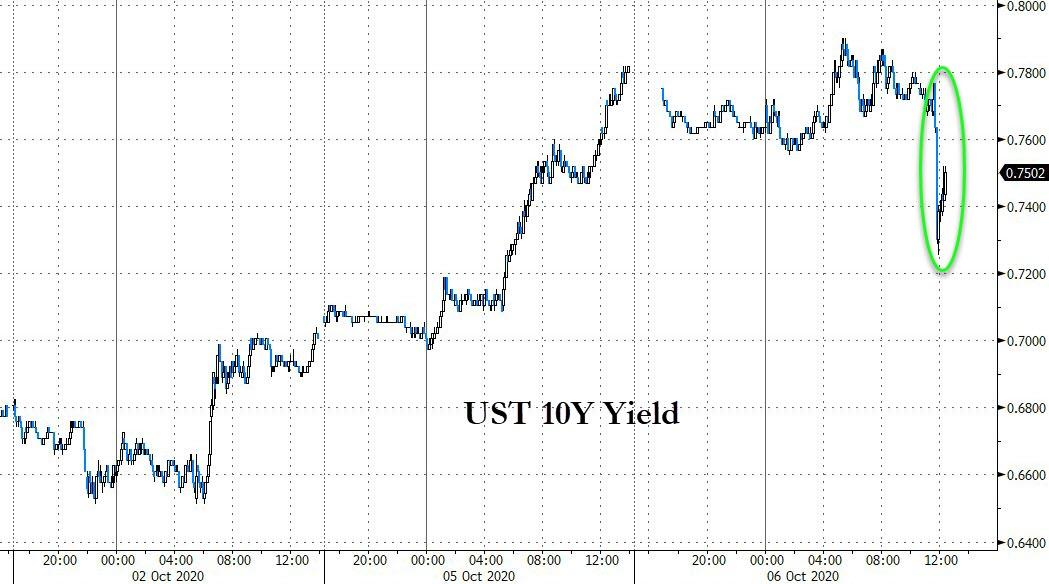
That also explains the reversal in the dollar, which has been freefalling and tumbling to three week lows. It comes as no surprise that the beneficiary turned out to be Gold, which has soared and comfortably recaptured its $1,900 level.
Added ZH:
Gold, meanwhile, has concluded that the now-imminent debt binge will indeed crush the dollar, sending capital pouring into safe havens. This sent gold to its best day since Aug 17th…
The act of creating reckless amounts of new money to fund deficits and relief programs is a hotly debated issue with analyst Peter Schiff seeing it this way:
“The problem is once you accept the false premise that government stimulus actually helps the economy – that it really is a stimulus – then you’ve kind of lost the argument. Because if borrowing and printing $1.6 trillion, if that’s a good thing, why isn’t borrowing and printing $2.4 trillion a better thing? Because you put the Republicans in the position of arguing that 2.4 trillion is too much of a good thing — that somehow, if we just create 1.6 trillion out of thin air and spend it, that’s really going to help. But if we push it to 2.4, it’s actually going to hurt. Why? I mean, when does something good suddenly become something bad?”
I agree with his analysis, which is why I look at the long-term effects and potential consequences and realize the significance of holding gold in anyone’s portfolio. Make no mistake about it, hyperinflation is the eventual outcome, the timing of it is just the big unknown.
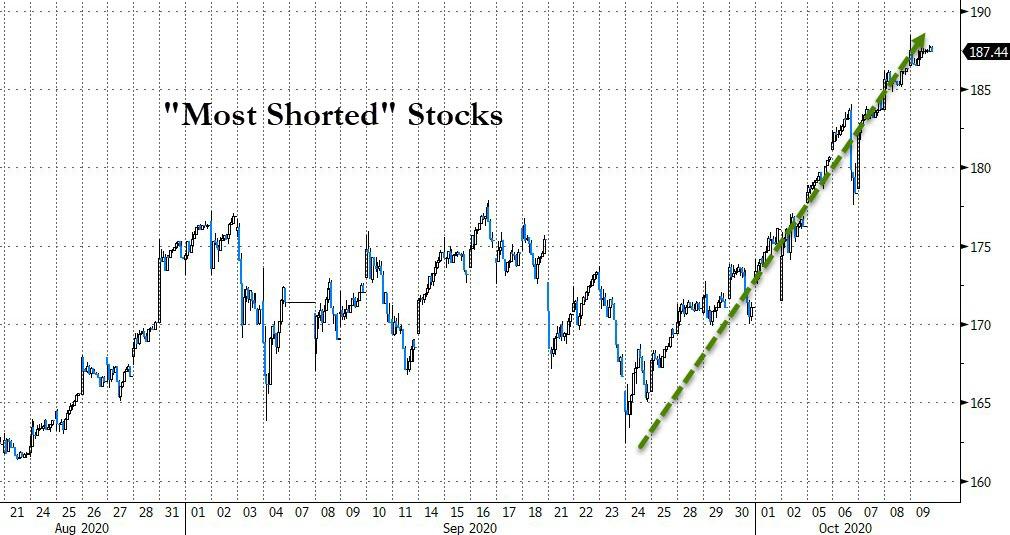
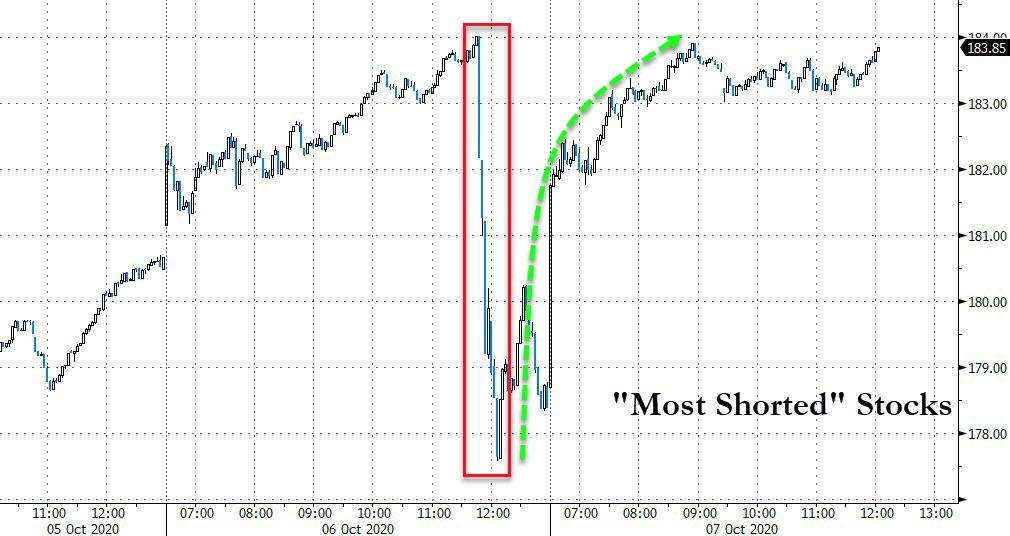
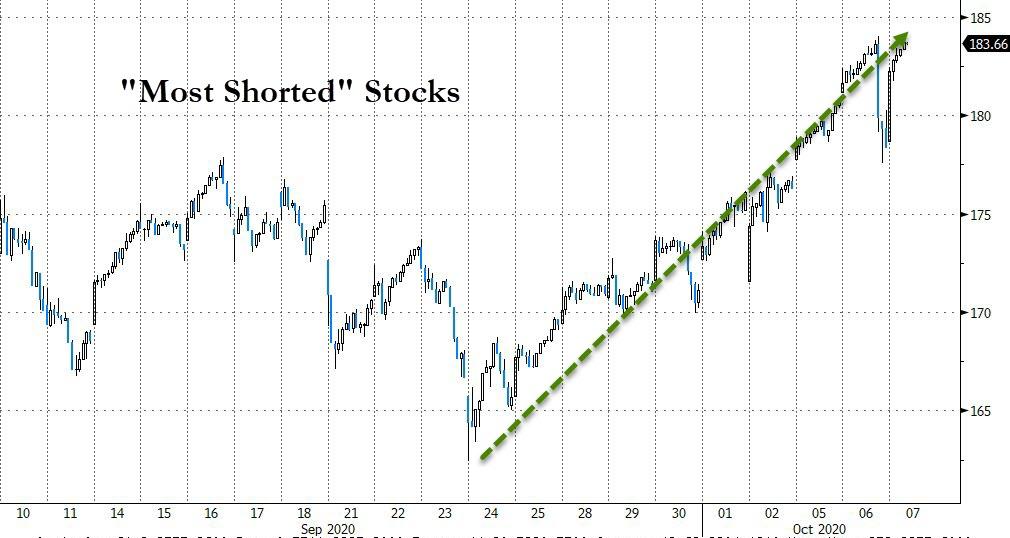
Again, the short-squeeze continued unabated and has been a major driver of equities since late September, as Bloomberg’s chart shows.
Let’s see how this movie continues next week. For sure, it won’t be boring.
ETF Data updated through Thursday, October 8, 2020
Methodology/Use of this StatSheet:
1. From the universe of over 1,800 ETFs, I have selected only those with a trading volume of over $5 million per day (HV ETFs), so that liquidity and a small bid/ask spread are assured.
2. Trend Tracking Indexes (TTIs)
Buy or Sell decisions for Domestic and International ETFs (section 1 and 2), are made based on the respective TTI and its position either above or below its long-term M/A (Moving Average). A crossing of the trend line from below accompanied by some staying power above constitutes a “Buy” signal. Conversely, a clear break below the line constitutes a “Sell” signal. Additionally, I use a 7.5% trailing stop loss on all positions in these categories to control downside risk.
3. All other investment arenas do not have a TTI and should be traded based on the position of the individual ETF relative to its own respective trend line (%M/A). That’s why those signals are referred to as a “Selective Buy.” In other words, if an ETF crosses its own trendline to the upside, a “Buy” signal is generated. Since these areas tend to be more volatile, I recommend a wider trailing sell stop of 7.5% -10% depending on your risk tolerance.
If you are unfamiliar with some of the terminology, please see Glossary of Termsand new subscriber information in section 9.
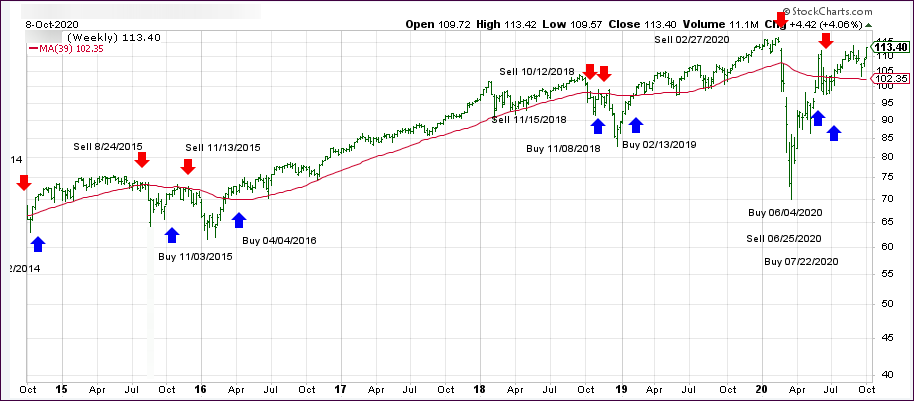
1. DOMESTIC EQUITY ETFs: BUY— since 07/22/2020
Click on chart to enlarge
Our main directional indicator, the Domestic Trend Tracking Index (TTI-green line in the above chart) has now rallied above its long-term trend line (red) by +10.79% and remains in “BUY” mode as posted.
Due to a variety of afternoon business commitments, I will not be able to write today’s market commentary. However, I will post the updated StatSheet by 6:30 pm PST.
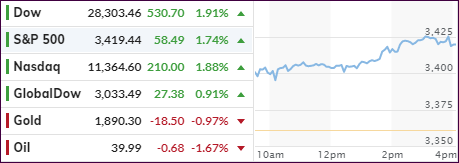
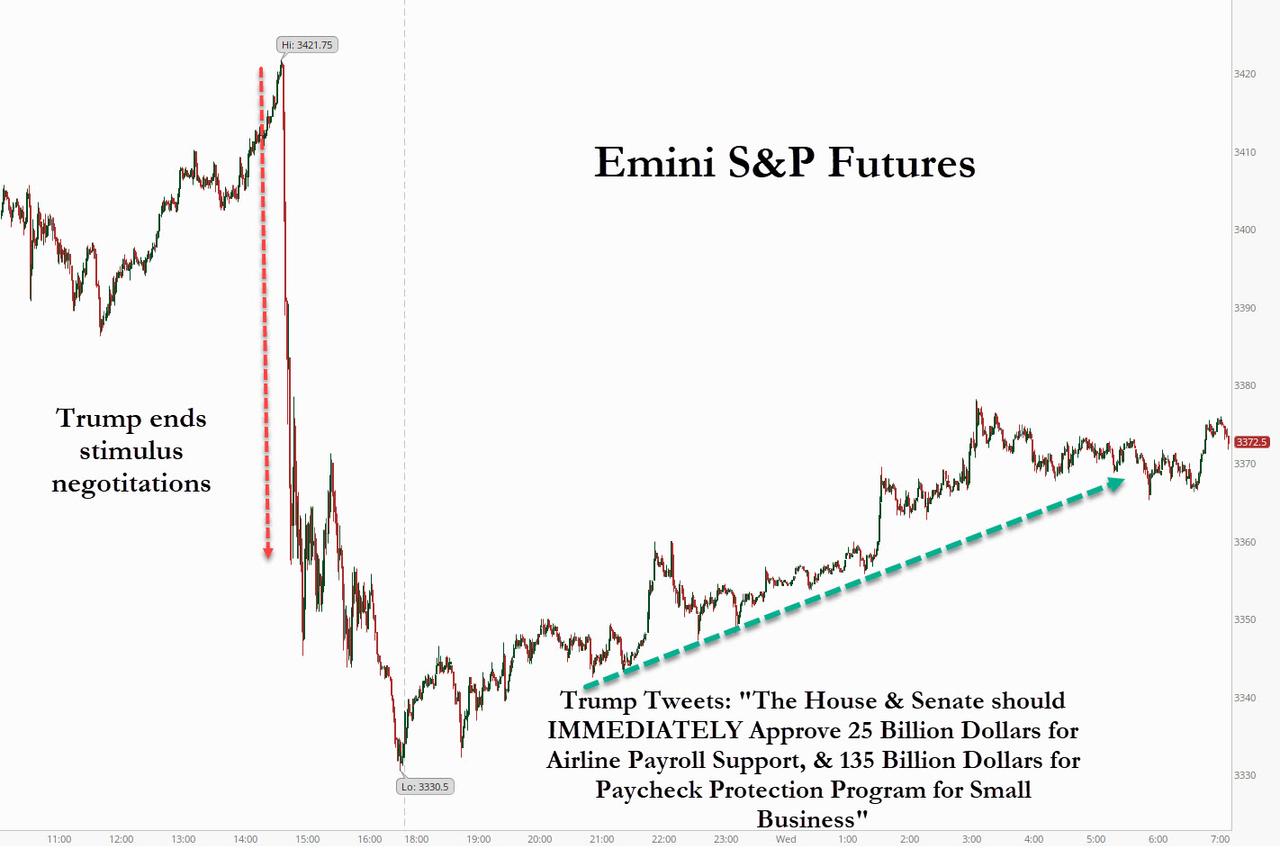
So far, my guess that yesterday’s plunge might have been an outlier looks to be correct, as the markets staged a comeback rally by recouping more than yesterday’s losses.
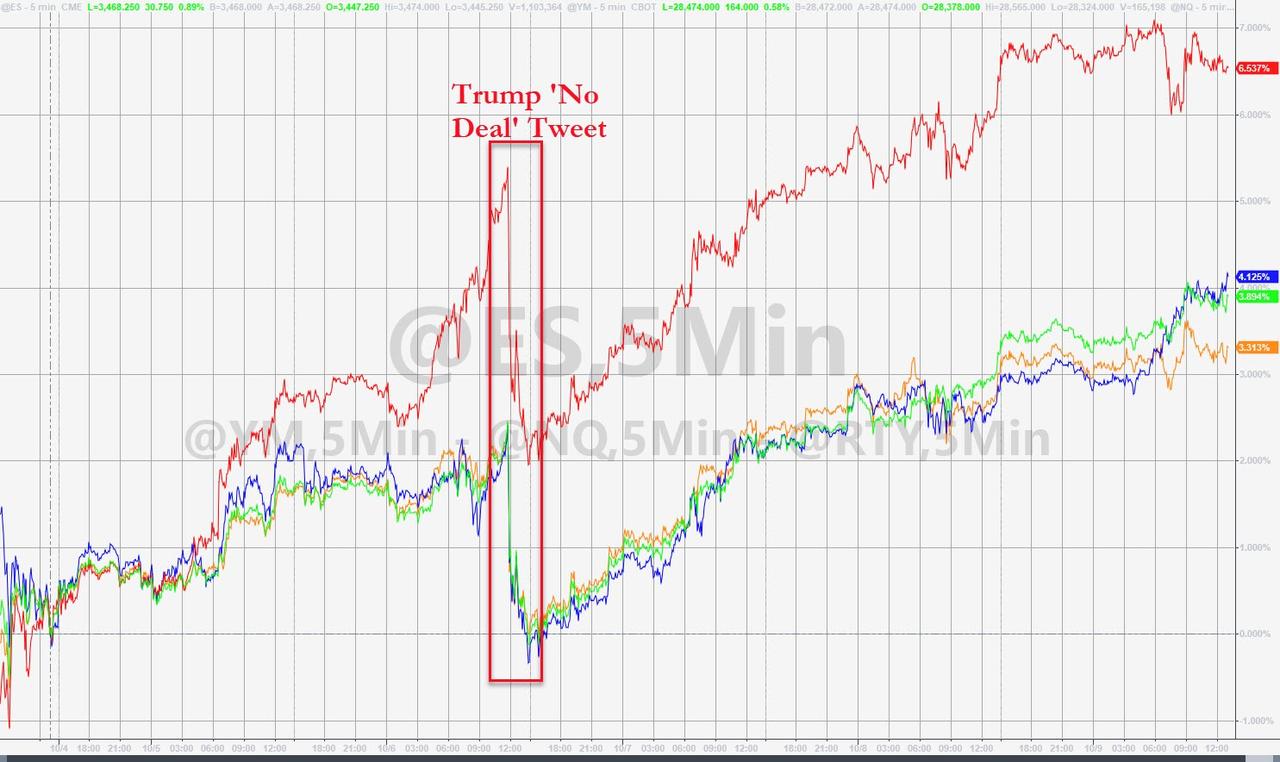
This came in part due to Trump walking back his tough talk by tweeting support for an immediate $25 billion for Airline Payroll package and $135 billion for PPP for Small Business. Hope for a fast passage spread, and the resulting rebound got started in the futures market, as this chart shows.
“This certainly isn’t the first time we’ve seen the market react to Trump tweets, and it probably won’t be the last,” said Chris Larkin, managing director of trading and investment product at E-Trade. “The seesaw we’ve seen since yesterday’s plunge is just case and point for the volatility we may encounter as we close in on the election.”
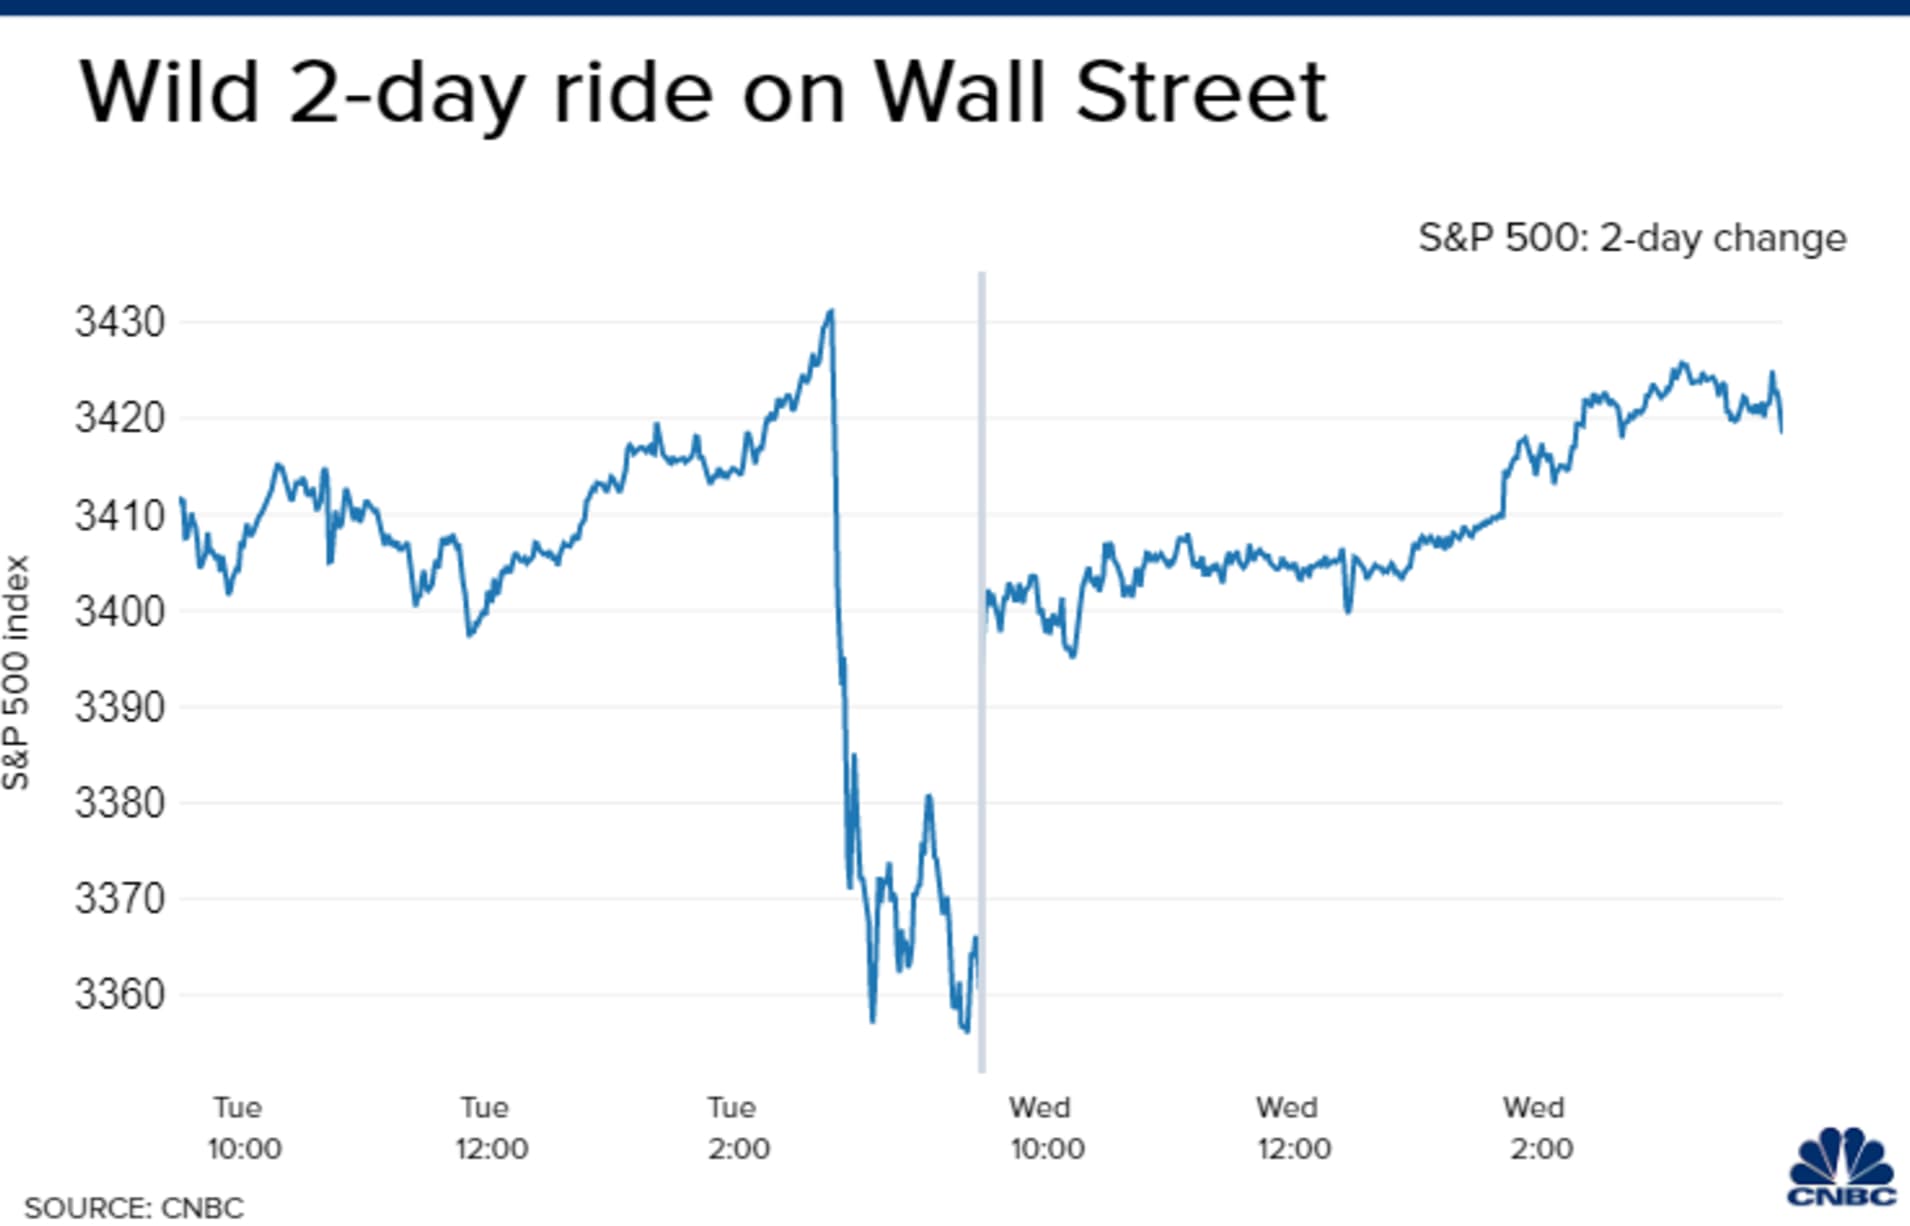
For sure, it’s been a wild ride just the past 2 days, but the S&P 500 got back to yesterday’s highs, as a bit of uncertainty has now been removed. In addition, a massive short squeeze, the 8th in the last 9 days, gave an assist to pull the major indexes out of their doldrums.
While spot gold tumbled -0.97%, as higher bond yields took their toll, the effect on the GLD ETF was much smaller and resulted in only a -0.05% loss, as the slumping US Dollar lent a helping hand.
The FOMC minutes released by the Fed had no effect on the markets.
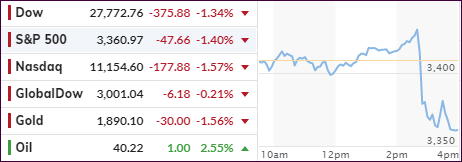
A choppy but nevertheless positive follow through rally from yesterday’s rebound ran into a brick wall, reversed, and nosedived during the last hour of the session.
This would have not been a surprise had the usual suspects, like Covid-19 or the always headline-worthy tug-of-war stimulus battles been the cause, but today was different.
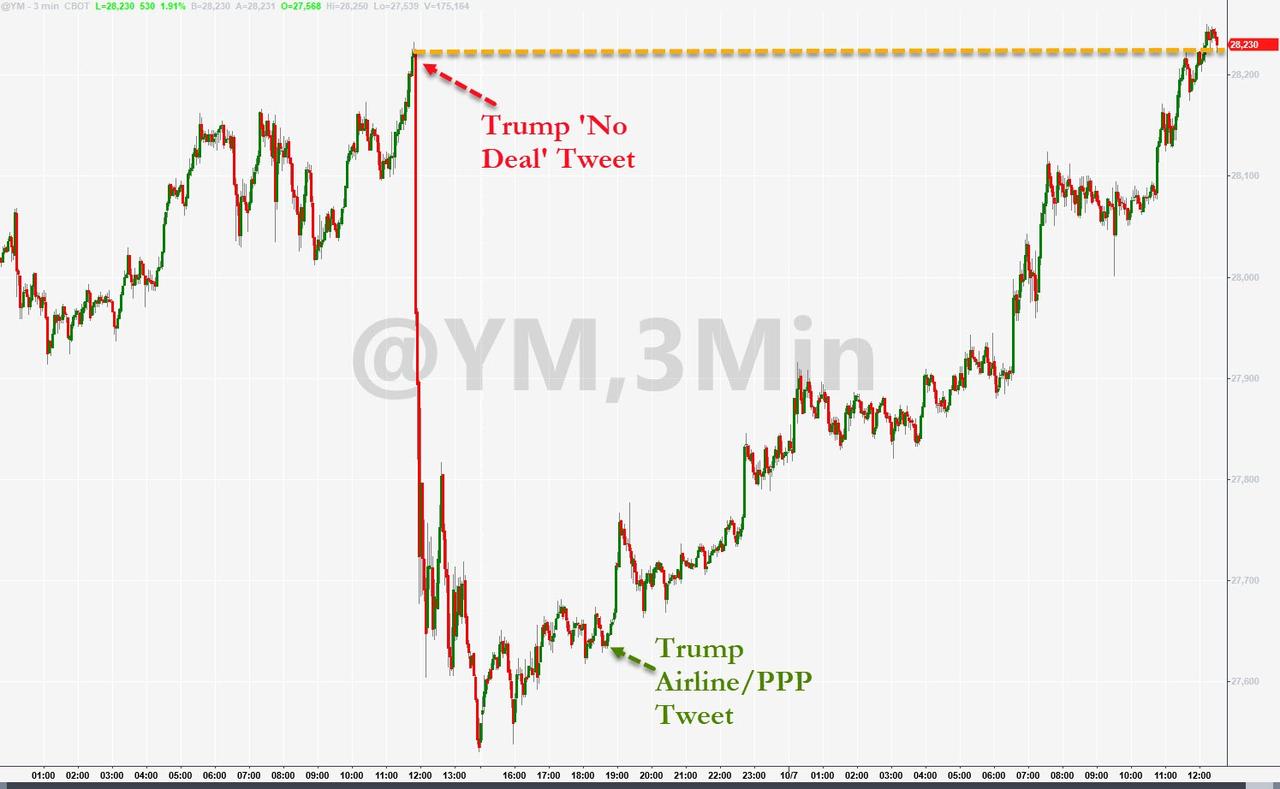
It was none other than President Trump, who prides himself as a contributor to the ever-bullish stock markets, who pulled the plug on the bulls by announcing that “stimulus talks are halted until after the election.”
Here’s what he tweeted:
Nancy Pelosi is asking for $2.4 Trillion Dollars to bailout poorly run, high crime, Democrat States, money that is in no way related to COVID-19.
We made a very generous offer of $1.6 Trillion Dollars and, as usual, she is not negotiating in good faith.
I am rejecting their request and looking to the future of our Country. I have instructed my representatives to stop negotiating until after the election when, immediately after I win, we will pass a major Stimulus Bill that focuses on hardworking Americans and Small Business.
I have asked Mitch McConnell not to delay, but to instead focus full time on approving my outstanding nominee to the United States Supreme Court, Amy Coney Barrett.
Our Economy is doing very well. The Stock Market is at record levels, JOBS and unemployment also coming back in record numbers. We are leading the World in Economic Recovery, and THE BEST IS YET TO COME!
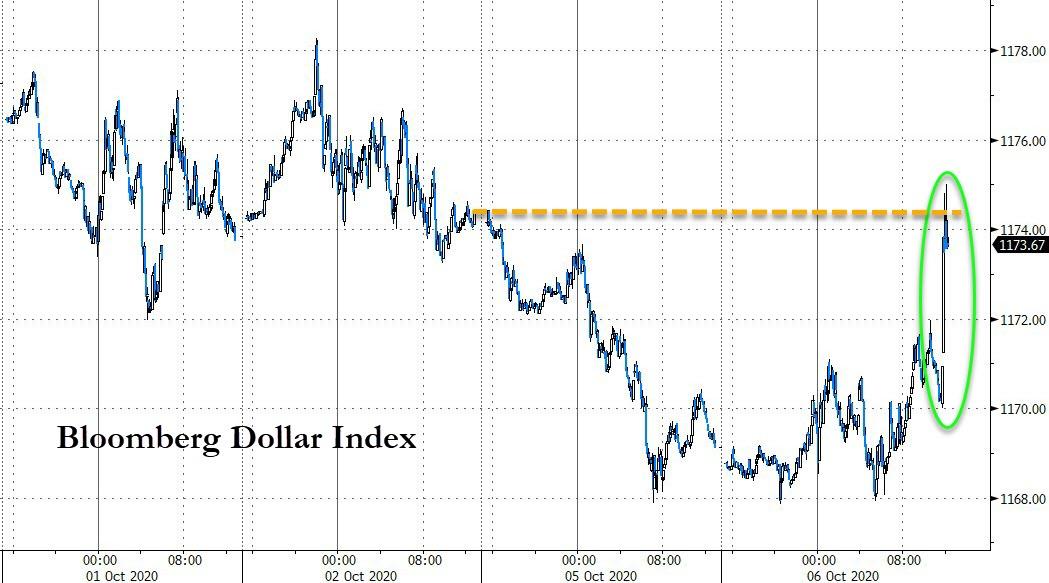
To no surprise, the fallout in the markets was swift and immediate, as the chart above shows. Other than oil, the major indexes tumbled, as did gold, but the US dollar rallied along with bonds (lower yields).
There was no place to hide. FANG stocks got hammered, Growth, Value and Cyclicals all were smacked. It remains to be seen whether today’s drop was simply an outlier or a sign of things to come.
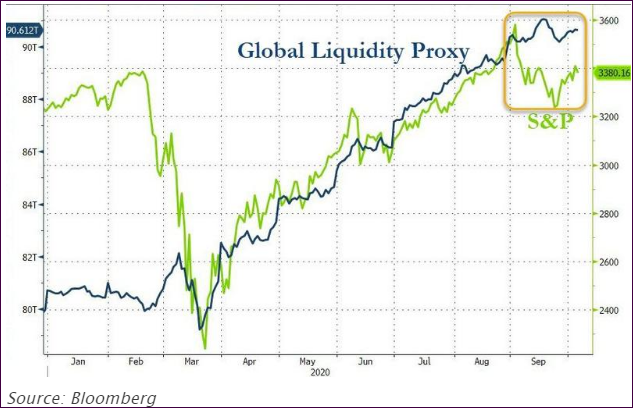
More interesting and somewhat concerting is the sudden divergence that appeared on this chart, which ZH pointed to:
Makes me wonder if this relationship has finally stopped working and liquidity’s role as the primary pump for the markets is ending.

