
ETF Data updated through Thursday, September 25, 2025
How to use this StatSheet:
- Out of the 1,800+ ETFs out there, I only pick the ones that trade over $5 million per day (HV ETFs), so you don’t get stuck with a lemon that nobody wants to buy or sell.
- Trend Tracking Indexes (TTIs)
These are the main indicators that tell you when to buy or sell Domestic and International ETFs (section 1 and 2). They do that by comparing their position to their long-term M/A (Moving Average). If they cross above, and stay there, it’s a green light to buy. If they fall below, and keep going, it’s a red light to sell. And to make sure you don’t lose your shirt if things go south, I also use a 12% trailing stop loss on all positions in these categories.
- All other investment areas don’t have a TTI and should be traded based on the position of each ETF relative to its own trend line (%M/A). That’s why I call them “Selective Buy.” In other words, if an ETF goes above its own trend line, you can buy it. But don’t forget to use a trailing sell stop of 12%, or less if you’re feeling nervous.
If some of these words sound like Greek to you, please check out the Glossary of Terms and new subscriber information in section 9.
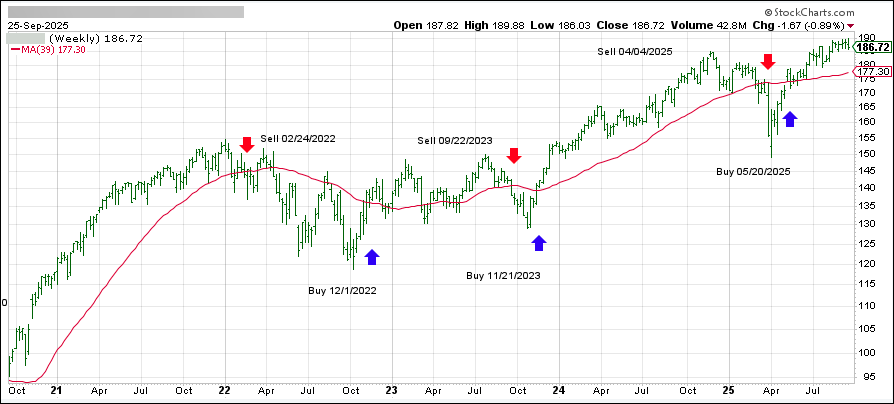
- DOMESTIC EQUITY ETFs: BUY— effective 5/20/2025
Click on chart to enlarge
This is our main compass, the Domestic Trend Tracking Index (TTI-green line in the above chart). It has broken above its long-term trend line (red) by +5.05% and remains in “Buy” mode, with our new holdings being subject to our trailing sell stops.
The link below shows all High Volume (HV) Domestic Equity ETFs. They are ranked by M-Index, which is my secret sauce for measuring momentum. Prices in all linked tables below are updated through 09/25/2025, unless otherwise noted. Price data not yet available at publication is indicated with 00.00% or -100.00%. Please note that distributions are not included in the current momentum numbers.
If the TTI is above the trend line, you can use the tables in the link below to pick your winners:
http://www.successful-investment.com/SSTables/HVDomETFs092525.pdf
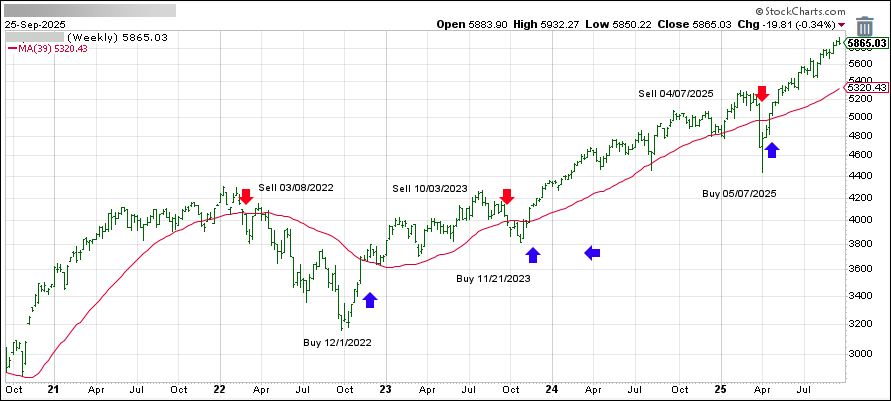
- INTERNATIONAL ETFs: BUY — since 05/07/2025
Click on chart to enlarge
This is our global guide, the International Trend Tracking Index (green). It has broken above its long-term trend line (red) by +10.75% and has been in “Buy” mode since 5/7/2025.
The list in the link below shows the High Volume (HV) International ETFs I track for you during a Buy cycle. They are also ranked by M-Index:
http://www.successful-investment.com/SSTables/HVInternETFs092525.pdf
- ETF MASTER LIST
This is the mother of all lists, showing all ETFs I track and how they stack up against each other. The sorting order is by M-Index too. Momentum figures for all ETFs are not adjusted for dividends.
http://www.successful-investment.com/SSTables/HVETFMaster092525.pdf
- COUNTRY ETFs: SELECTIVE BUY
This is where you can find HV ETFs for specific countries or regions that I watch every week. Please note that the data in this table does not include adjustments due to distributions. Country funds can be wild beasts, so make sure you use a trailing stop loss (I use 10%) to protect yourself from nasty bites.
http://www.successful-investment.com/SSTables/HVCountryETFs092525.pdf
- SECTOR ETFs: SELECTIVE BUY
This is where you can diversify your portfolio by looking for different opportunities in various sectors of the market. The table of HV Sector ETFs in the following link covers a wide range of possibilities. The sorting order is by M-Index:
http://www.successful-investment.com/SSTables/HVSectorETFs092525.pdf
Here too, I recommend using a 10% trailing stop loss to limit your risk.
- BOND & DIVIDEND ETFs: SELECTIVE BUY
If you like getting paid for holding ETFs, here’s a list of bond and dividend paying ETFs. But before you buy them, make sure you check their momentum figures first. Then you can visit your favorite financial web site to see their yield and other details.
Please note that the data in this table does not include adjustments due to distributions.
http://www.successful-investment.com/SSTables/HVBond_DivETFs092525.pdf
- BEAR MARKET ETFs: SELECTIVE BUY
Below are some of the most popular bear market ETFs and their momentum figures:
http://www.successful-investment.com/SSTables/HVBearETFs092525.pdf
Please note that some of these funds try to beat the index they are tied to by a certain percentage. This can boost your returns, but it can also magnify your losses. So be careful and use a trailing sell stop (I suggest 10%) and be ready for some bumps along the way.
- NEW SUBSCRIBER INFORMATION
To get a head start on more successful investing, please click on:
http://www.successful-investment.com/SellStopDiscipline.pdf
In case you missed it, you can download my latest e-book “How to beat the S&P 500…with the S&P 500,” here. If you are investing your 401k and must use mutual funds, I suggest you mainly stick with the S&P 500 as described in my book. Of course, you can always use the above tables to find sector or country ETFs that suit your taste and use the equivalent mutual funds as offered by your custodian.
Disclosure:
I must tell you that I, as well as my advisory clients, own some of the ETFs listed in the above table. Also, they are not meant to be specific investment recommendations for you, they just show which ETFs from my universe are doing well right now.