Market Paradox: AI Surge And Nvidia’s Slide Amidst Economic Turbulence

Ulli Market Commentary Contact

[Chart courtesy of MarketWatch.com]

  1. Moving the markets

For a moment, we saw the S&P 500 trade above its 5,500 level, as the tech rally continued unabated with Nvidia in the lead. However, during this session the tech darling took a dive and scored its worst day in two months. Is it starting to look toppy?

In the end, the S&P 500 and Nasdaq were not able to hold on and closed in the red.

The AI boom is in full swing and remains the main driver of this rally, despite consumers reducing their spending and the economy’s weakness becoming more apparent every day.

Today, the latest data showed higher-than-expected weekly jobless claims along with reduced housing starts and permits. Manufacturing also took a hit and dropped below expectations, while the Economic Surprise index dove to its lowest since early 2019.

Bond yields rose a tad, as energy outperformed the MAG 7 stocks over the last 2 days. The dollar rebounded, and surprisingly gold followed the same path, while Bitcoin rode the rollercoaster and ended the session unchanged. Crude oil rocketed to a level last seen in April, which means prices at the pump will see a hike.  

None of this seems to matter to the markets even with breadth being conspicuously absent, which means that only a few stocks are supporting the indexes and their relentless march into uncharted territory. This blow-off phase may go on a while longer, but it will not end well.

Traders’ eyes are now focused on tomorrow’s largest option expiration ever, with $5.1 trillion of options expiring along with a record $870 billion in single stock options.  

While volatility might rear its ugly head, nothing could go wrong there, right?

Read More

Nvidia’s Meteoric Rise Leads Market Rally, Dotcom Déjà Vu?

Ulli Market Commentary Contact

[Chart courtesy of MarketWatch.com]

  1. Moving the markets

The major indexes opened slightly higher despite disappointing retails sales. While they rose 0.1% in May, expectations were for a more solid 0.2%. This latest result is a sign that consumer demand is weakening, and this 0.1% growth may simply have been the result of inflation.

Rising consumer demand is critical for the markets, because without it this bull market will eventually fall flat on its face. After all, consumer activity accounts for some 67% of economic growth and is a key component for corporate profits. Offsetting this weakness, however, was strong industrial production.

Still, bond yields slipped, and traders focused right away on the wishful theme that this slowdown may persuade the Fed to shift policy gears and lean towards cutting rates.

The indexes eked out another green close with the S&P 500 rising to a new record, as tech darling Nvidia also marched towards new highs, in the process surpassing Microsoft as the most valuable public company.

Interestingly, the Mag 7 stocks faded with ZH noting togue in cheek that the markets have now become the “Magnificent One.”

A variety of the Fed mouthpieces appeared, but their opinions on rate cuts were a mixed bag and did not influence market direction, but rate-cut expectations rose during the session.  

The most shorted stocks remained in their 3-day sideways range, as bond yields fell and the dollar dipped. Bitcoin continued to break down by heading towards its $64k level, while gold slid at first but then rallied into the close. Crude oil extended its gains and headed towards $82.  

With Nvidia’s relentless climb into uncharted territory, I wonder how long this will last…

Are we seeing a turbo-charged replay of the dotcom bubble?

Read More

Market Resilience Tested As Retail Sales Loom, Yet Majors Rally On Economic Optimism

Ulli Market Commentary Contact

[Chart courtesy of MarketWatch.com]

  1. Moving the markets

The indexes were closely hugging their respective unchanged line at the start of the session, as we entered the Holiday shortened week. Some of this uncertainty was based on tomorrow’s release of the May retail sales numbers, which can represent the financial health of the consumer.

After the early dip, buyers stepped in and pulled the indexes out of their slump, and off to the races we went with all 3 majors advancing solidly, supported by traders’ beliefs that future economic data would come in stronger and with more consistency.  

Last week was a mixed bag for the major indexes with the Dow recording its third losing week in four, while the S&P 500 and Nasdaq scored their seventh up week out of the last eight.

Also on deck will be home sales and housing-starts later this week.

Bond yields rose across the spectrum, which pulled rate-cut expectation lower. However, traders did not seem to care and drove equities higher, which created this divergence between the 10-year and the S&P 500.

Not to be left out, the MAG 7 stocks soared, but breadth keeps on getting worse, as the S&P 500 goes its separate bullish way when compared to those of its members that are positioned above their 200-day M/A.

The dollar weakened despite higher yields, crude oil rebounded sharply and crossed it $80 level to the upside. Gold slipped, but Bitcoin rebounded and raced back toward its $67k level.

ZH pointed to another market oddity, namely that the MAG7 stocks have added $3.3 trillion in market cap in Q2 so far, while the 493 other stocks in the S&P 500 have lost $270 billion.

Hmm…does that look like a healthy, balanced, and sustainable market to you?

Read More

ETFs On The Cutline – Updated Through 06/14/2024

Ulli ETFs on the Cutline Contact

Do you want to know which ETFs are hot and which ones are not? Then you need my High-Volume ETF Cutline report. It tells you how close or far each of the 311 ETFs I follow is from its long-term trend line (39-week SMA). These are the ETFs that trade more than $5 million a day, so they are not some obscure funds that nobody cares about.

The report is split into two parts: The winners that are above their trend line (%M/A), and the losers that are below it. The yellow line is the line of shame that separates them. You can see how many ETFs are in each group and how they have changed since the last report (266 vs. 262 current).

Take a peek:

The HV ETF Master Cutline Report

If you are confused by some of the terms we use, don’t panic. I have a helpful Glossary of Terms for you.

If you want to learn more about the Cutline method and how it can make you rich (or at least less poor), read my original post here.

ETF Tracker Newsletter For June 14, 2024

Ulli ETF Tracker Contact

ETF Tracker StatSheet          

You can view the latest version here.

TECH TITANS TUSSLE FOR TOP SPOT AMIDST MARKET MELT-UP AND MAIN STREET MALAISE

[Chart courtesy of MarketWatch.com]

  1. Moving the markets

Stocks fell right after the opening, as a decline in consumer sentiment gave the bears a reason to cheer. However, the S&P 500 ended only marginally lower but gained for the week.

The Michigan survey of consumers confirmed that the consumer is stressed, with the sentiment declining to 65.6 in June, which represents a sharp drop from April’s number of 69.1. Worse yet, estimates were in the 71.5 range, a huge miss.

This clearly shows the disconnect between Wall Street and Main Street and dampened enthusiasm about better-than-expected CPI and PPI figures from earlier in the week. Hope of a continued cooling of inflation were the main contributors to the S&P’s and Nasdaq’s advances.

As we know, all market action has been centered around tech and its seemingly never-ending melt-up, which ZH so aptly displayed in this graphic version. The Big Three, Nvidia, Apple and Microsoft, have been taking turns and swapping their position as the #1 tech company in the world. How long can traders play this game of musical chairs, before the reality sets in that this is all one gigantic bubble?

In the meantime, the broad market, as represented by the equal weight S&P index, has gone nowhere since late February. It shows the one-sidedness of the current rally, a theme that is not conducive to long-term gains.

Bond yields slipped a tad with the 10-year now at its lowest level since early May. Gold and Silver closed at session highs, but cryptos were clobbered for no apparent reason.

It was a week with wild swings, but the S&P 500 and the Nasdaq managed to eke out another win and kept bullish sentiment going.

The question is “for how long?”

After all, cracks in the economy are appearing in many places and, if the Fed eventually caves in and cuts rates, it will be over for the bullish crowd.

Why?

Because the reason for the cut will not be that inflation has been conquered, it will be that the economy is in total shambles, which will be a nail in the coffin of equities.

Read More

Weekly StatSheet For The ETF Tracker Newsletter – Updated Through 06/13/2024

Ulli ETF StatSheet Contact

ETF Data updated through Thursday, June 13, 2024

How to use this StatSheet:

  1. Out of the 1,800+ ETFs out there, I only pick the ones that trade over $5 million per day (HV ETFs), so you don’t get stuck with a lemon that nobody wants to buy or sell.
  1. Trend Tracking Indexes (TTIs)

These are the main indicators that tell you when to buy or sell Domestic and International ETFs (section 1 and 2). They do that by comparing their position to their long-term M/A (Moving Average). If they cross above, and stay there, it’s a green light to buy. If they fall below, and keep going, it’s a red light to sell. And to make sure you don’t lose your shirt if things go south, I also use a 12% trailing stop loss on all positions in these categories.

  1. All other investment areas don’t have a TTI and should be traded based on the position of each ETF relative to its own trend line (%M/A). That’s why I call them “Selective Buy.” In other words, if an ETF goes above its own trend line, you can buy it. But don’t forget to use a trailing sell stop of 12%, or less if you’re feeling nervous.

If some of these words sound like Greek to you, please check out the Glossary of Terms and new subscriber information in section 9.

  1. DOMESTIC EQUITY ETFs: BUY— since 11/21/2023

Click on chart to enlarge

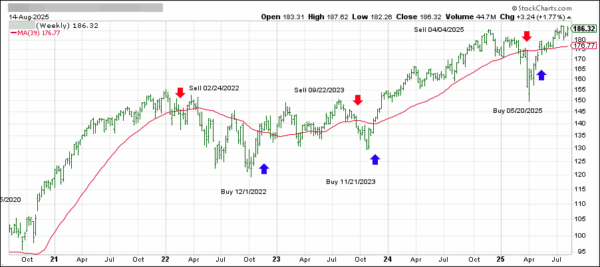
This is our main compass, the Domestic Trend Tracking Index (TTI-green line in the above chart). It has broken above its long-term trend line (red) by +6.32% and is in “Buy” mode as posted.

Read More