
- Moving the markets
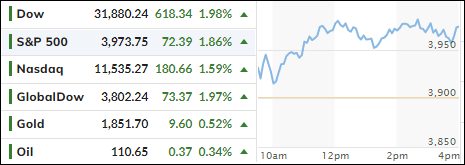
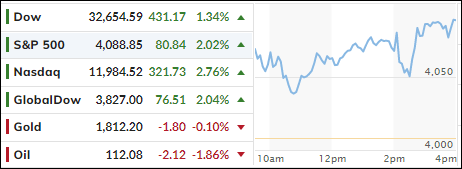
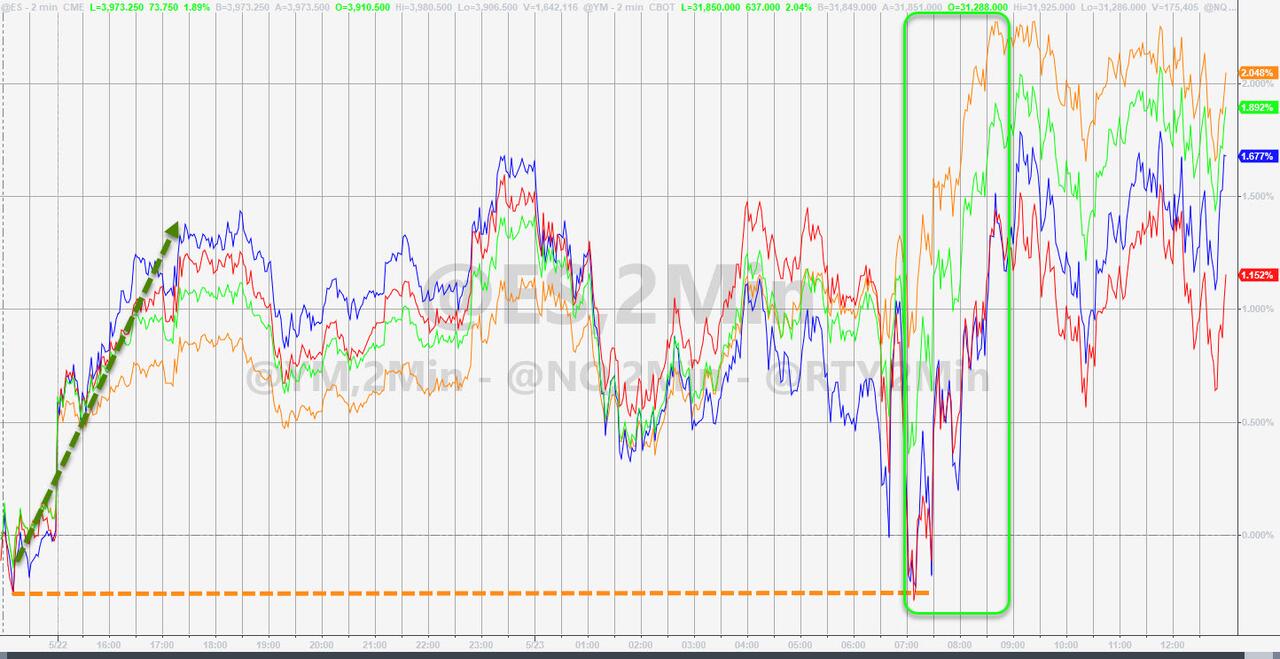
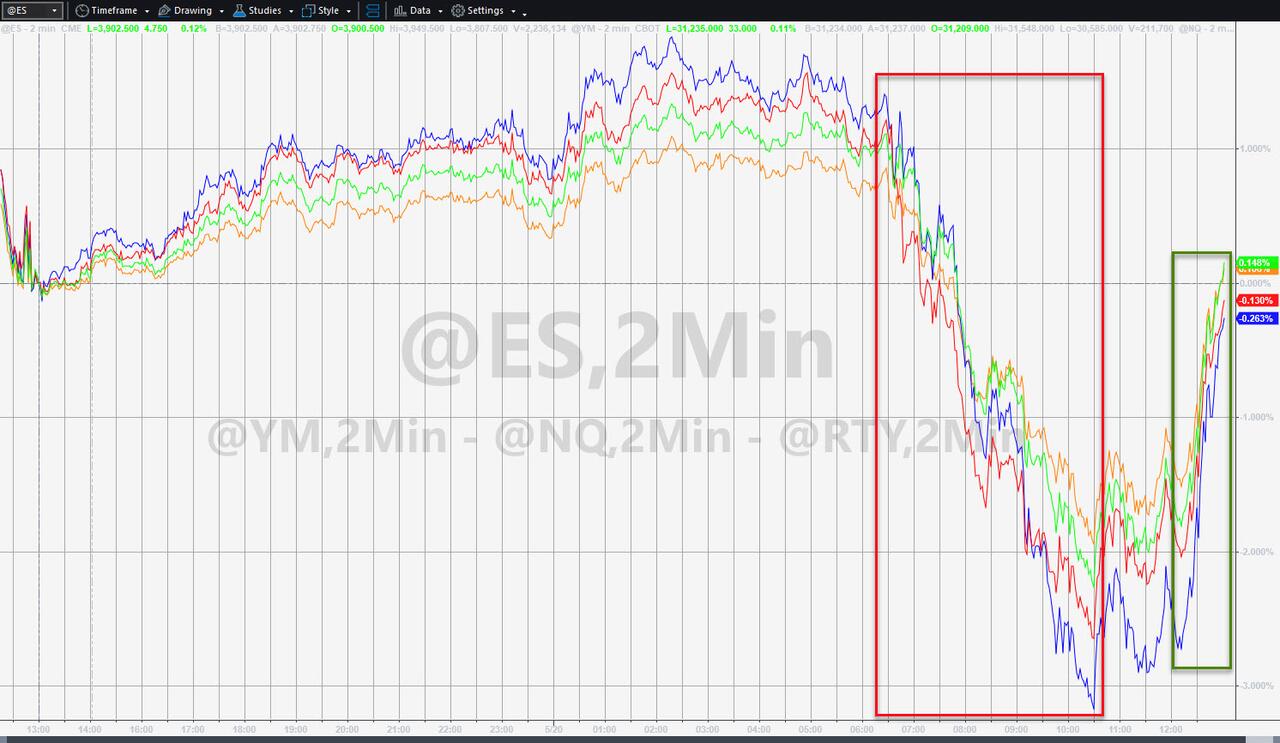
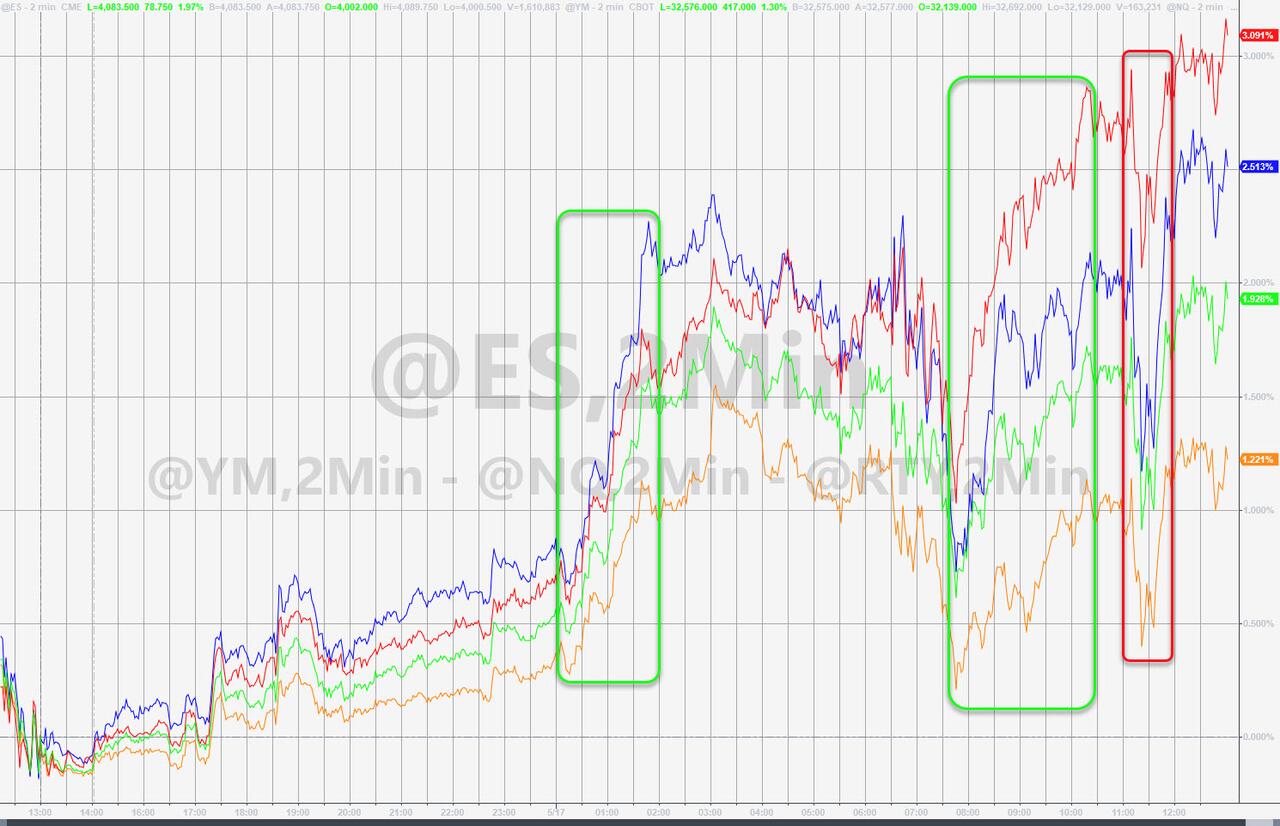
Finally, the markets were able to build on early gains, with the bulls at last managing to score a winning session. As I posted Friday, I suspected as much due to balanced mutual funds having to go through their monthly rebalancing efforts this week.
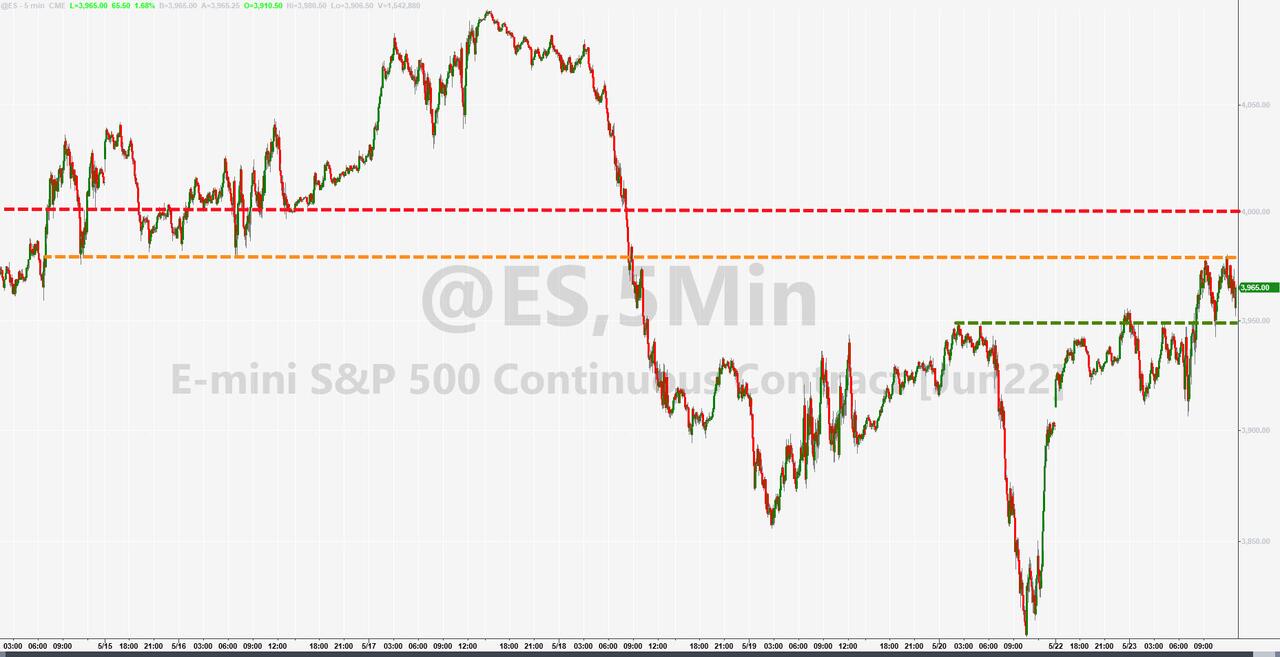
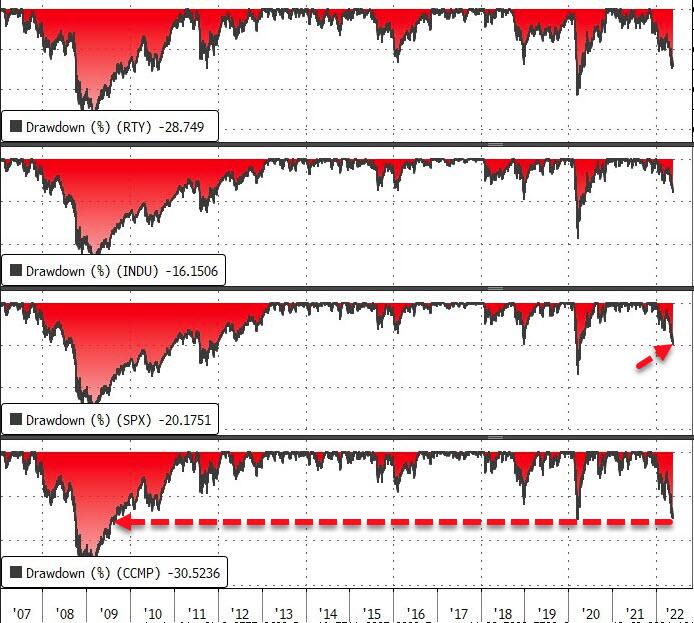
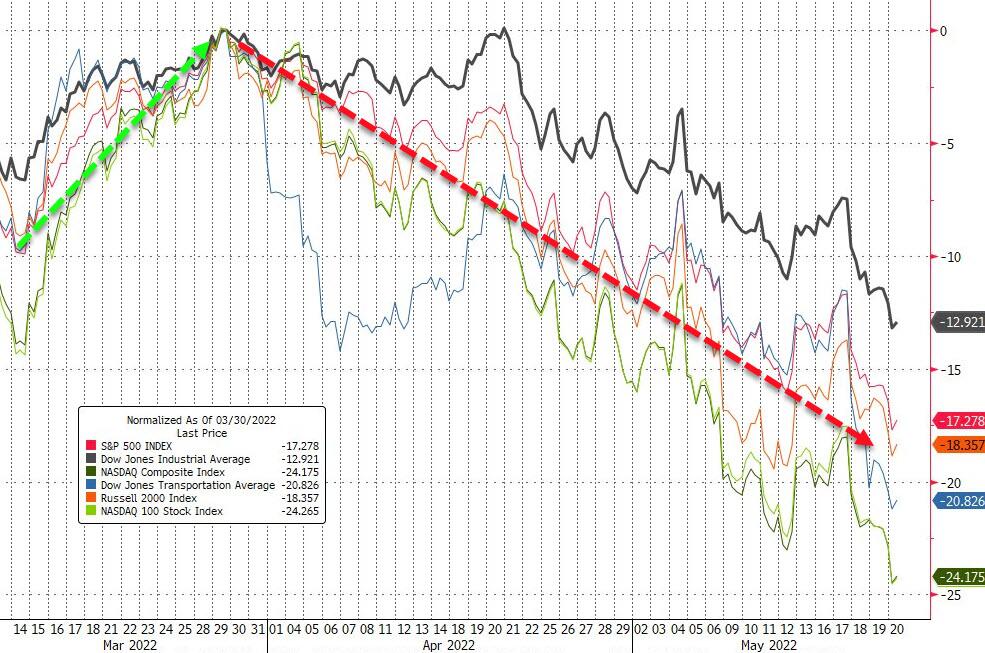
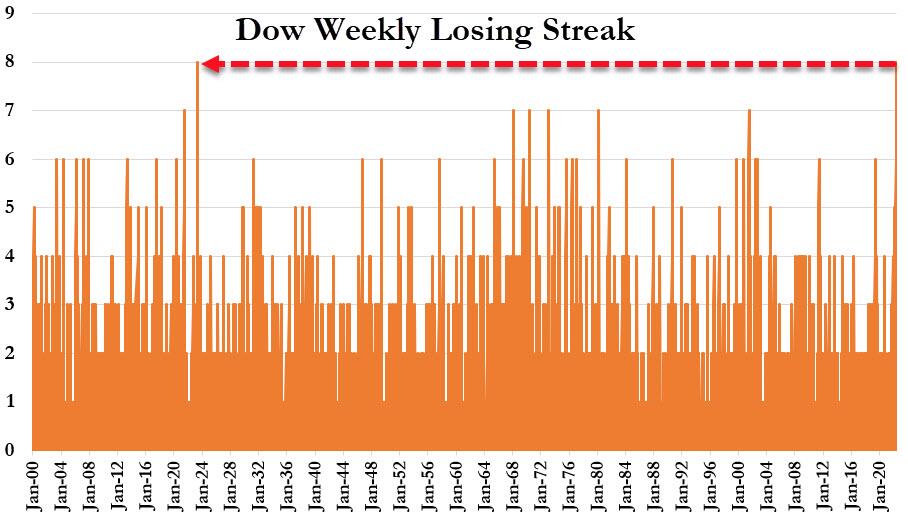
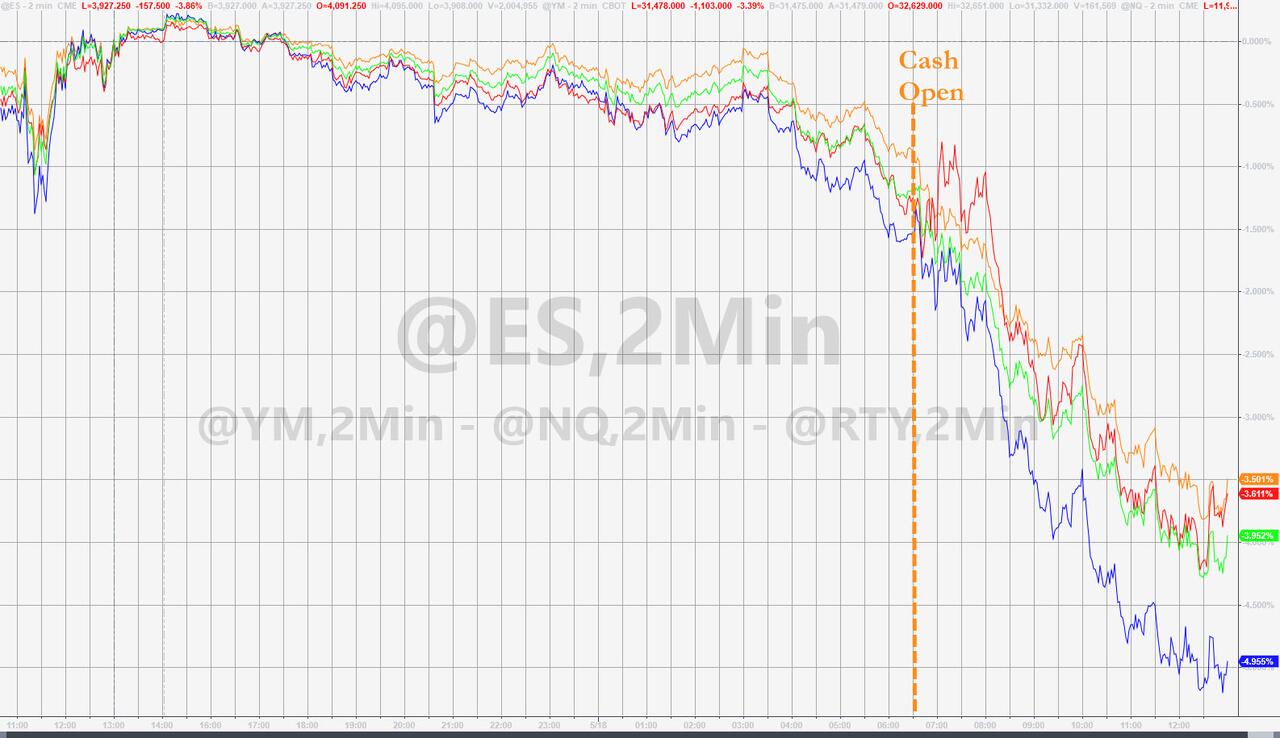
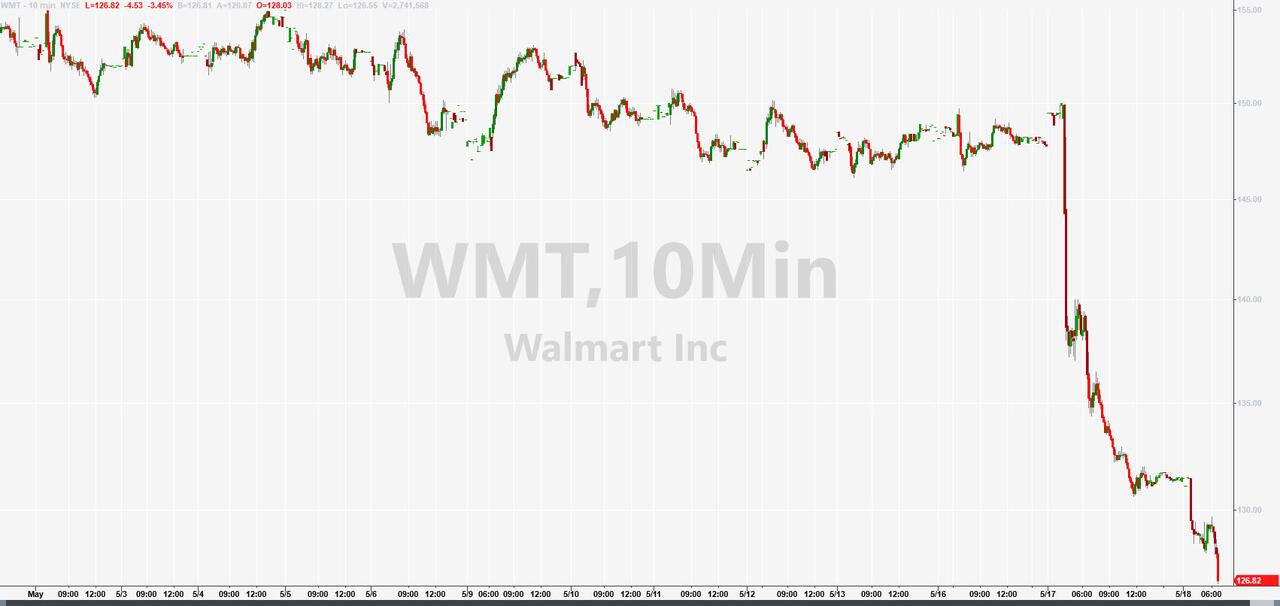
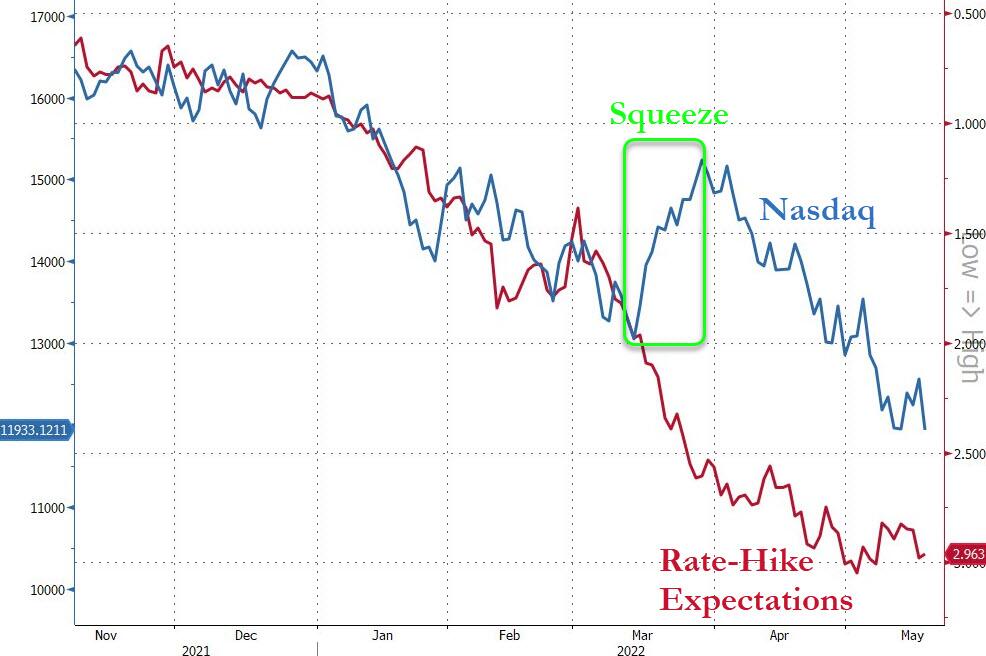
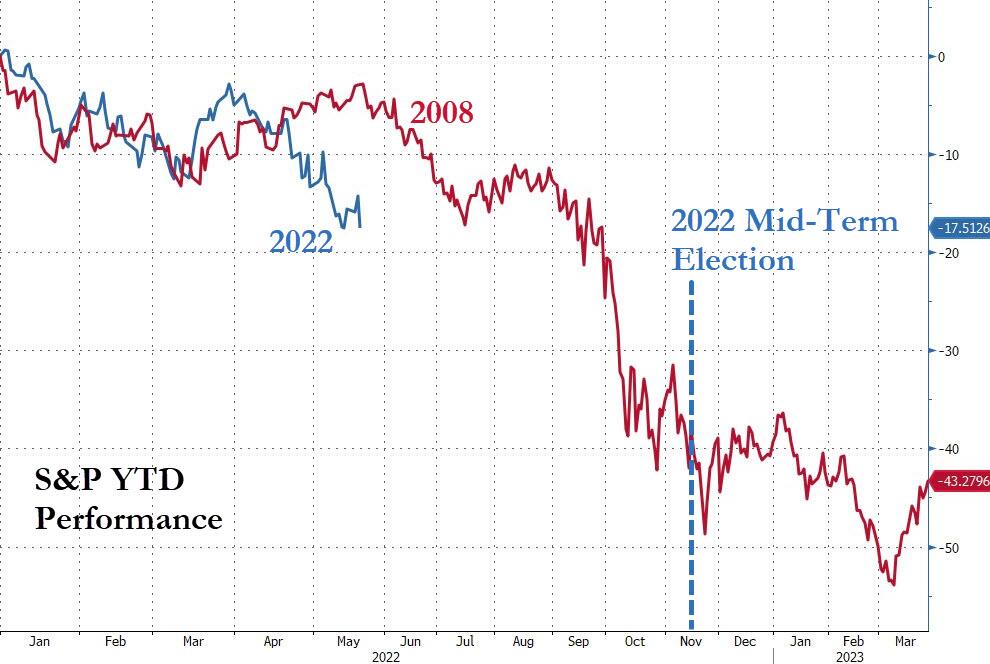
This move pulled the S&P 500 out of Friday’s officially reached intra-day bear market, which is defined as a drop of 20% from its latest high. Even the much-spanked Nasdaq ended up in the green with a 1.59% gain. Still, it will be a long, hard road for this index to recapture its recent 26% drop, especially after having seen seven down weeks in a row.
One analyst at Aviva investors captured the current market mood with this spot-on remark:
“Investors are trying to come to grips with what exactly is happening and always try to guess what the outcome is. Investors and the market hate uncertainty, and this is a period where they don’t have any clear indication on what’s going to happen with this push-pull between inflation and the economy.”
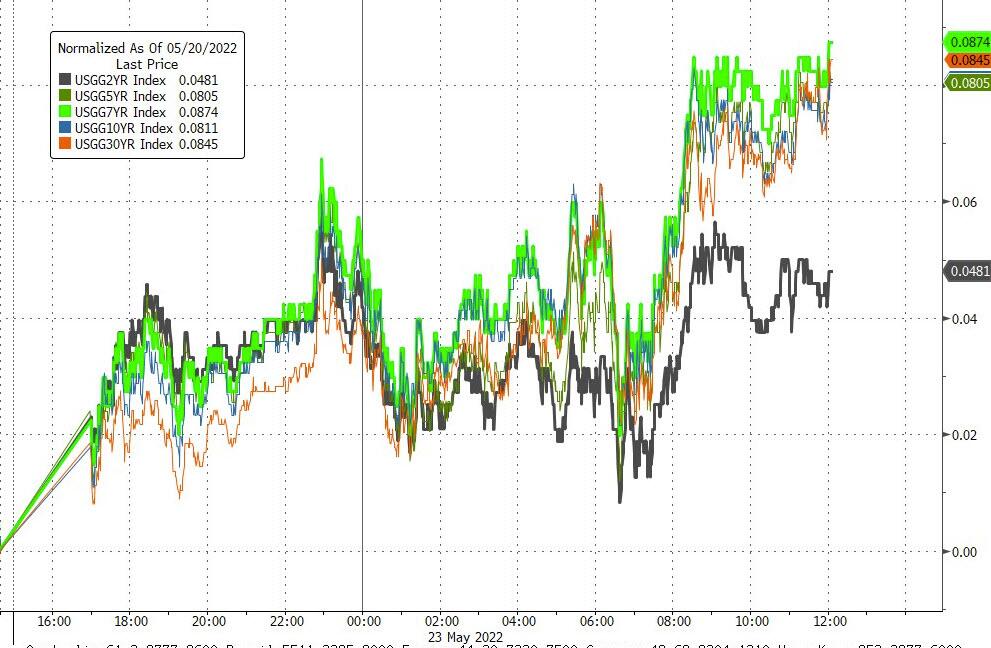
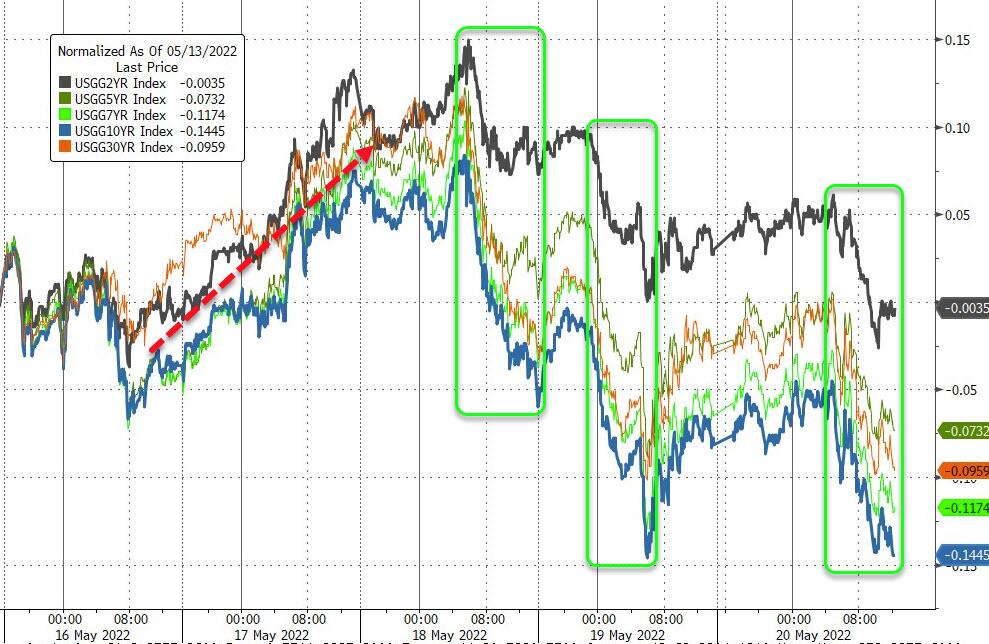
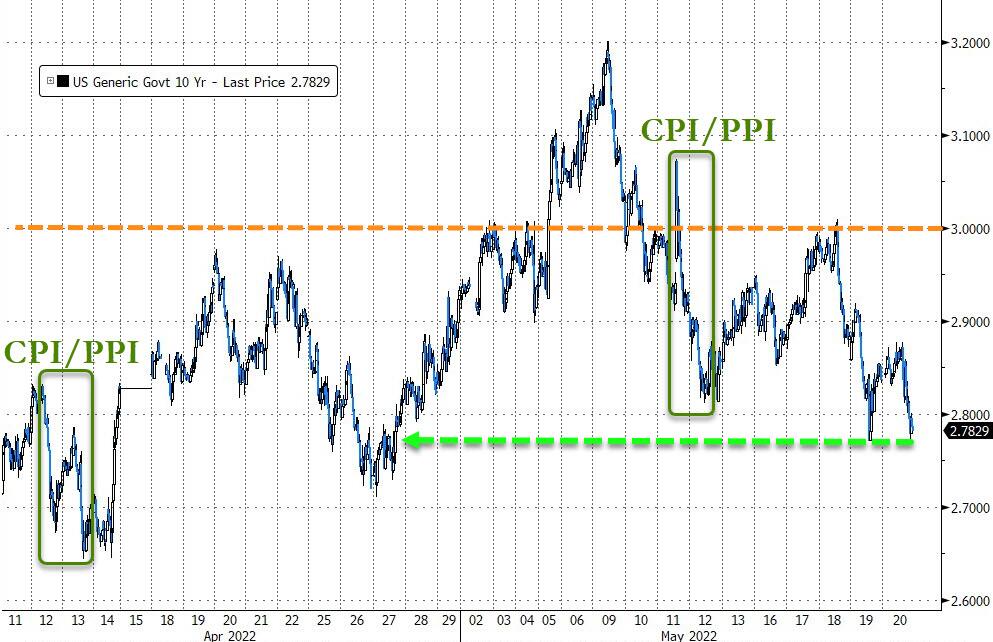
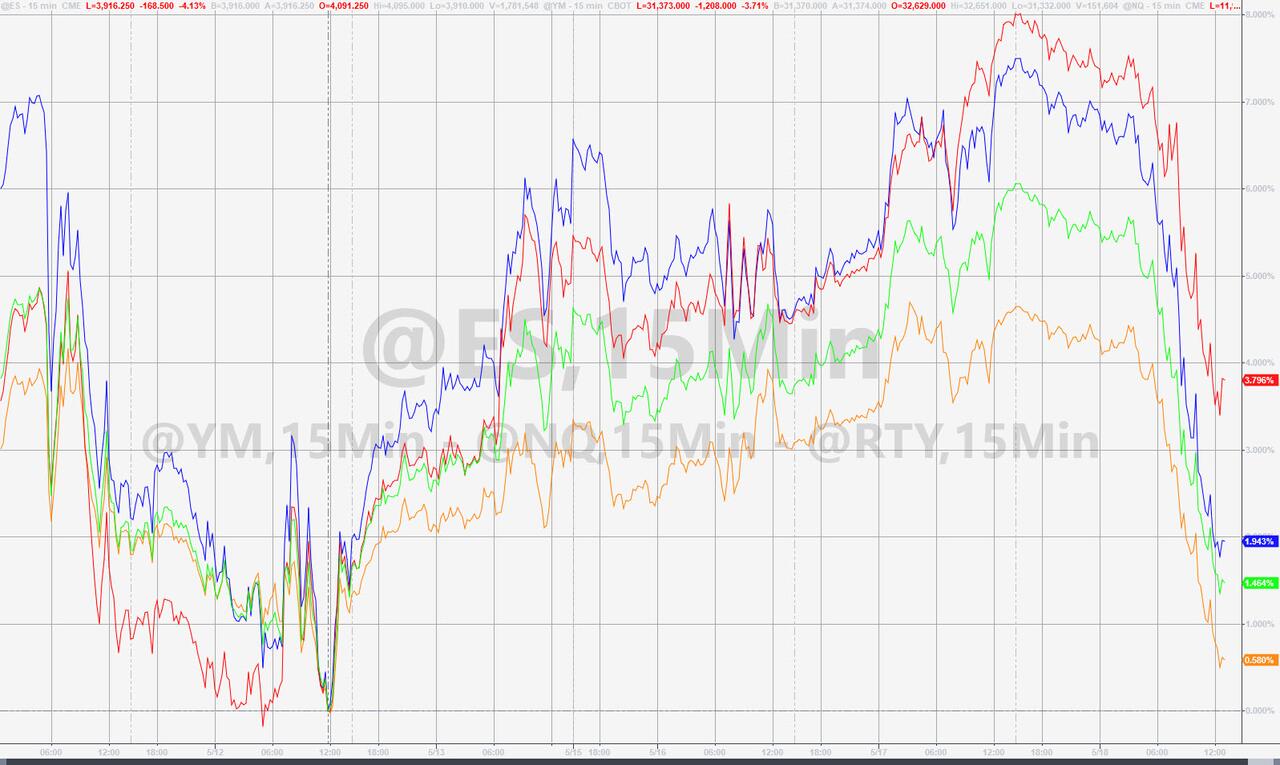
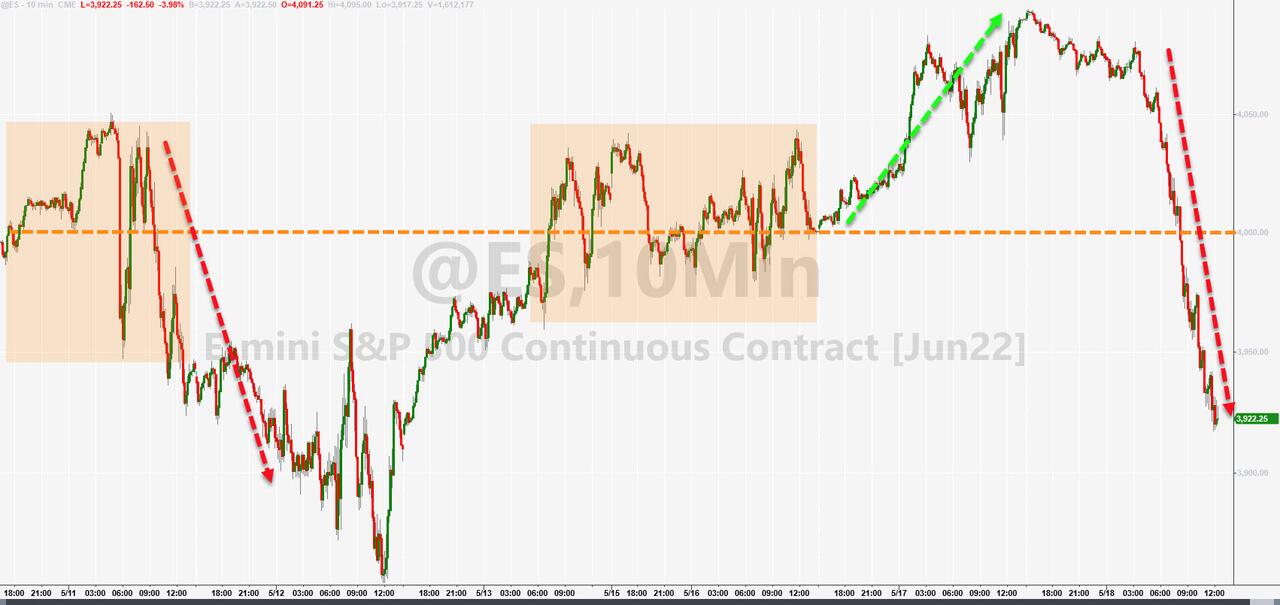
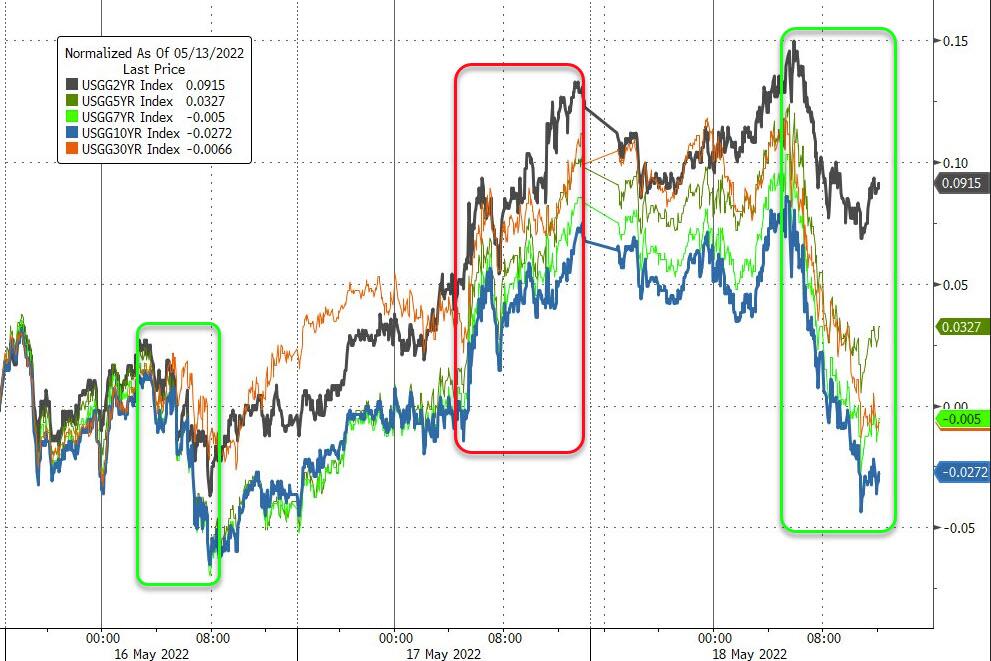
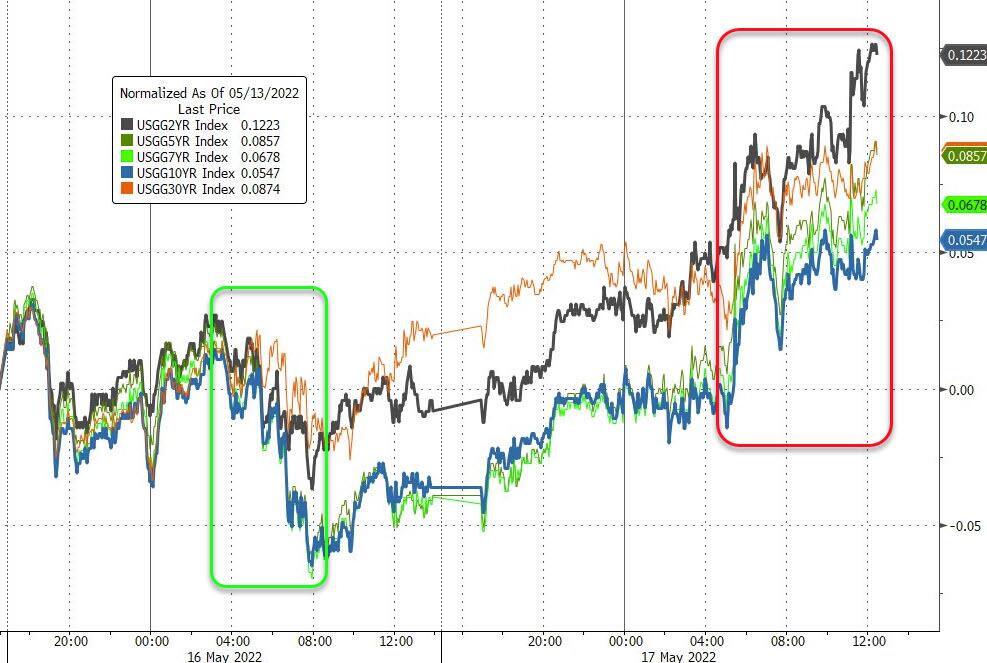
Despite today’s valiant effort, the S&P 500 fell short of recapturing its 4k level, as bonds were spanked, with the yield on the 10-year rising over 7 bps to 2.862%. That caused the widely held bond ETF TLT to drop -1.65% on the session, which brought its YTD performance down to -20.03%. Ouch!
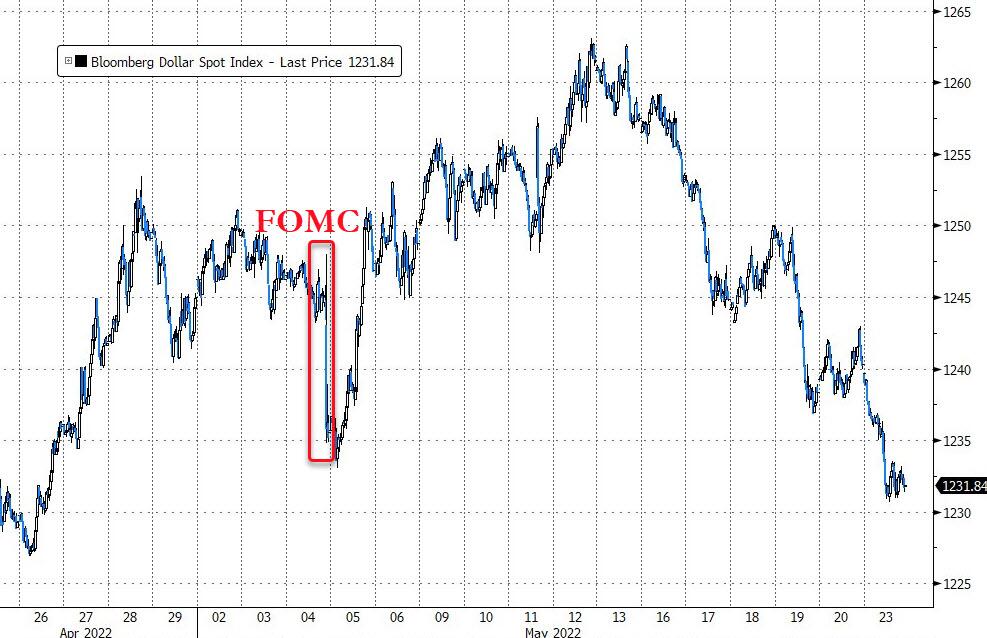
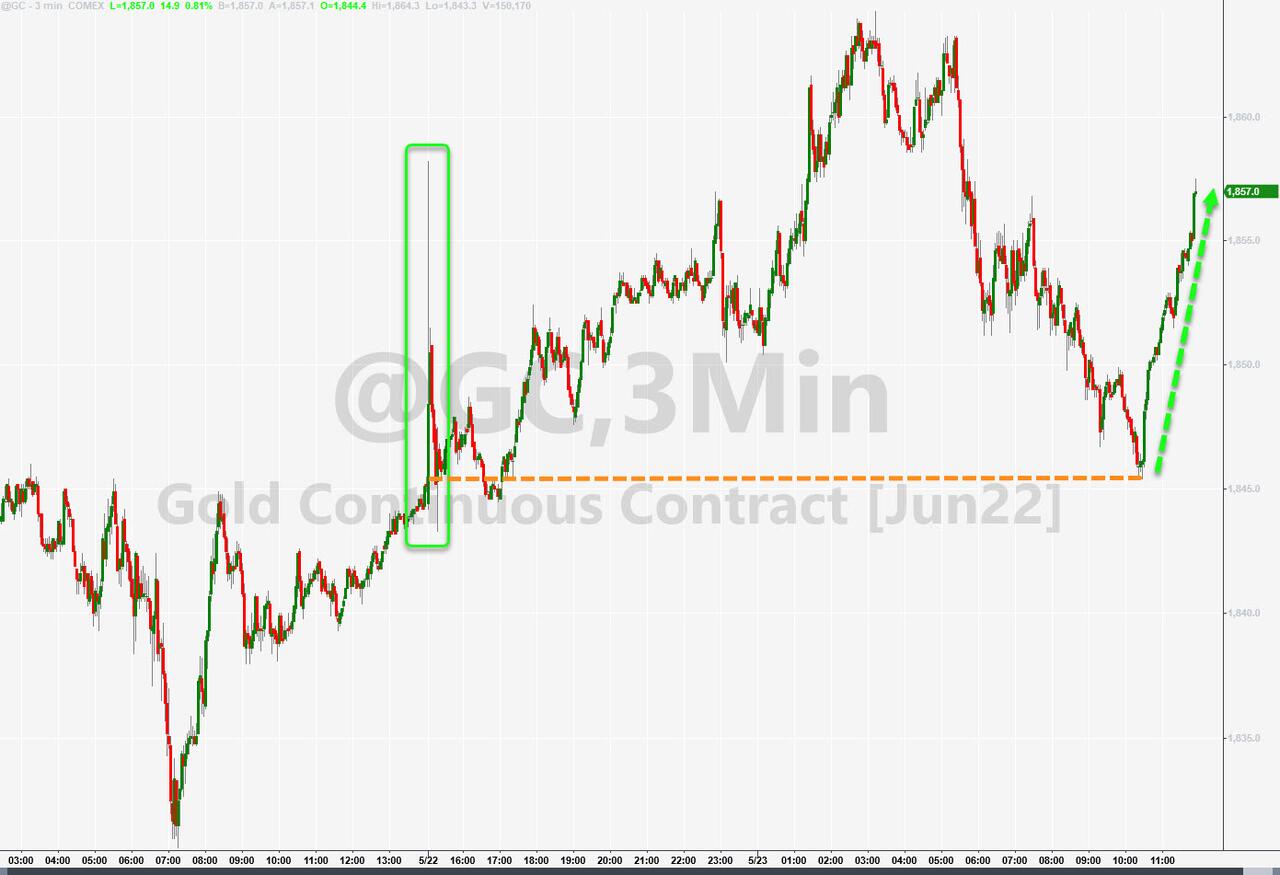
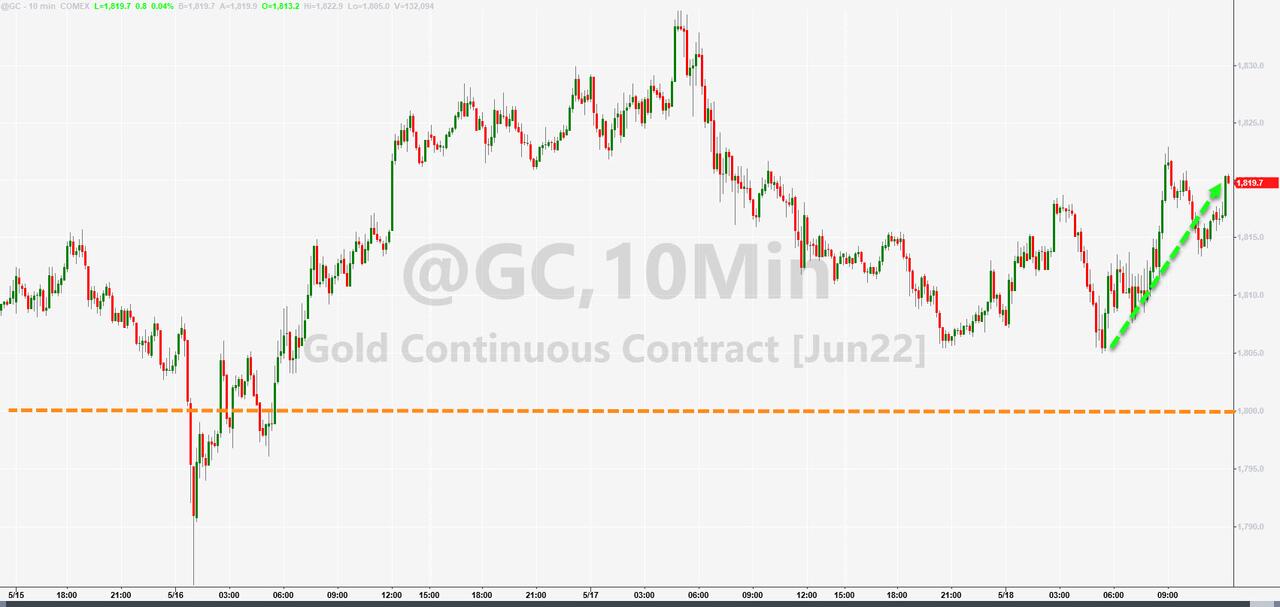
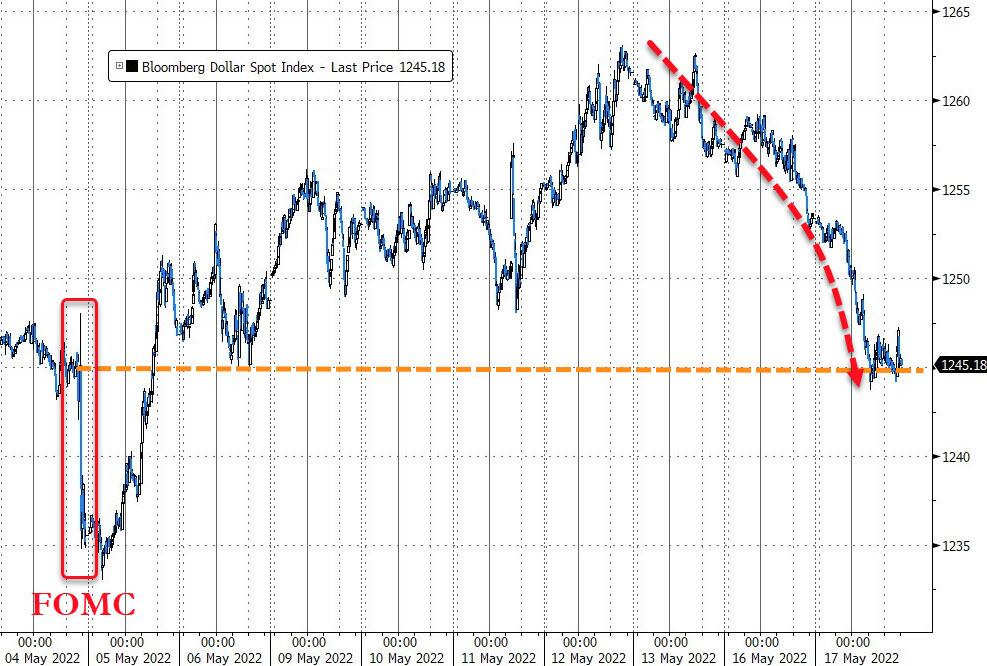
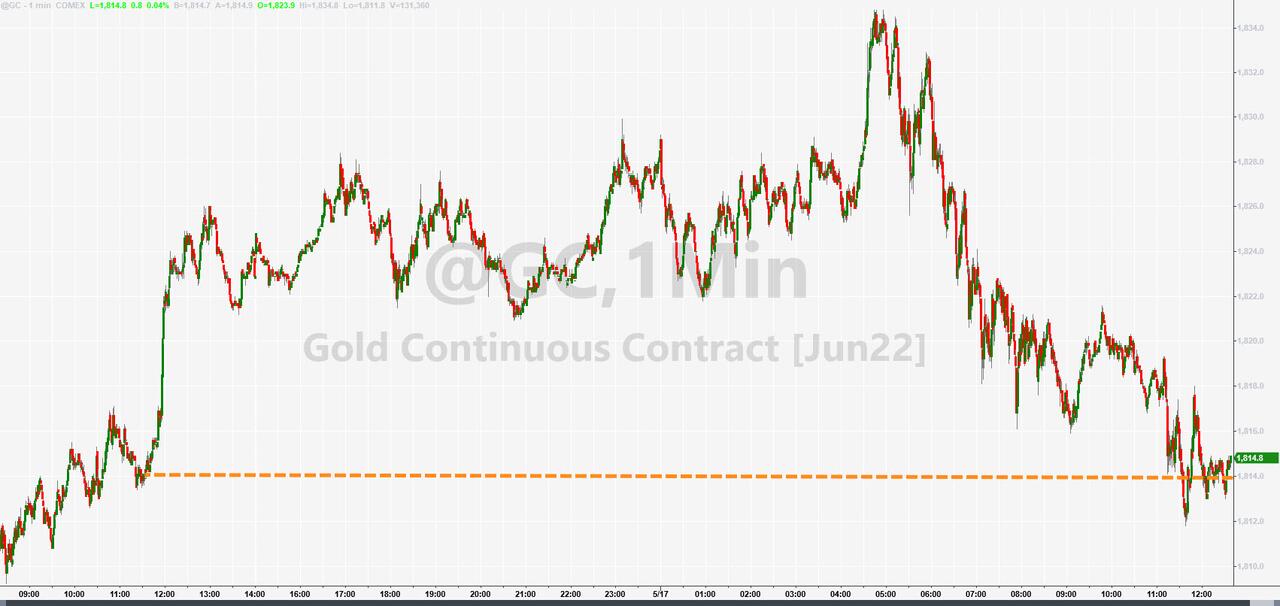
The US Dollar continued its slide, and gold rebounded 0.53% to inch closer toward its $1,900 level.
While today’s bounce gave traders some warm and fuzzy feelings, this bear market is far from being over, but it may take a pause and could very well present us with another head fake.
Read More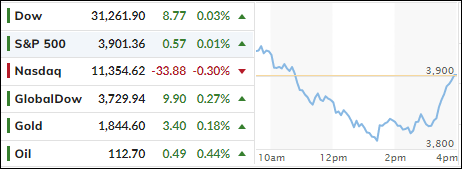
