Below, please find the latest High-Volume ETF Cutline report, which shows how far above or below their respective long-term trend lines (39-week SMA) my currently tracked ETFs are positioned.
This report covers the HV ETF Master List from Thursday’s StatSheet and includes 312 High Volume ETFs, defined as those with an average daily volume of more than $5 million, of which currently 16 (last week 19) are hovering in bullish territory. The yellow line separates those ETFs that are positioned above their trend line (%M/A) from those that have dropped below it.
In case you are not familiar with some of the terminology used in the reports, please read the Glossary of Terms. If you missed the original post about the Cutline approach, you can read it here.
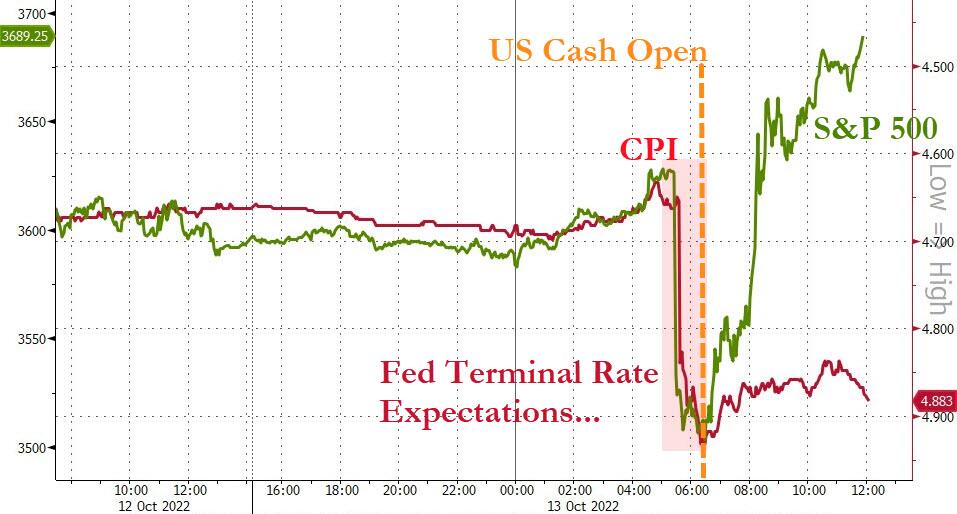
Yesterday’s market reversal, that saw Dow swing from a minus 500 points to a plus 800 points, marked the fifth largest in history. The worse than expected CPI report (+8.2% YoY), with the core number surging to 40-year highs, slammed the markets, but a sudden turnaround created a massive rally with the major indexes ending the session solidly in the green.
From my vantage point there was more involved than meets the eye, and I suspect that the Plunge Protection Team (PPP) stepped in to avoid a total market meltdown and pushed the indexes higher, after which the enormous number of shorts were forced to liquidate thereby creating a massive short squeeze and turning bad news into a good outcome for the markets.
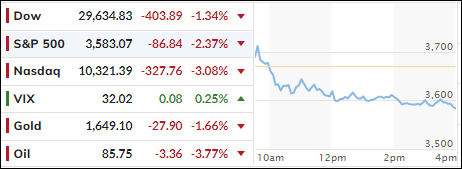
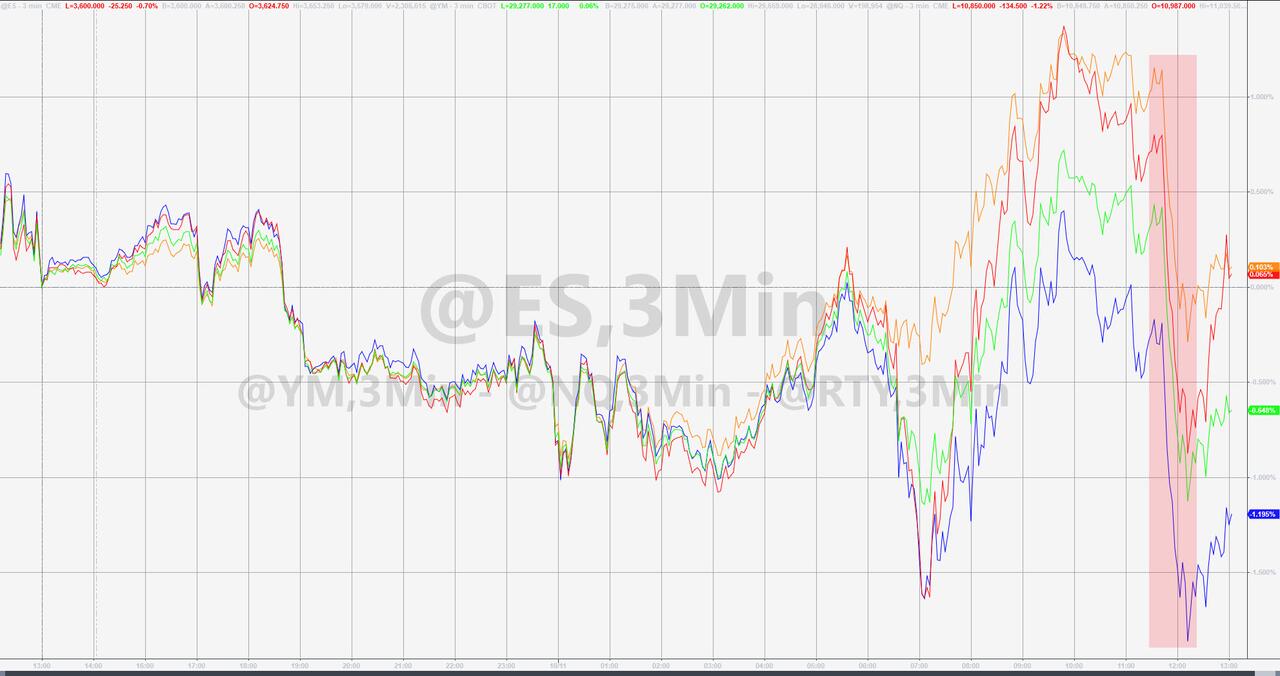
As is the case with engineered market direction, the outcome very often results in nothing more than a dead-cat-bounce. And that is exactly what was confirmed today, as the bears took charge and installed some realism by knocking the indexes off yesterday’s level. The S&P 500’s gain of +2.6% was pretty much wiped out by today’s -2.37% loss, which put the index right back to where it started the month.
Contributing to today’s weakness was a consumer survey by the University of Michigan showing that inflation expectations were increasing, a sentiment that is watched closely by the Fed and may influence their future actions.
Not helping the bullish theme were reports of a brewing banking crisis. Last week, it was the BoE, which had to step in to save its bonds from crashing and by extension, their pension funds from collapsing.
Then, a few days ago, we learned that the Fed quietly wired some $3 billion to Switzerland, which was followed today by another $6.3 billion. Judging by recent reports, there is a dollar funding shortage very likely connected with the latest news about the Credit Suisse bank having “issues.”
ZeroHedge summed it up like this:
And speaking of the coming crisis, recall what we said at the start of September: the coming Fed pivot will have nothing to do with whether the Fed hits or doesn’t hit its inflation target, and everything to do with the devastation unleashed by the soaring dollar (a record margin call to the tune of some $20 trillion) on the rest of the world.
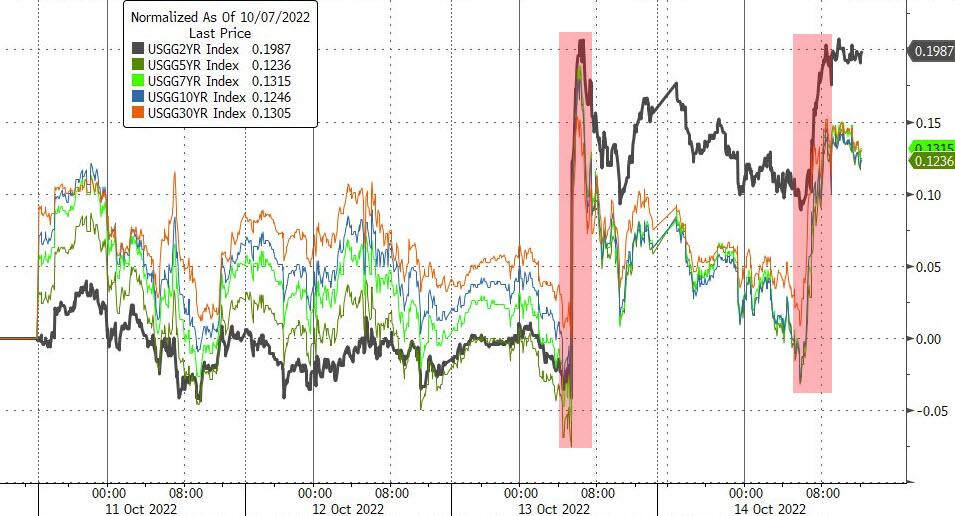
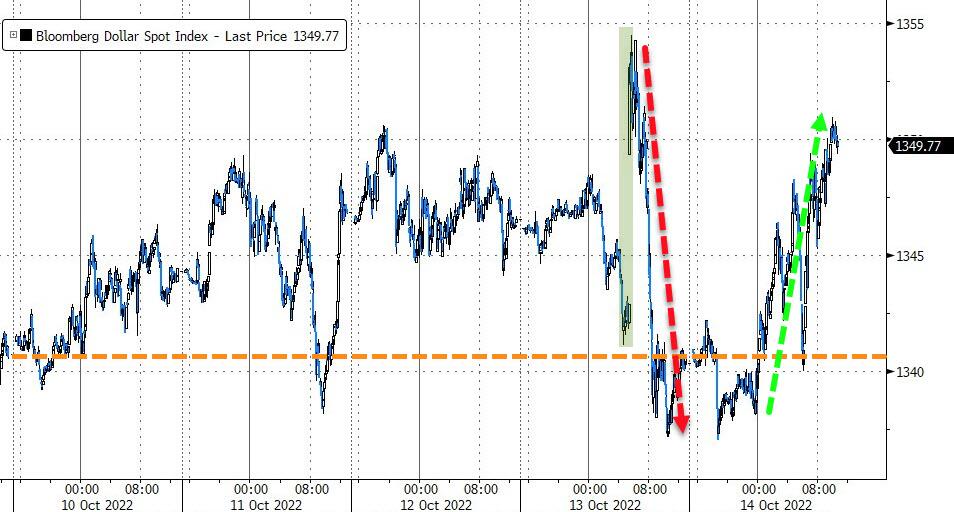
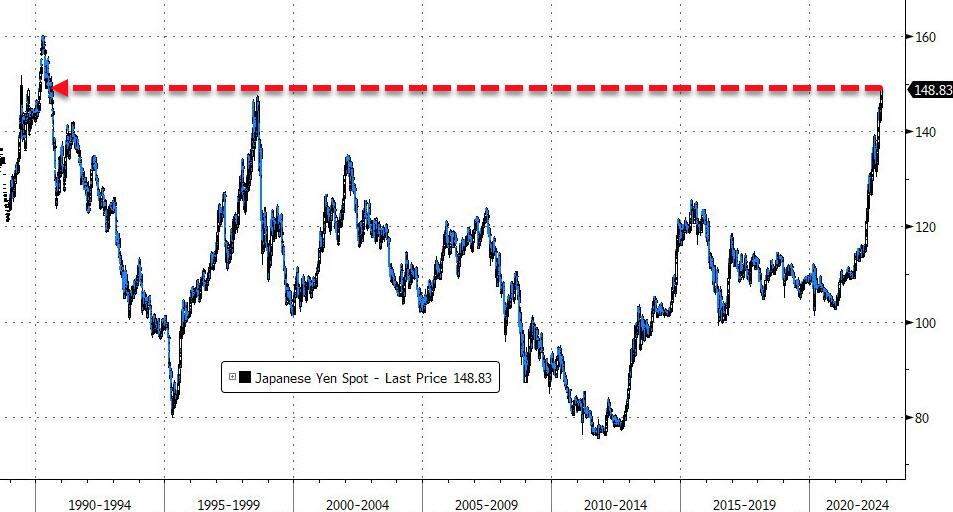
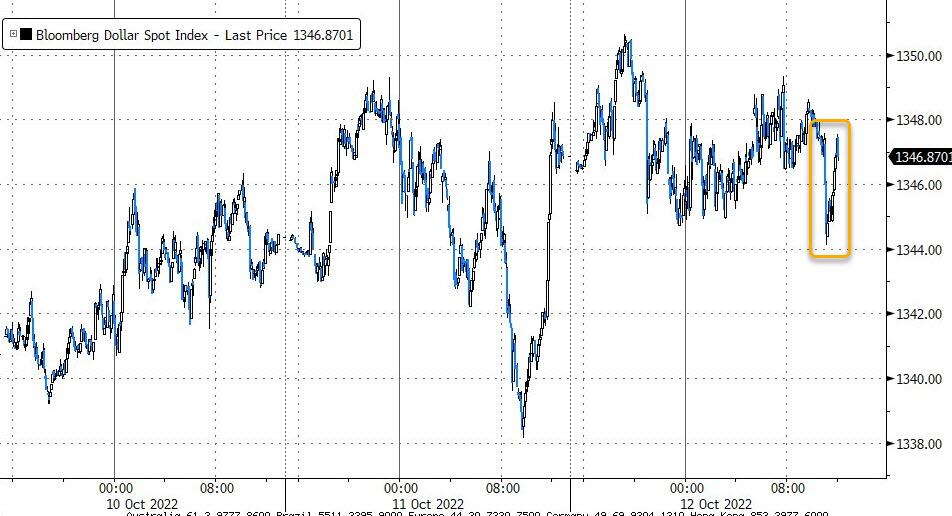
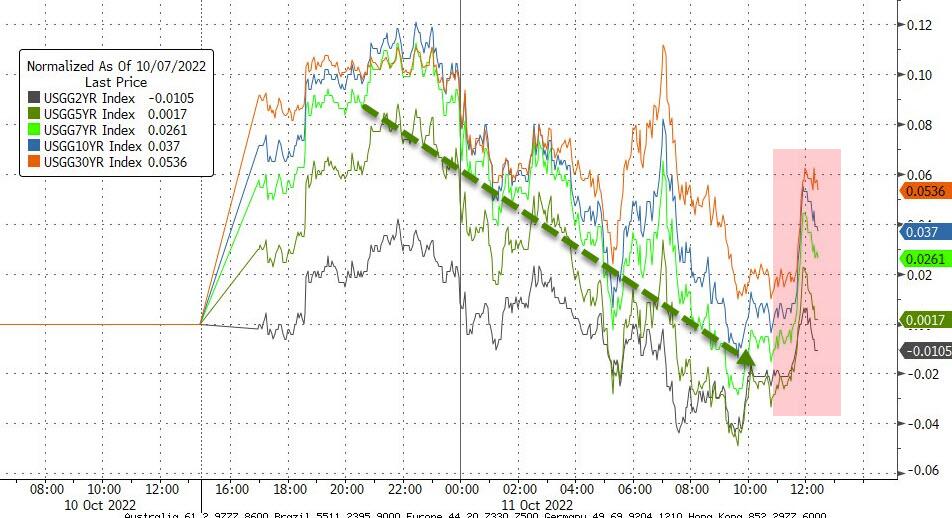
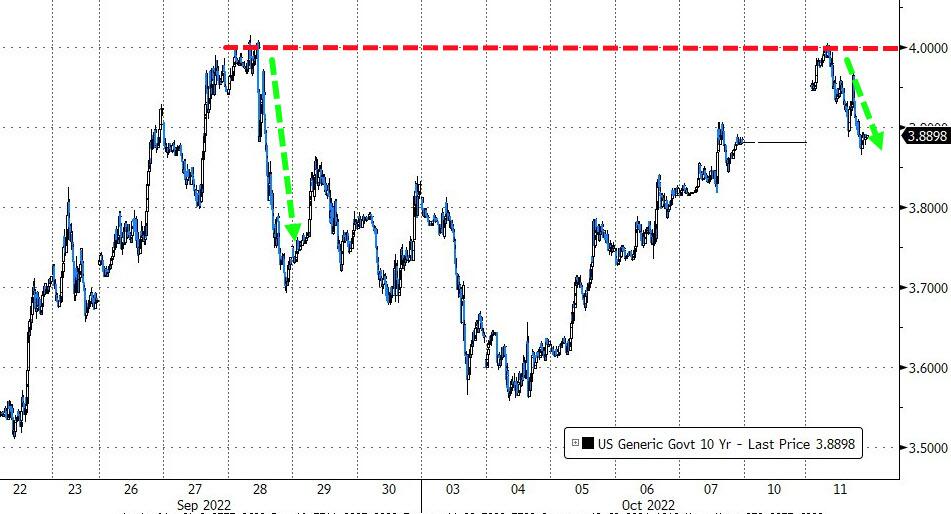
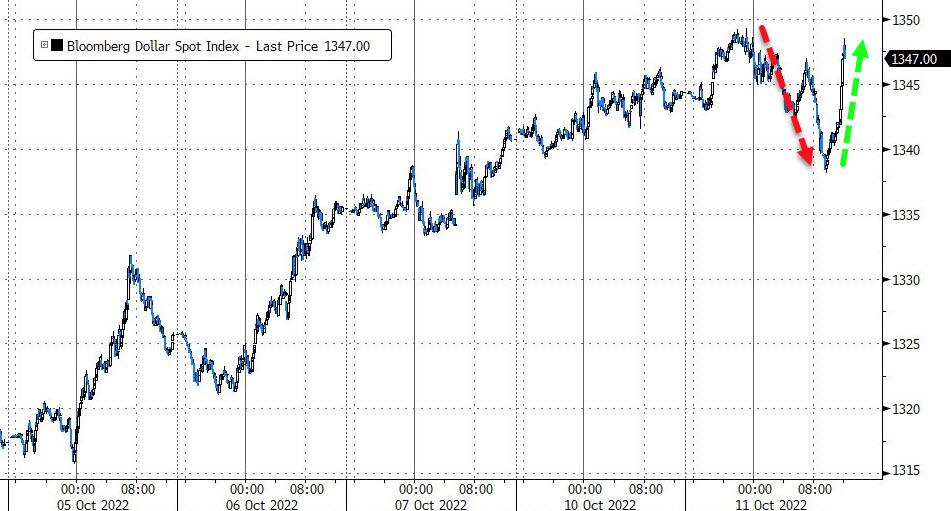
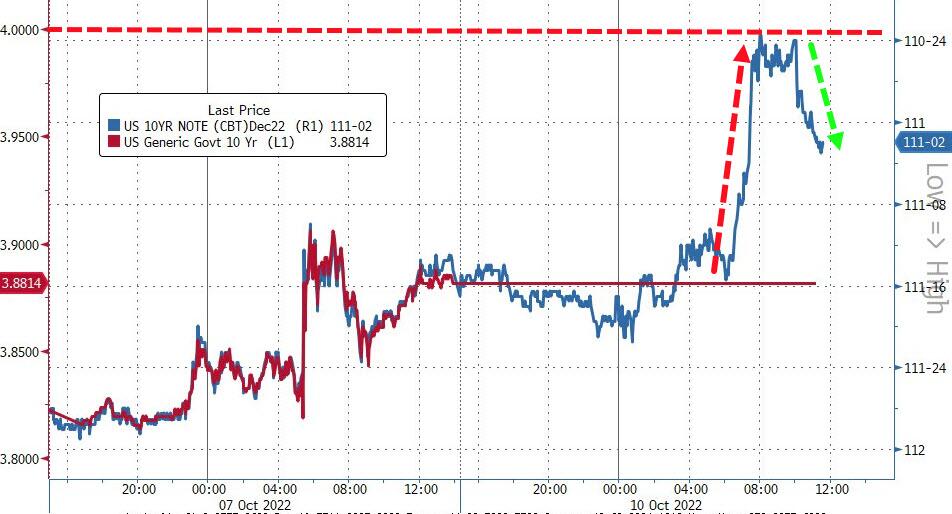
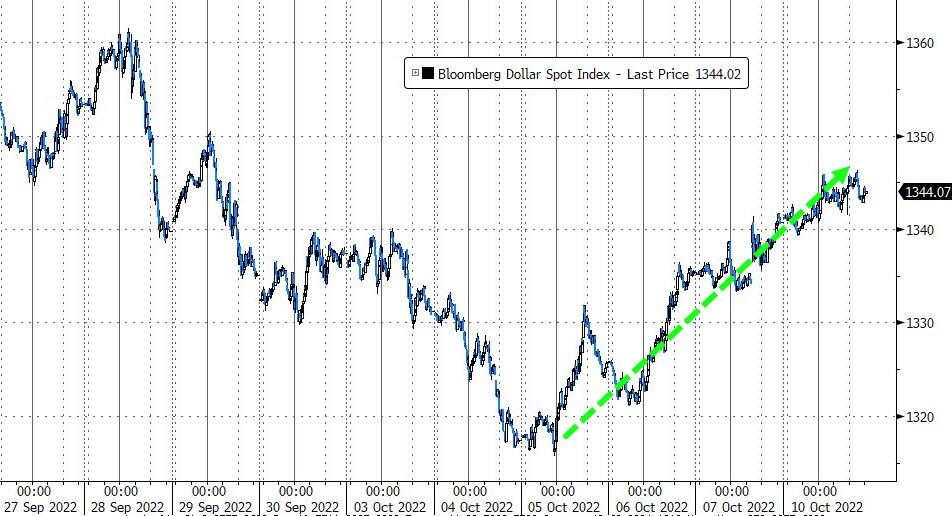
Here is the US, bond yields rallied with the 10-year finally conquering its 4% glass ceiling and closing above it at 4.02%. The US Dollar swung wildly but rallied for a second straight week, which crashed the Japanese Yen to its weakest since 1990! Ouch.
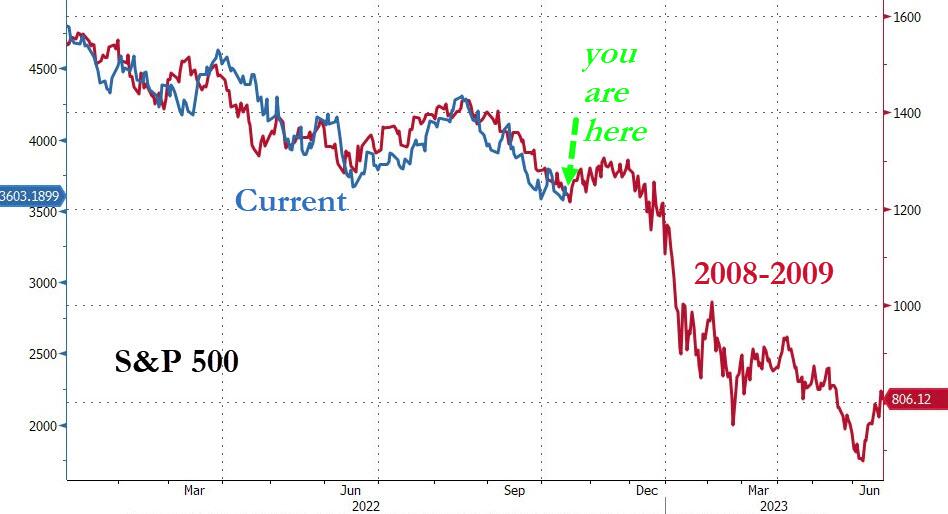
After another wild week, which should have finally made it clear that the best spot to watch this carnage from is sitting in cash on the sidelines, the analog to 2008-2009 remains disconcertingly on track.
ETF Data updated through Thursday, October 13, 2022
Methodology/Use of this StatSheet:
1. From the universe of over 1,800 ETFs, I have selected only those with a trading volume of over $5 million per day (HV ETFs), so that liquidity and a small bid/ask spread are assured.
2. Trend Tracking Indexes (TTIs)
Buy or Sell decisions for Domestic and International ETFs (section 1 and 2), are made based on the respective TTI and its position either above or below its long-term M/A (Moving Average). A crossing of the trend line from below accompanied by some staying power above constitutes a “Buy” signal. Conversely, a clear break below the line constitutes a “Sell” signal. Additionally, I use a 12% trailing stop loss on all positions in these categories to control downside risk.
3. All other investment arenas do not have a TTI and should be traded based on the position of the individual ETF relative to its own respective trend line (%M/A). That’s why those signals are referred to as a “Selective Buy.” In other words, if an ETF crosses its own trendline to the upside, a “Buy” signal is generated. Here too, I recommend trailing sell stop of 12%, or less, depending on your risk tolerance.
If you are unfamiliar with some of the terminology, please see Glossary of Termsand new subscriber information in section 9.
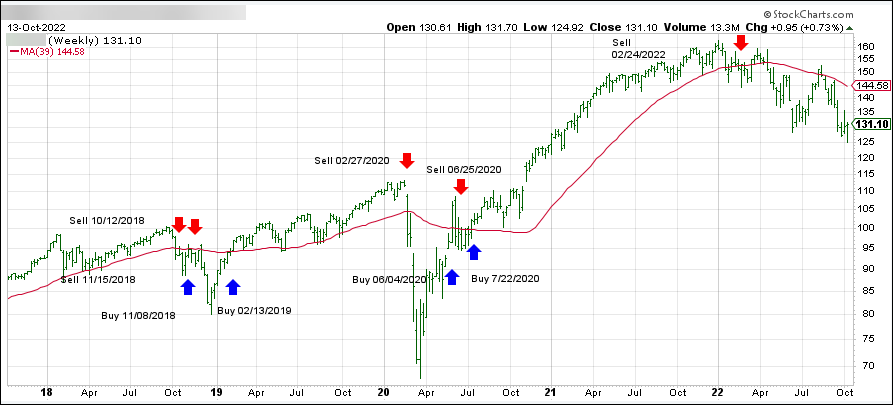
1. DOMESTIC EQUITY ETFs: SELL — since 02/24/2022
Click on chart to enlarge
Our main directional indicator, the Domestic Trend Tracking Index (TTI-green line in the above chart) has broken below its long-term trend line (red) by -9.78% and remains in “SELL” mode.
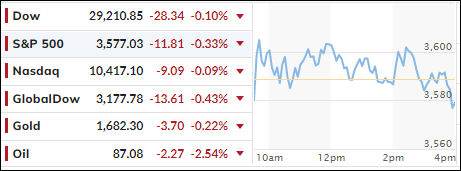
Today’s Producer Price Index (PPI) was a mixed bag and turned out to be a yawner for the stock market. While the PPI climbed 0.4% in September, which was twice the forecast of 0.2%, year over year, however, it rose 8.5%, which was an improvement from August’s 8.7% increase.
The major indexes interpreted that as inconclusive and spent the session chopping around their respective unchanged lines with not much gained or lost. The S&P 500 was the worst performer sporting a negative -0.33% and notched its 6th day of losses.
The Fed’s September meeting notes were released, as MarketWatch reported:
The minutes showed that the central bank expects to keep hiking interest rates and keep them high until inflation shows signs of cooling off.
On the other hand, one comment in the minutes led to optimism that the Fed might slow its tightening campaign or even walk it back if there was more financial market turbulence.
Of course, traders are always looking for optimism in Fed Statements, but today that hope was dampened somewhat when Chicago Fed President Charles Evans suggested that job losses were an acceptable circumstance:
If unemployment goes up, that’s unfortunate. If it goes up a lot, that’s really very difficult. But price stability makes the future better.
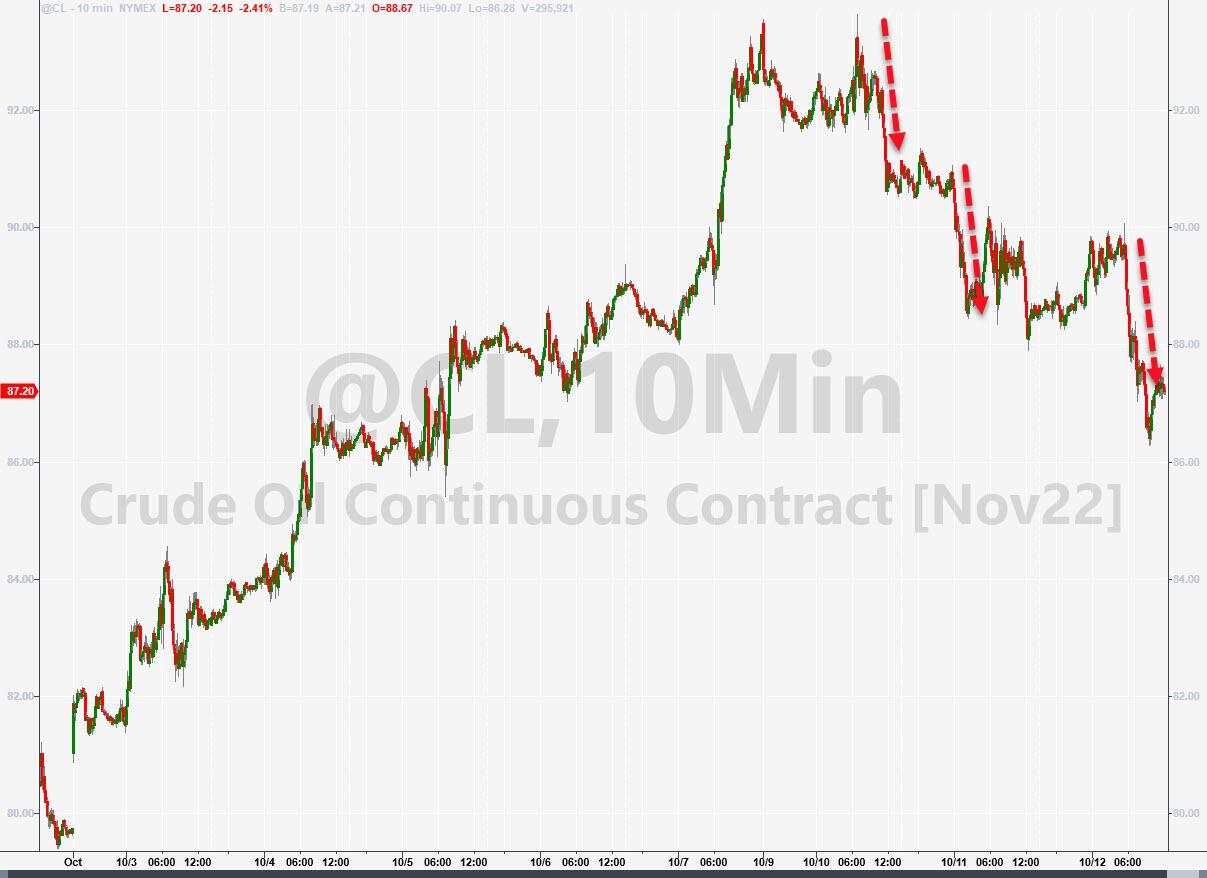
Bond yields slipped, the US Dollar dipped, while Crude Oil dropped for the 3rd straight session to end at $87. Gold gained moderately but has a way to go to reclaim its $1,700 level.
Right now, nothing is more on traders’ minds than tomorrows CPI report. As JP Morgan pointed out, consensus expects to see inflation increase 8.1% from a year ago in September. Anything above the prior reading of 8.3% could put the stock market at risk of a quick 5% tumble.
It promises to be an interesting day, but I think whatever magnitude the initial market reaction may be, it likely will be limited in duration.
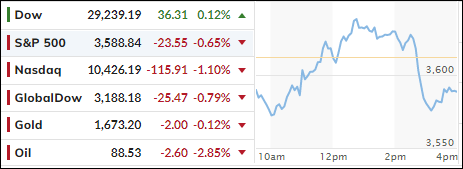
An early morning ramp-a-thon pushed equities into the green, with the Dow at one moment sporting a 400-point gain but, things turned sour quickly, and the major indexes dove into the close.
Only the Dow managed to cling to its unchanged line, while the S&P and Nasdaq ended solidly in the red with the former now scoring a 5-day losing streak. For sure, key inflation data caused uncertainty with the PPI due out tomorrow, followed by the CPI on Thursday. Rounding out week will be retail sales on Friday and the beginning of earnings season.
Causing late dive in the markets was a report from the Bank of England indicating that its intervention will be over soon and that pension funds have just three days to rebalance positions. For sure, that was tough talk, now we’ll have to wait and see if it was simply a bluff with the bailout scheme scheduled to continue.
Bond yields were mixed and slipped a tad, but the 10-year kissed its 4% level again before backing off into the close. The US Dollar rode a roller coaster and scored only a slight gain.
All eyes are now on tomorrow’s Producer Price Index report, which could create much volatility by pushing markets in either direction.
While the major indexes closed off their intra-day lows, they nevertheless scored another loss, as several rally attempts did not hold, and south we went.
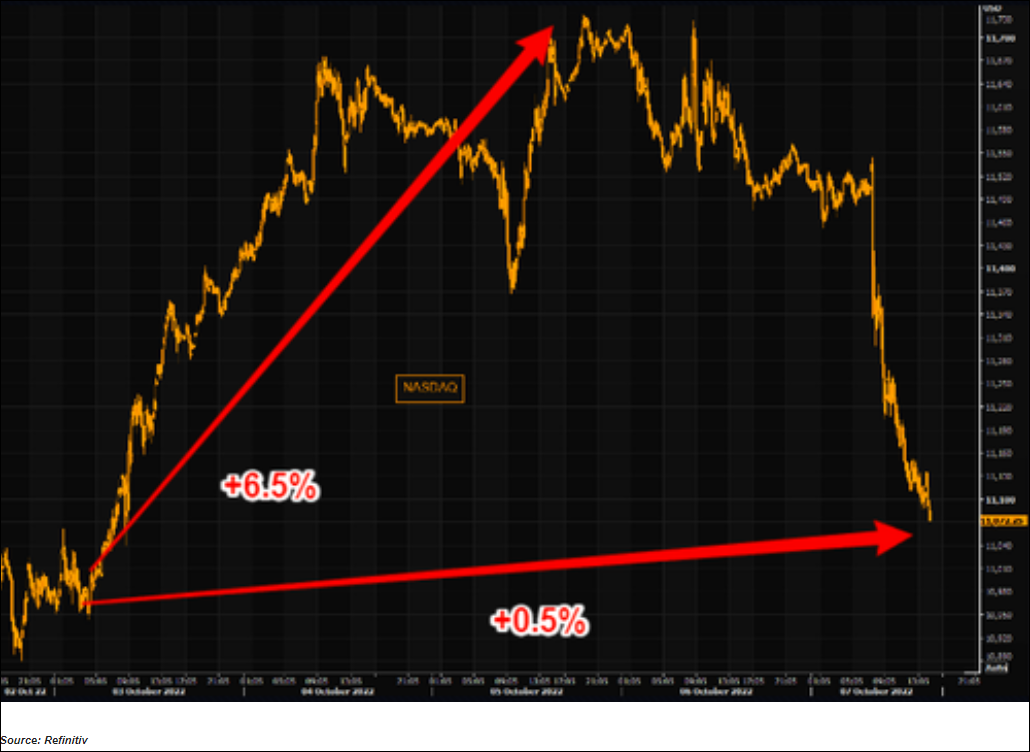
As I pointed out last week, the massive rebound, that propelled the Nasdaq some 6.5% higher on Monday and Tuesday turned out to be another head fake with the index surrendering all gains over the next 3 trading days:
The baseball term “Going, going, gone…” clearly applies here, as bear market bounces can be fast and furious, but they usually tend to fall apart quickly, as we witnessed.
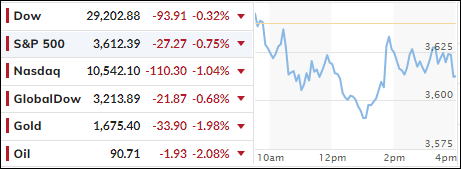
Adding more insult to injury was today’s session, which pushed the index down by another -1.04% to its lowest in over 2 years, as tech shares continue to be hardest hit in this environment of spiking interest rates.
As a result, we saw more of the same weakness, despite the US bond markets being closed. However, bond futures traded and added more pain to equities via higher yields, the continuation of which we may see tomorrow. Fortunately, during the end of the session, yields came off their highs.
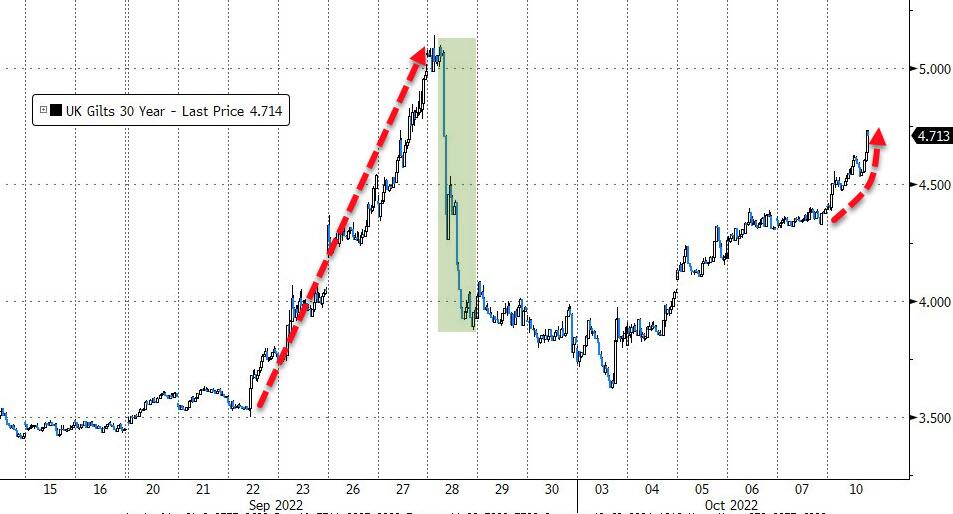
Despite the BoE recent attempt to bail out their bond markets, and efforts to present a new plan, their market broke again with their 30-year Gilt (bond) yields racing higher by a stunning 29bps and almost reaching last month’s high, when the bank slammed on the emergency brake.
Since all Central Banks are tied at the hip, some of England’s issues could very well travel across the Atlantic and affect markets here in the US. My point is that bonds are no longer the ‘safe haven’ they were advertised to be and not being exposed to them is a wise investment decision.
The Fed’s Brainard offered these words of wisdom:
Fed is attentive to risks of further adverse shocks, aware that [market] moves could interact with financial vulnerabilities.” However, she also noted that the “1970s taught [policymakers] that there are risks to easing prematurely”.
In other words, there was no “dovish pivot” present in these remarks, which was disappointing to the always hopeful bullish crowd.
The US Dollar continued its 4-day comeback to one-week highs, as ZeroHedge noted, which caused gold to get hit, with the precious metal dropping below its $1,700 level.
High volatility will remain with us, as Wednesday’s monthly Producer Price Index (PPI) and Friday’s CPI could wreak havoc with markets—in either direction.

