No Place to Hide

Ulli Market Commentary Contact

[Chart courtesy of MarketWatch.com]

  1. Moving the markets

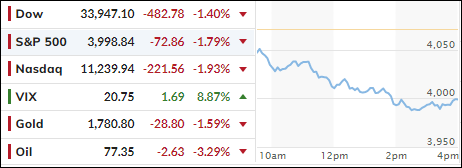
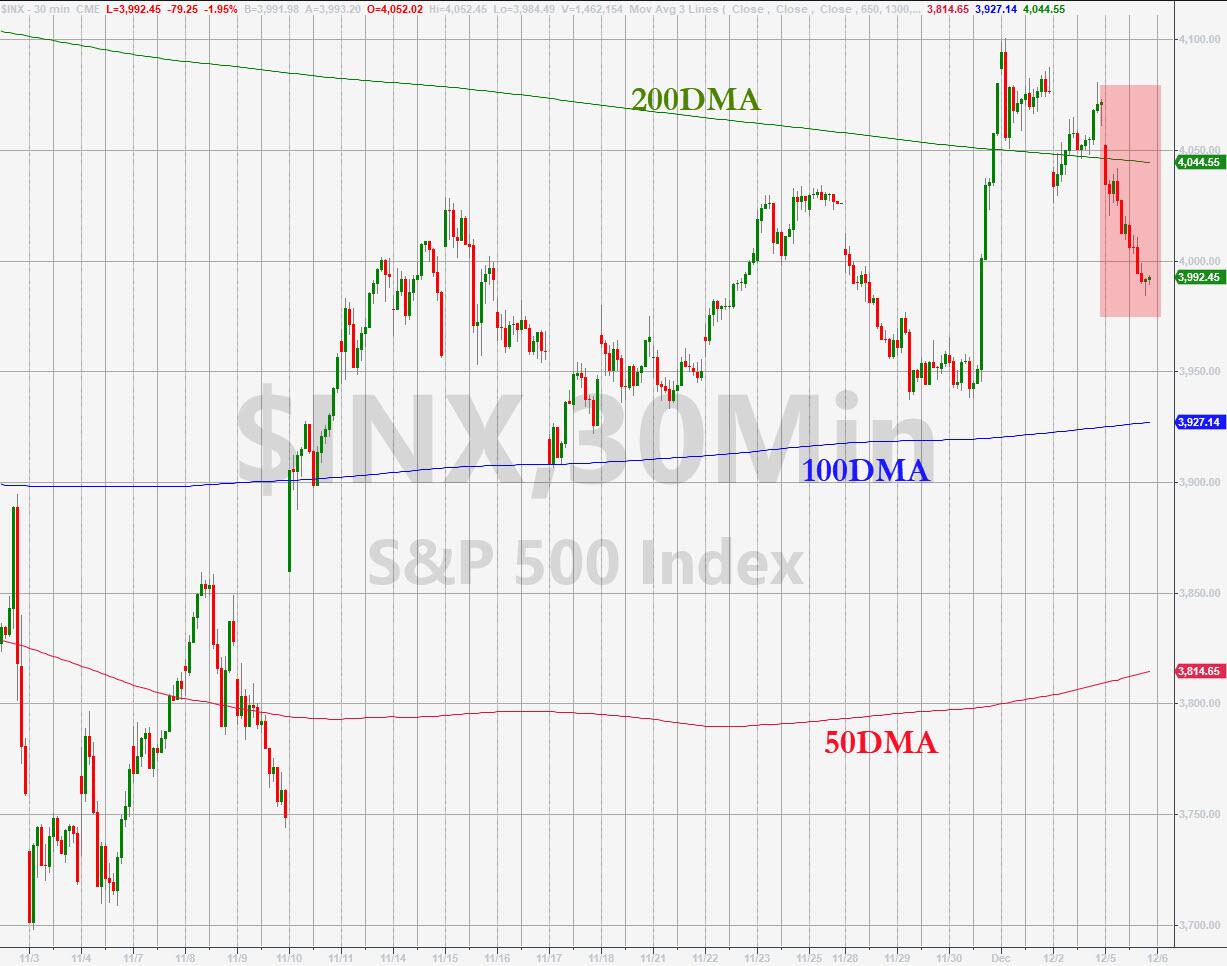
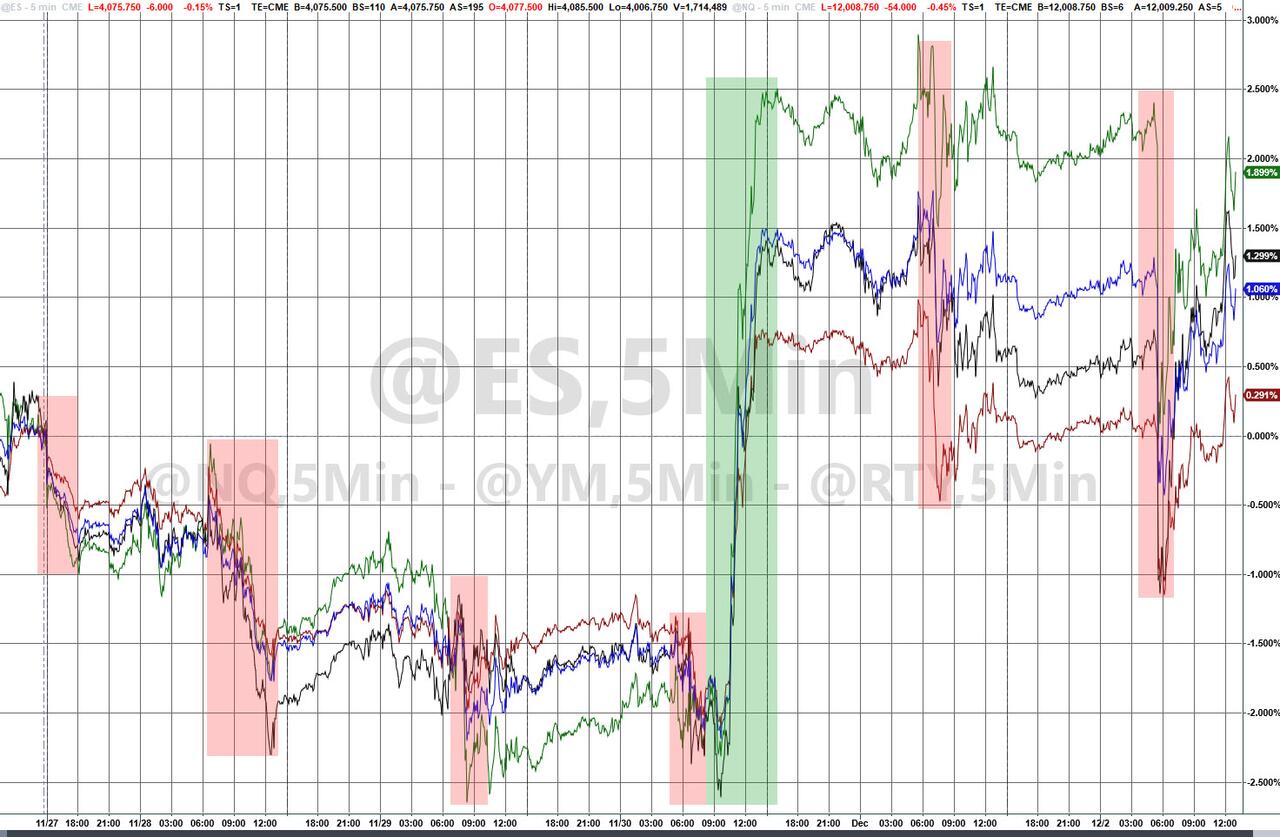
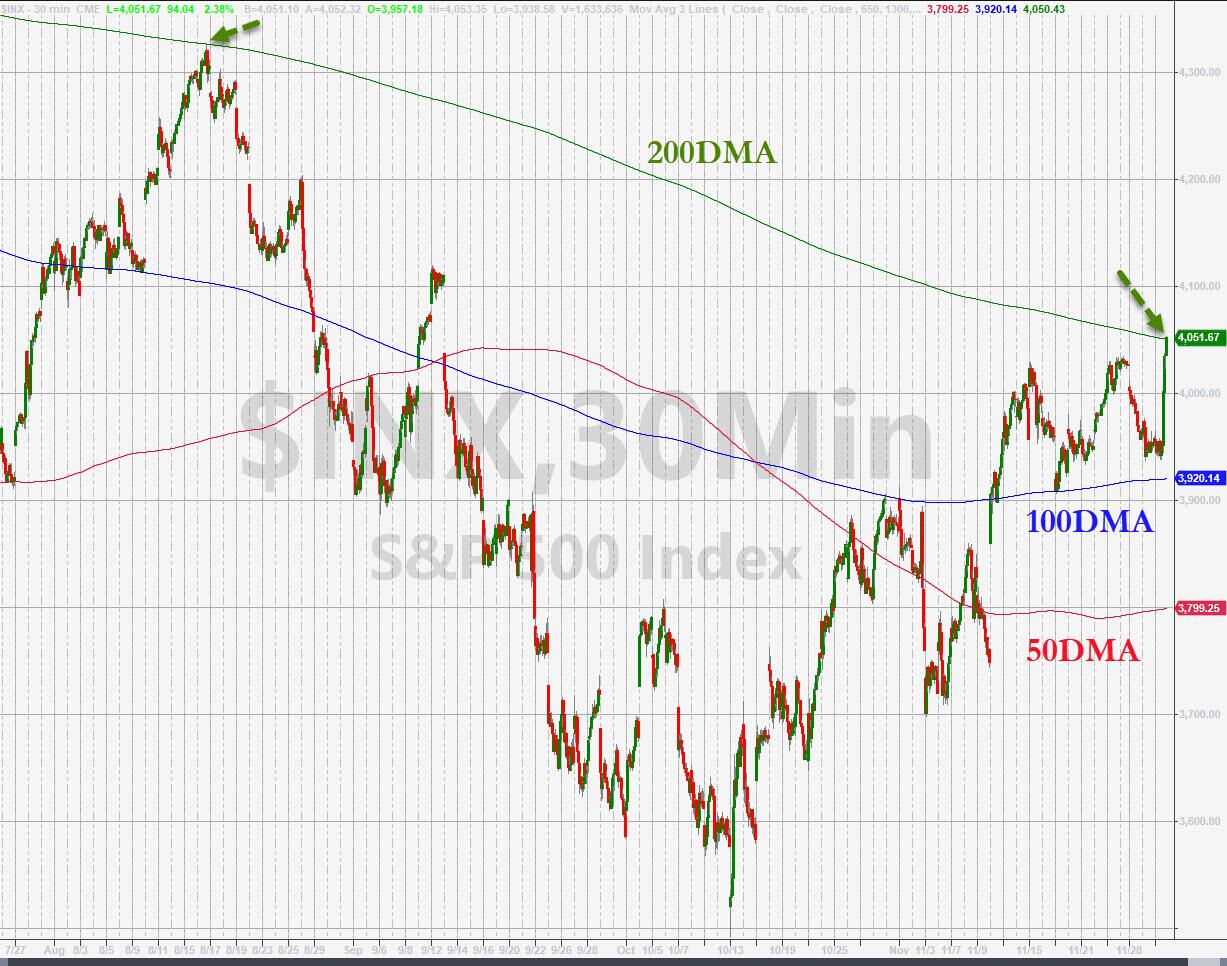
After last week’s rebound, that resulted in the S&P 500 finally breaking through its 200-day M/A, which has served as a glass ceiling since April, none of that feel good bullish sentiment was present today.

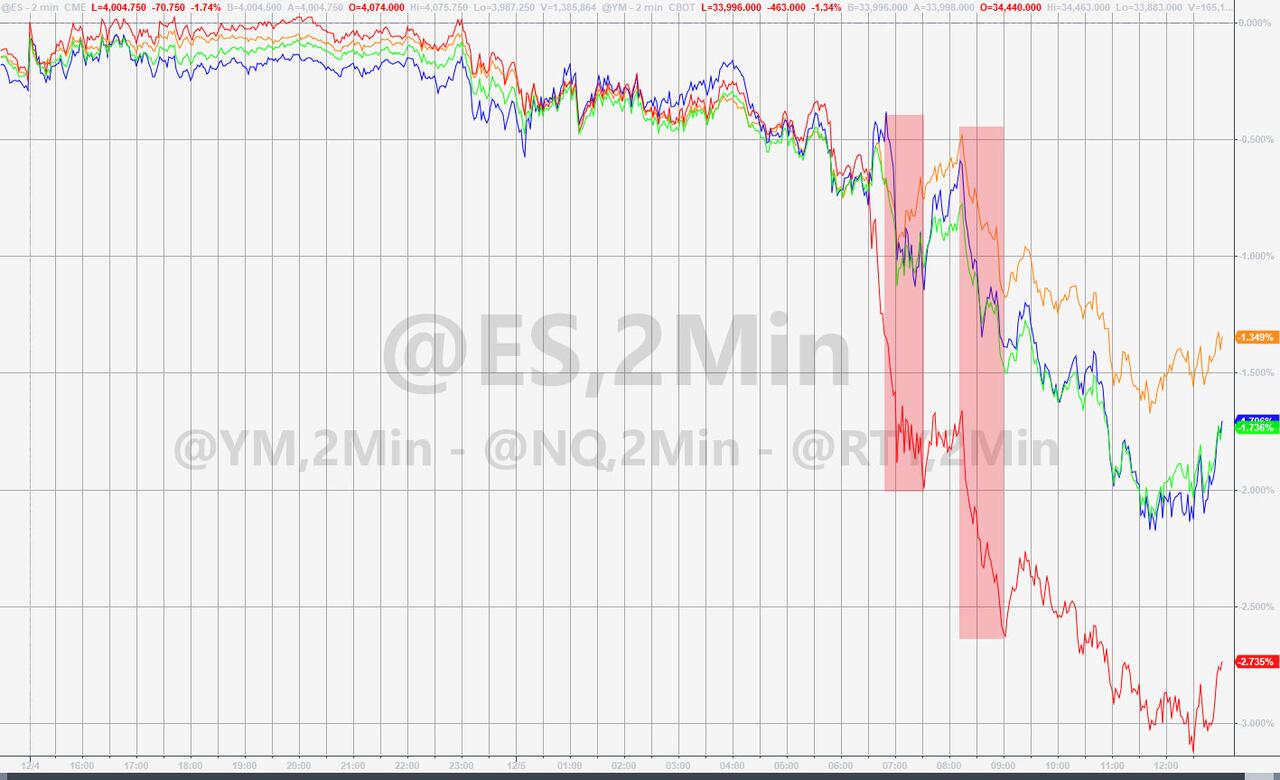
From the opening bell, the major indexes headed south caused by sudden fears that the Fed may not only not pivot but continue its hawkish policies, even as the economy slides further into recession territory.

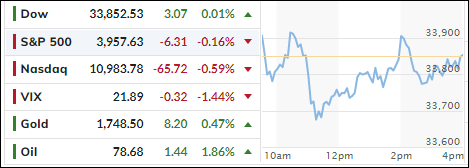
That took the starch out of any remaining bullish momentum, as the broad market tumbled, including heavyweights like Tesla, Microsoft, and Amazon, with the retreat being broad based and leaving no place to hide.

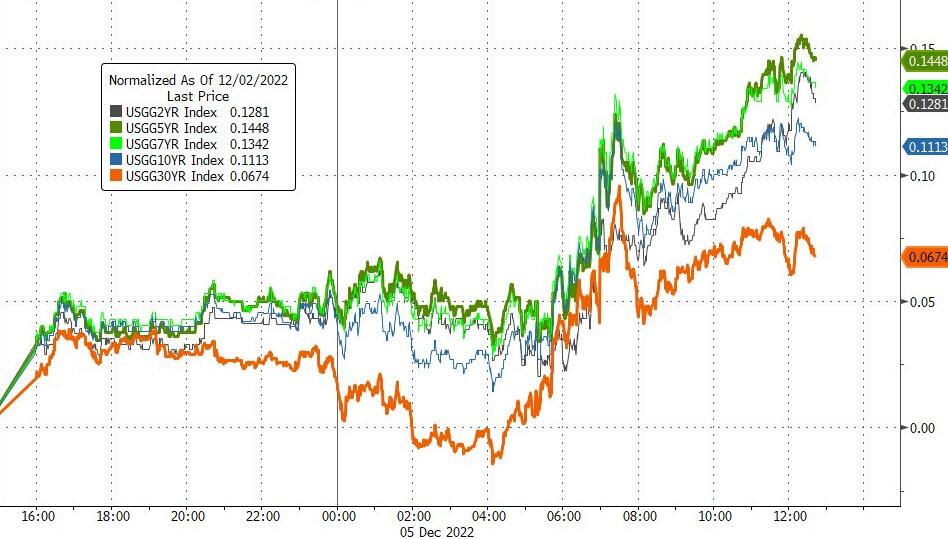
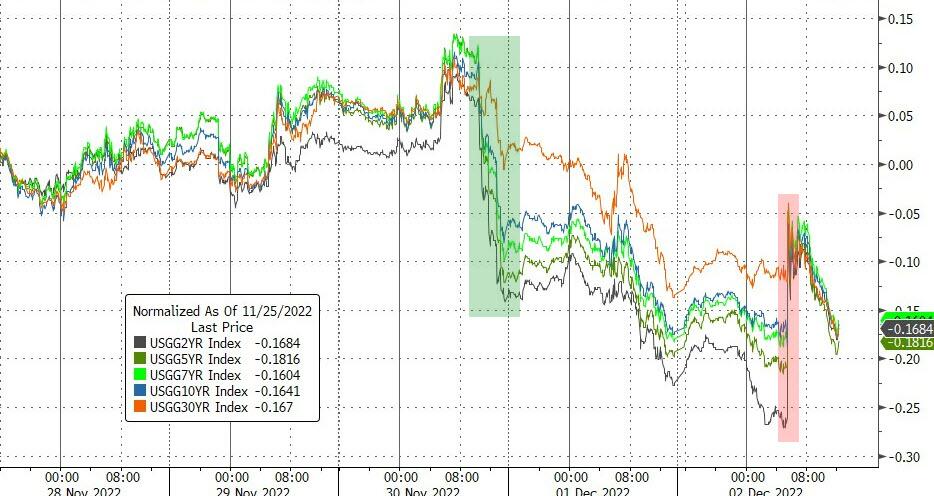
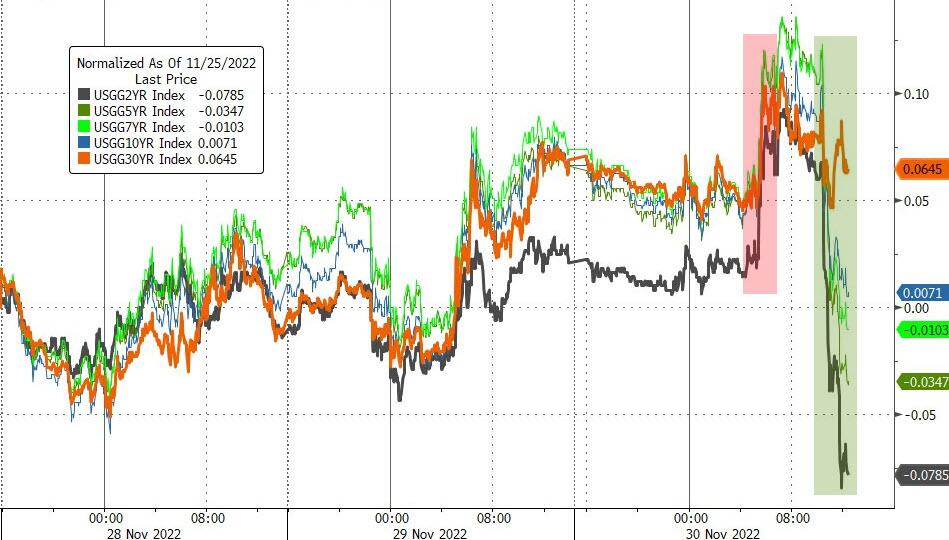
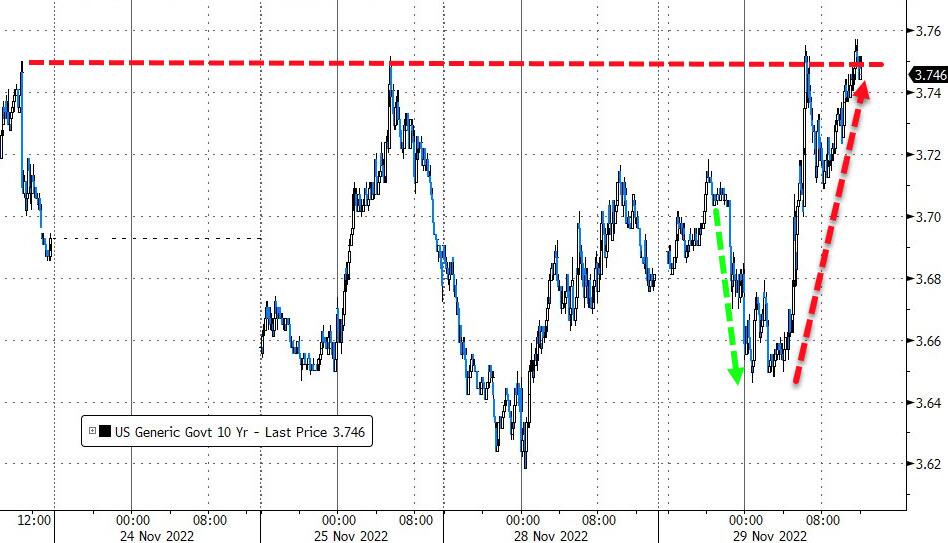
Rising bond yields supported the equity bears, with the 10-year gaining 7 bps to close at 3.6%. The S&P “lost” its 200-day M/A again, which it had just reclaimed, bringing up the question whether conquering this resistance level was simply a head fake.

Fed whisperer Nick Timiraos appeared to walk back some of the market’s post-Powell exuberance, as ZeroHedge called it, in this morning’s WSJ article, as the “higher rates for longer” narrative was pushed, which caused terminal Fed rate expectations to surge.   

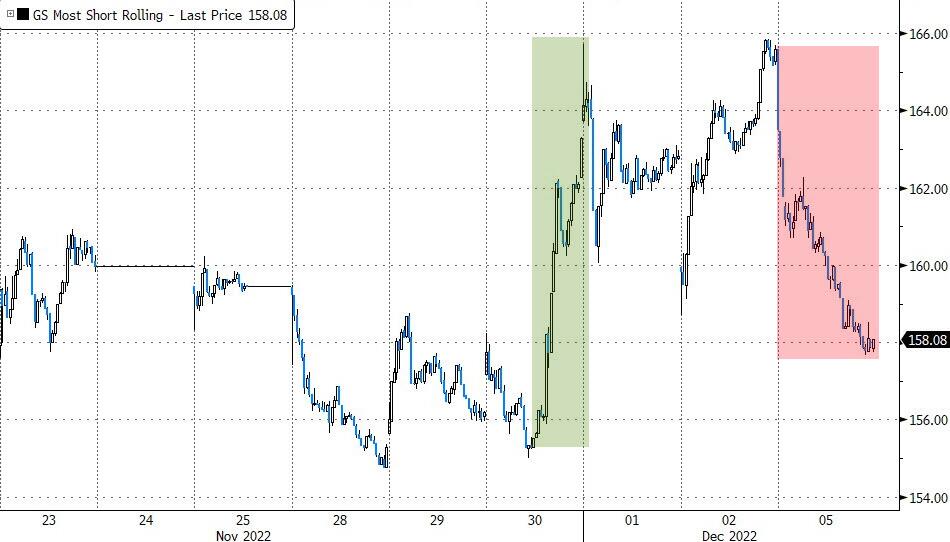
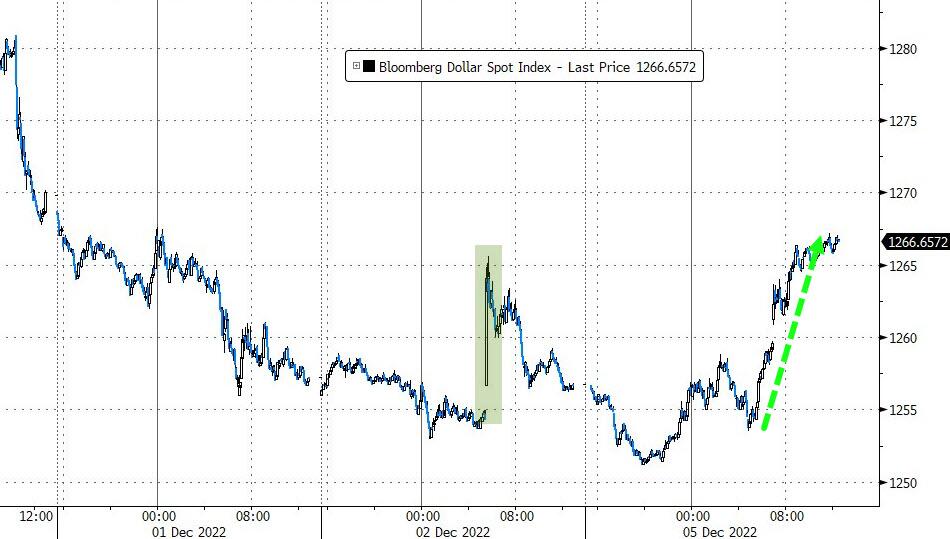
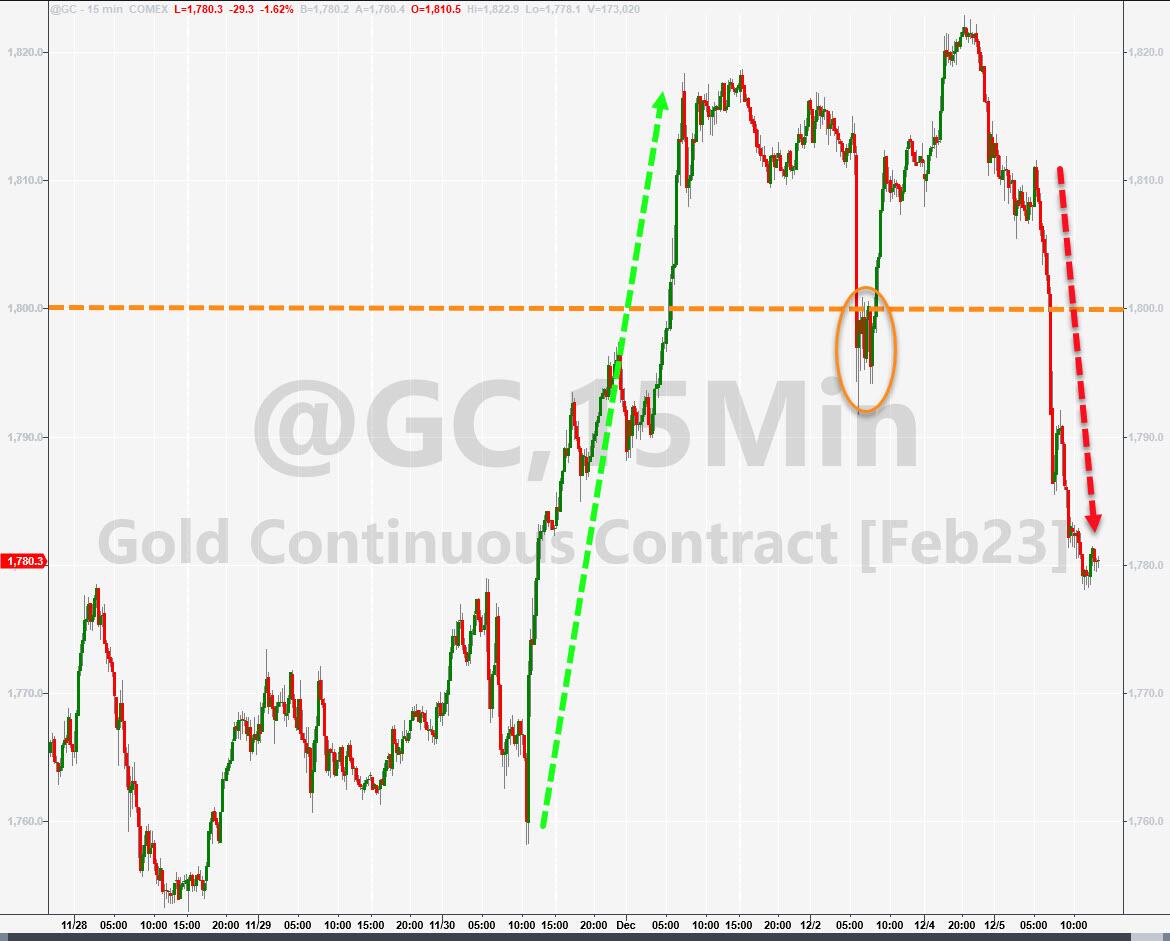
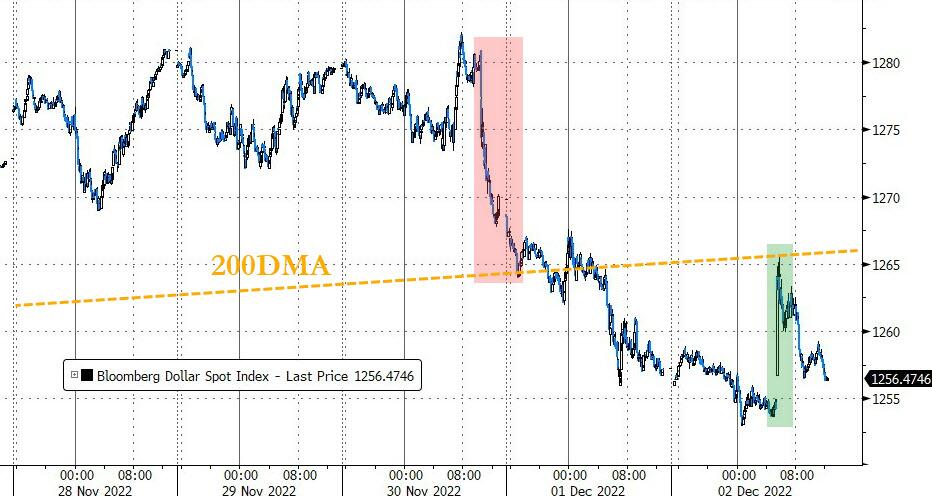
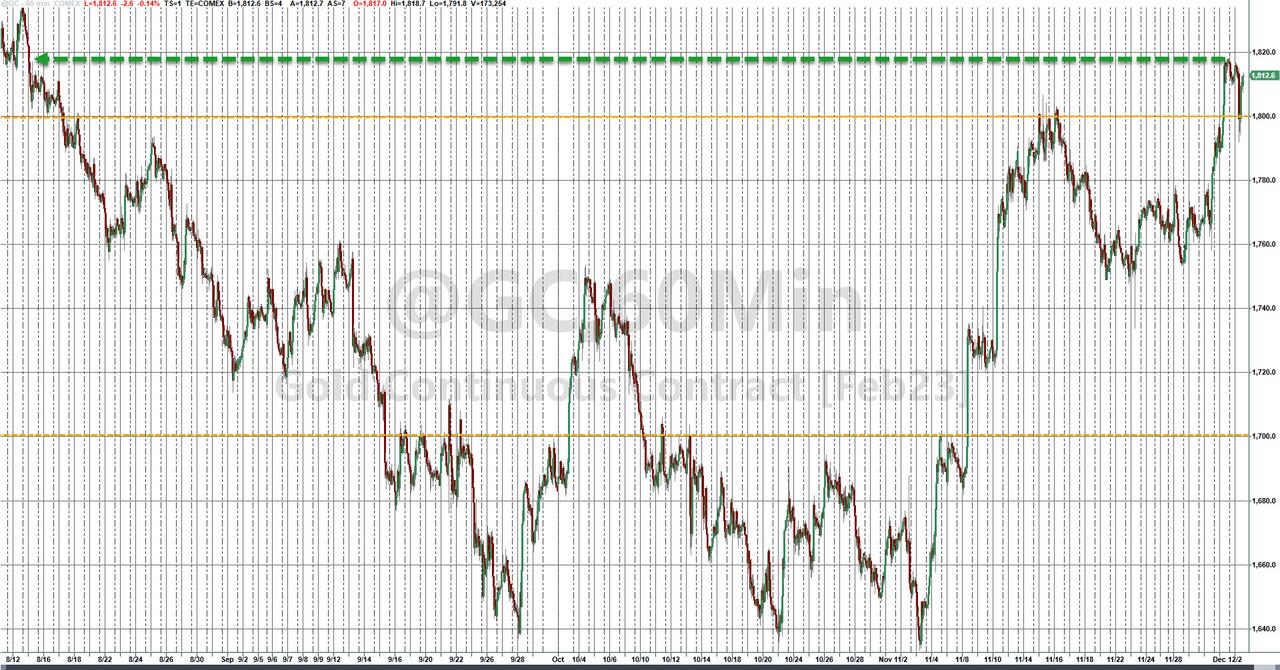
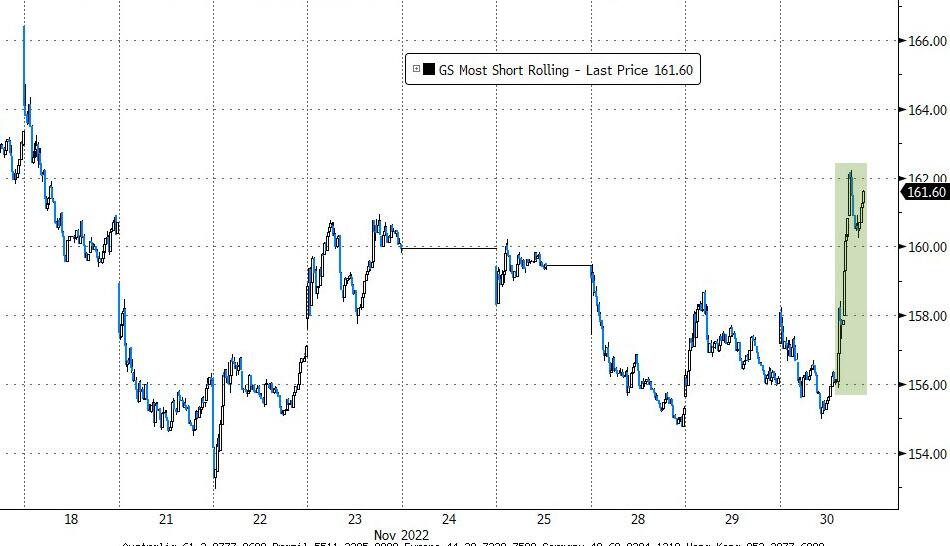
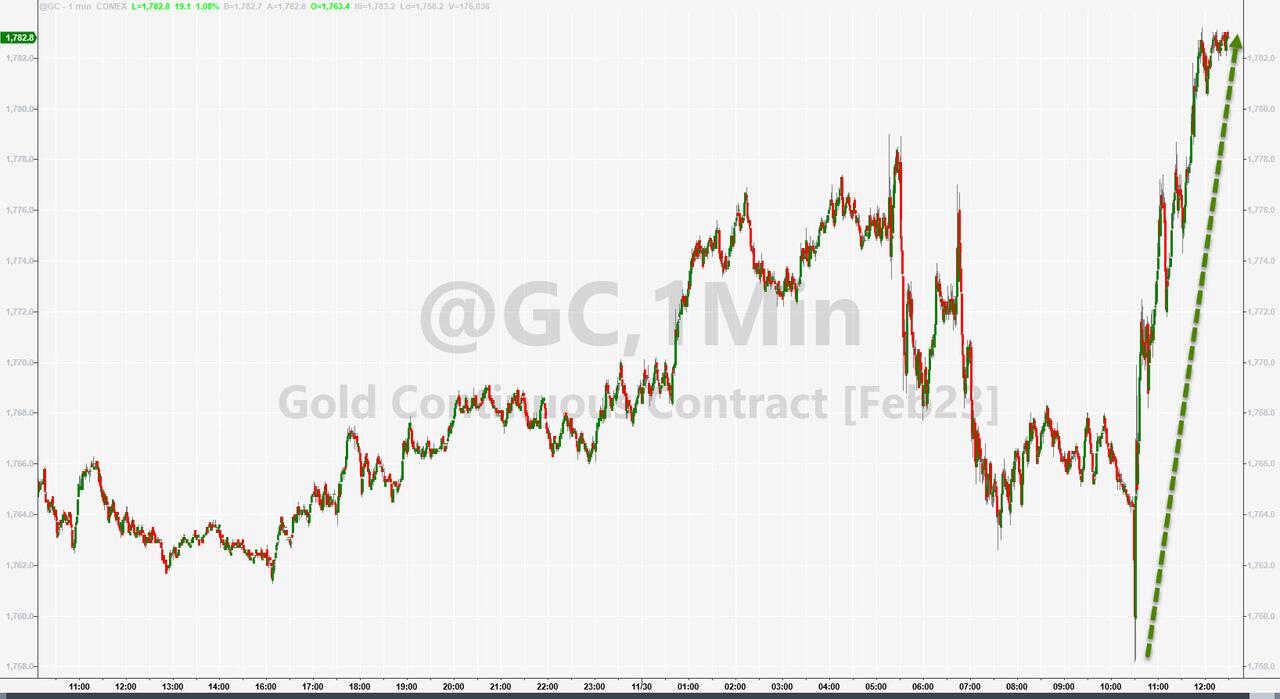
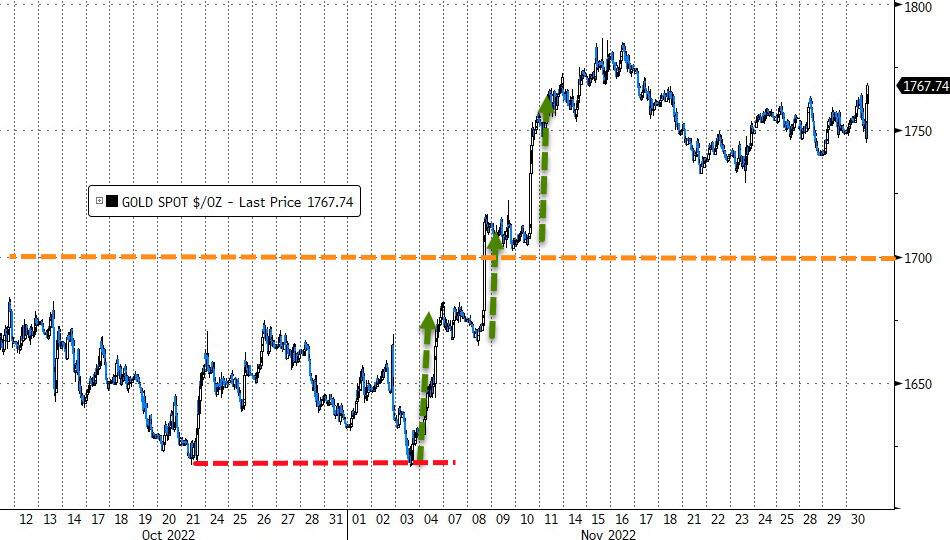
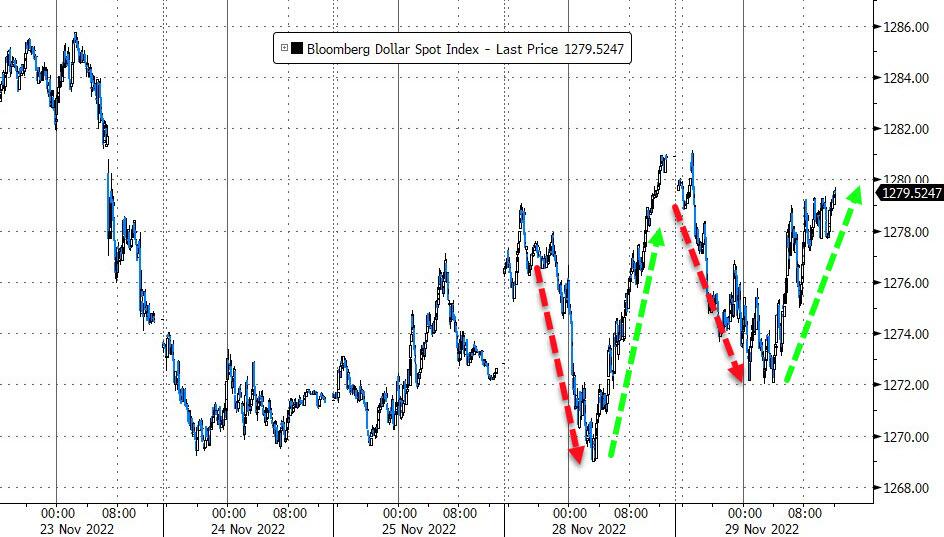
The stand-by and usually reliable bullish ammo failed today, because the most shorted stocks tanked as well, with no bailout squeeze attempt in sight. The US Dollar rebounded, and Gold dropped back below $1,800.

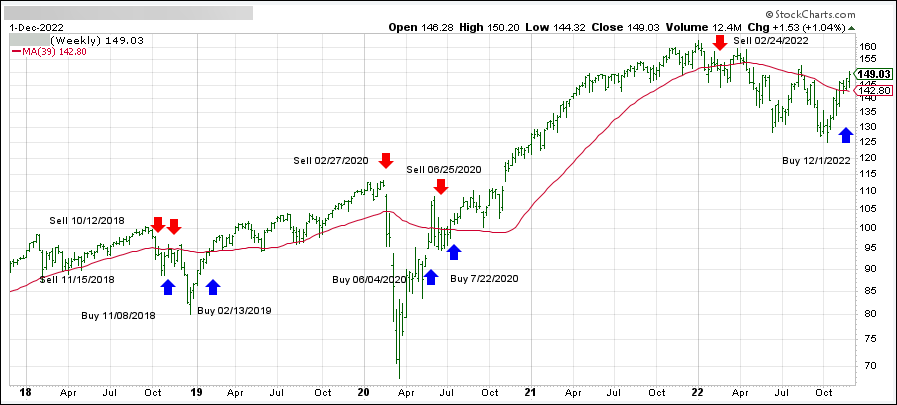
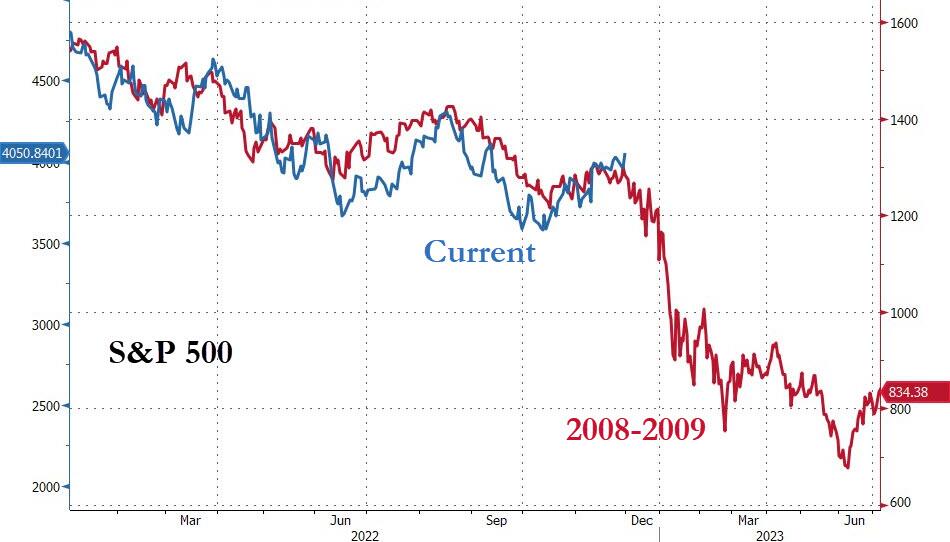
After a temporary bullish diversion, will the S&P 500 now sync up again with the 2008-2009 analog?

Read More

ETFs On The Cutline – Updated Through 12/02/2022

Ulli ETFs on the Cutline Contact

Below, please find the latest High-Volume ETF Cutline report, which shows how far above or below their respective long-term trend lines (39-week SMA) my currently tracked ETFs are positioned.

This report covers the HV ETF Master List from Thursday’s StatSheet and includes 312 High Volume ETFs, defined as those with an average daily volume of more than $5 million, of which currently 192 (last report: 107) are hovering in bullish territory. The yellow line separates those ETFs that are positioned above their trend line (%M/A) from those that have dropped below it.

Take a look:                                                                   

The HV ETF Master Cutline Report

In case you are not familiar with some of the terminology used in the reports, please read the Glossary of Terms. If you missed the original post about the Cutline approach, you can read it here.      

ETF Tracker Newsletter For December 2, 2022

Ulli ETF Tracker Contact

ETF Tracker StatSheet          

You can view the latest version here.

WHEN GOOD NEWS IS BAD NEWS—AGAIN

[Chart courtesy of MarketWatch.com]

  1. Moving the markets

All eyes were on the jobs report this morning when November payrolls unexpectedly surprised to the upside, as 263k new jobs were created, thereby handily beating expectations of a 200k print.

While that bodes well for a deteriorating economy, which has been ravaged by a multitude of negative econ reports—along with a host of companies announcing layoffs in the 10s of thousands—the markets were not happy and sold off sharply.

As I have repeatedly posted, good economic news is bad news for Wall Street, because it gives the Fed more ammunition to keep interest rates higher for longer in its battle to slay inflation, which is exactly the opposite of what traders and algos want to see, namely lower rates in support of the bullish thesis.

Traders managed to overcome the early drop, a slow climb through the remainder of the session cut down losses, and the major indexes recovered to end the day just about unchanged. Thanks to Tuesday’s Ramp-A-Thon, the three indexes gained for the week.

This was the final monthly employment report for 2022 and will likely form the basis for the next Fed decision on interest rates scheduled for Dec. 13-14, with a hike of “only” 50 bps to be expected.

Bond yields slipped again, with the 10-year closing at 3.5%. So did the Dollar, which has now dropped for the 6th week out of 7, dumping below its 200-day M/A and closing at its lowest since June.

Gold had a good week by recapturing its $1,800 level, its highest since August, as ZeroHedge reported.

We are now in the seasonally strong phase for equities and, barring any unforeseen circumstances, should see a continuation of this nascent Santa Claus rally.

Read More

Weekly StatSheet For The ETF Tracker Newsletter – Updated Through 12/01/2022

Ulli ETF StatSheet Contact

ETF Data updated through Thursday, December 1, 2022

Methodology/Use of this StatSheet:

1. From the universe of over 1,800 ETFs, I have selected only those with a trading volume of over $5 million per day (HV ETFs), so that liquidity and a small bid/ask spread are assured.

2. Trend Tracking Indexes (TTIs)

Buy or Sell decisions for Domestic and International ETFs (section 1 and 2), are made based on the respective TTI and its position either above or below its long-term M/A (Moving Average). A crossing of the trend line from below accompanied by some staying power above constitutes a “Buy” signal. Conversely, a clear break below the line constitutes a “Sell” signal. Additionally, I use a 12% trailing stop loss on all positions in these categories to control downside risk.

3. All other investment arenas do not have a TTI and should be traded based on the position of the individual ETF relative to its own respective trend line (%M/A). That’s why those signals are referred to as a “Selective Buy.” In other words, if an ETF crosses its own trendline to the upside, a “Buy” signal is generated. Here too, I recommend trailing sell stop of 12%, or less, depending on your risk tolerance.

If you are unfamiliar with some of the terminology, please see Glossary of Terms and new subscriber information in section 9.     

1. DOMESTIC EQUITY ETFs: BUY — since 12/01/2022

Click on chart to enlarge

Our main directional indicator, the Domestic Trend Tracking Index (TTI-green line in the above chart) has broken back above its long-term trend line (red) by a solid +4.31% and has generated a new “Buy” signal.  

Read More

Fed Satisfies Markets—New Buy Signals Generated

Ulli Market Commentary Contact

[Chart courtesy of MarketWatch.com]

  1. Moving the markets

A variety of events combined forces to pull the markets out of their doldrums, while not only creating a new “Buy” signal for our Trend Tracking Indexes (section 3) but also breaking the S&P 500’s glass ceiling, namely its 200-day M/A (+0.57%).

We also were re-acquainted with the fact that bad news is good news, as poor economic data releases were seen as putting pressure on the Fed regarding their hawkish interest rate policy.

As ZeroHedge pointed out, Job Openings fell by 353k, as hiring, quits tumbled to multi-year lows. US Pending Home Sales plunged to their biggest annual drop ever, and the Chicago PMI collapsed to Covid-lockdown lows.

But the big assist came from the Fed, when Powell presented his prepared remarks, while talking out of both sides of his mouth:

Dovish:

  • The time for moderating the pace of rate increases may come as soon as the December meeting.

Hawkish:

  • FED WILL NEED RESTRICTIVE POLICY FOR `SOME TIME’
  • RATE PEAK LIKELY `SOMEWHAT HIGHER’ THAN SEPT. FORECASTS
  • “Given our progress in tightening policy, the timing of that moderation is far less significant than the questions of how much further we will need to raise rates to control inflation, and the length of time it will be necessary to hold policy at a restrictive level.”
  • CONSIDERABLE UNCERTAINTY OVER WHERE RATES WILL PEAK
  • WILL REQUIRE SUSTAINED PERIOD OF SLOWER DEMAND GROWTH. It will take substantially more evidence to give comfort that inflation is actually declining. By any standard, inflation remains much too high.”
  • HISTORY CAUTIONS AGAINST PREMATURELY LOOSENING POLICY

There you have it. The caution that higher rates are here to stay far outweighed his lonely dovish comment. However, the latter was all the markets wanted to hear, and off to the races we went with the Dow scoring a 700-point gain, the S&P 500 storming ahead +3.09%, all of which now looks to be the beginning of the much hoped for Santa Claus rally.  

Once the bulls got the upper hand, it comes as no surprise that shorts were squeezed adding to the late session Ramp-A-Thon. Bond yields dropped sharply, the US Dollar got slammed, while gold was the beneficiary with the precious metal spiking +1.14% and having its best month since July 2020.

Back to the 2008-2009 analog. Have we now reached a point where 2022 will diverge and start a new bull market?

We will soon find out.

Read More

Going Nowhere

Ulli Market Commentary Contact

[Chart courtesy of MarketWatch.com]

  1. Moving the markets

While the major indexes wandered aimlessly throughout the session, they at least managed to dig themselves out of an early hole, crawled back and reduced their losses. In the end, not much was gained or lost.

Economic data points did nothing to encourage bullish sentiment with Consumer Confidence dropping in October, while Inflation Expectations jumped. US Home prices declined for the 3rd straight month in September, as ZeroHedge reported, clearly a consequence of soaring mortgage rates.

All eyes are now on Fed head Powell’s speech tomorrow when observers will be hunting for clues whether the central bank might pause or even stop interest rate hikes. It appears that this kind of hopeful thinking, despite Powell & Co having clearly and repeatedly announced that they are nowhere near the Fed’s expected termination rate—now at 5-7%.

CNBC called the next 10 to 14 days a “data-rich period”, which may help clarify if inflation and economic growth can be balanced and, I suppose, co-exist. This Friday’s labor report and next week’s PPI number will add important context to see if this bear market bounce can be extended or not.

Bond yields rose a tad, with the widely followed 10-year bouncing off of yesterday’s lows. The US Dollar rode the roller-coaster again and slipped from yesterday’s close, thereby helping Gold to score some gains for the session.

Looking at the big picture, it appears that Central Banks all over the world are continuing to be in more of a tightening mood to battle the inflation monster, which has adversely affected consumer prices around the globe.

Read More