
- Moving the markets
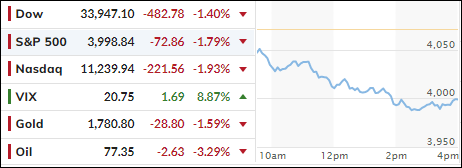
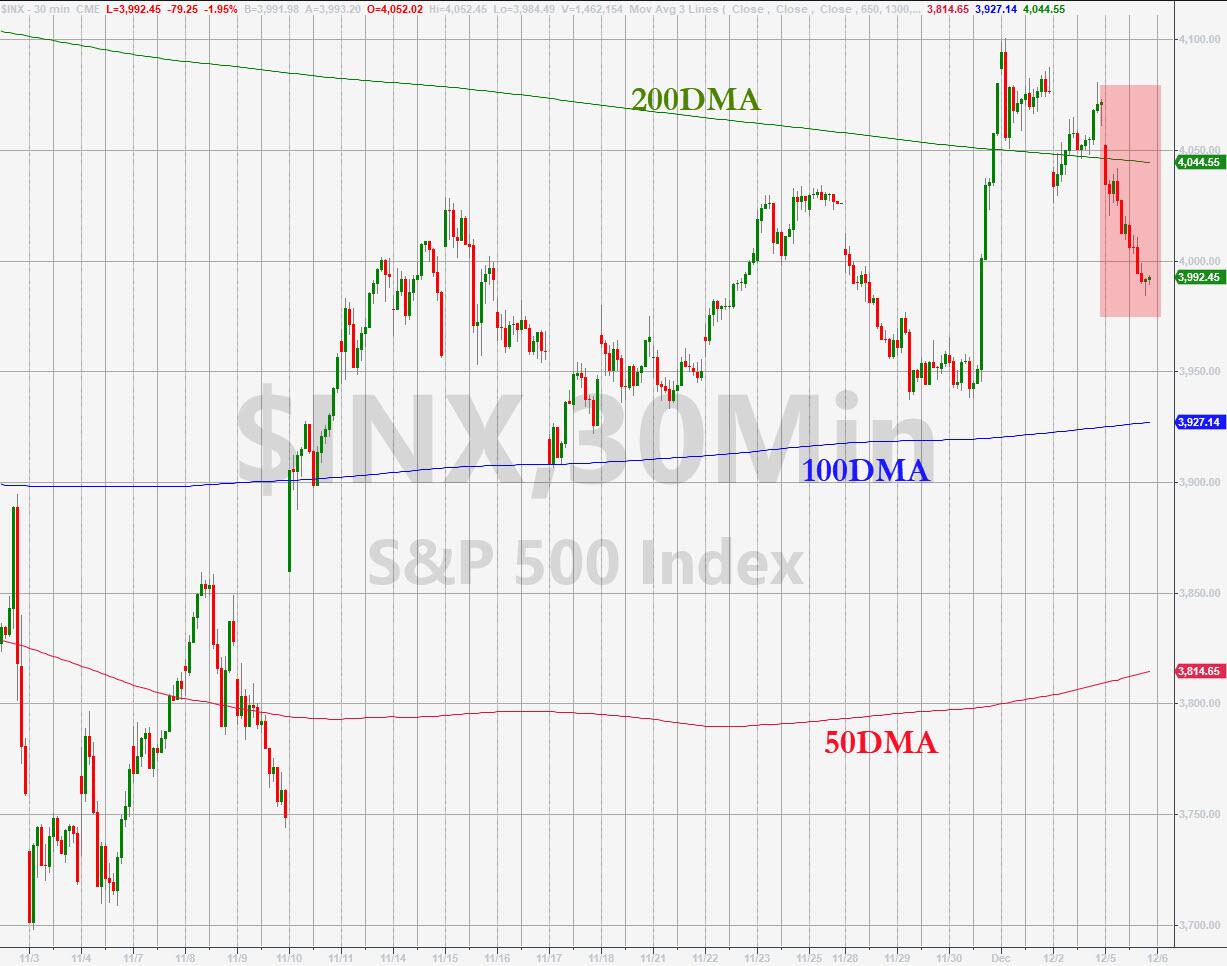
After last week’s rebound, that resulted in the S&P 500 finally breaking through its 200-day M/A, which has served as a glass ceiling since April, none of that feel good bullish sentiment was present today.
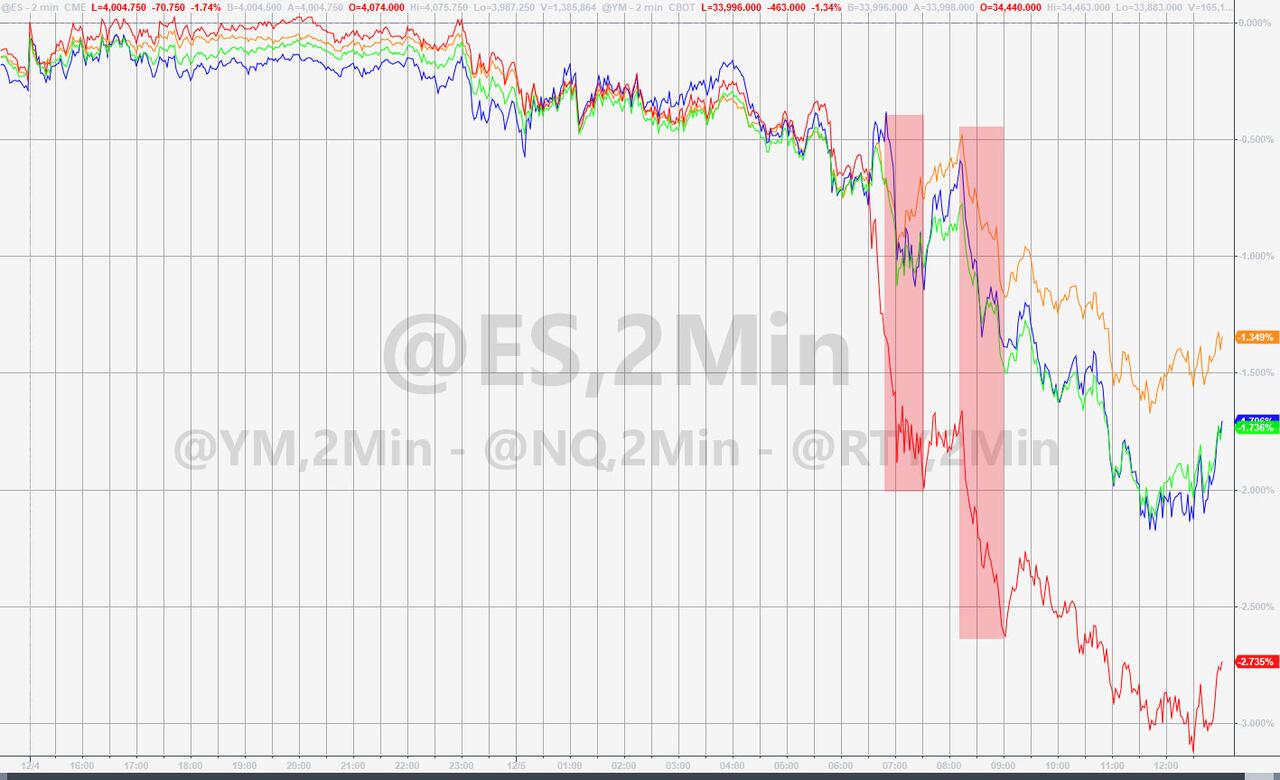
From the opening bell, the major indexes headed south caused by sudden fears that the Fed may not only not pivot but continue its hawkish policies, even as the economy slides further into recession territory.
That took the starch out of any remaining bullish momentum, as the broad market tumbled, including heavyweights like Tesla, Microsoft, and Amazon, with the retreat being broad based and leaving no place to hide.
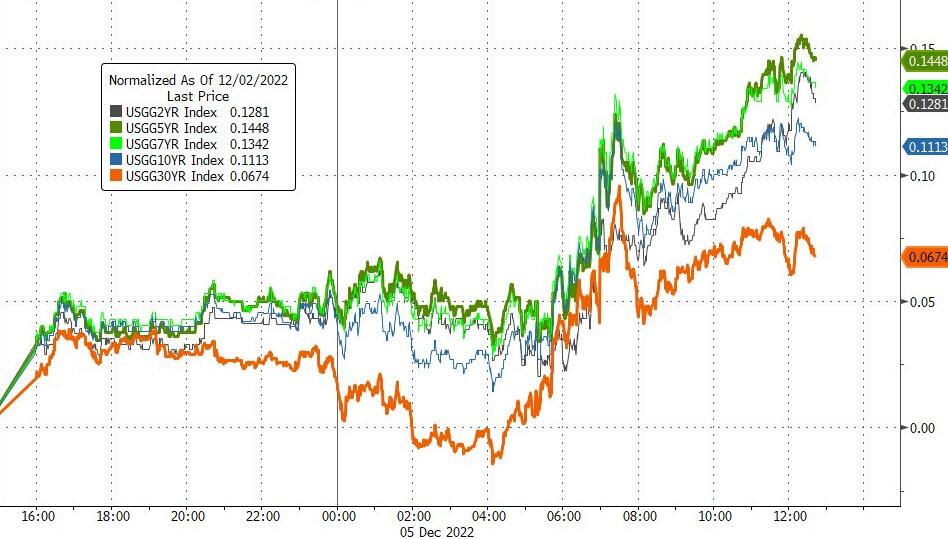
Rising bond yields supported the equity bears, with the 10-year gaining 7 bps to close at 3.6%. The S&P “lost” its 200-day M/A again, which it had just reclaimed, bringing up the question whether conquering this resistance level was simply a head fake.
Fed whisperer Nick Timiraos appeared to walk back some of the market’s post-Powell exuberance, as ZeroHedge called it, in this morning’s WSJ article, as the “higher rates for longer” narrative was pushed, which caused terminal Fed rate expectations to surge.
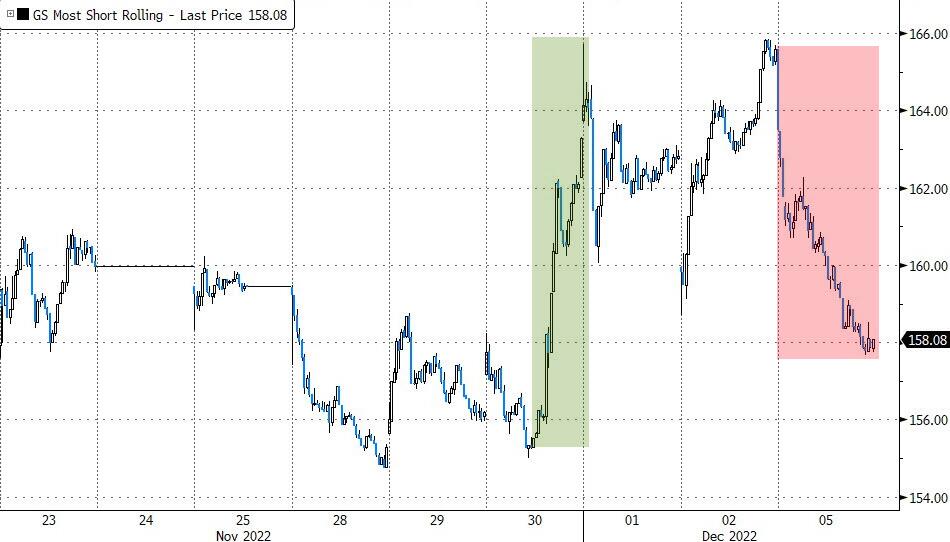
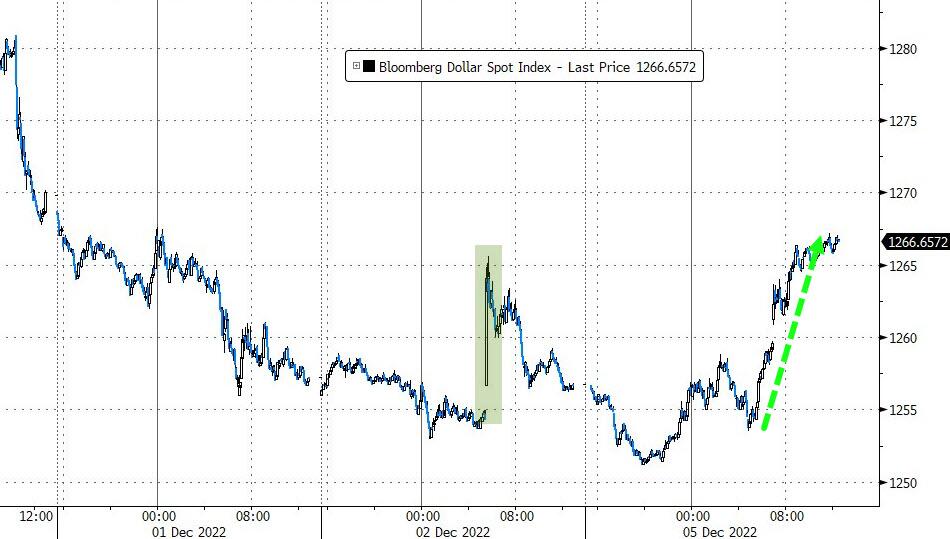
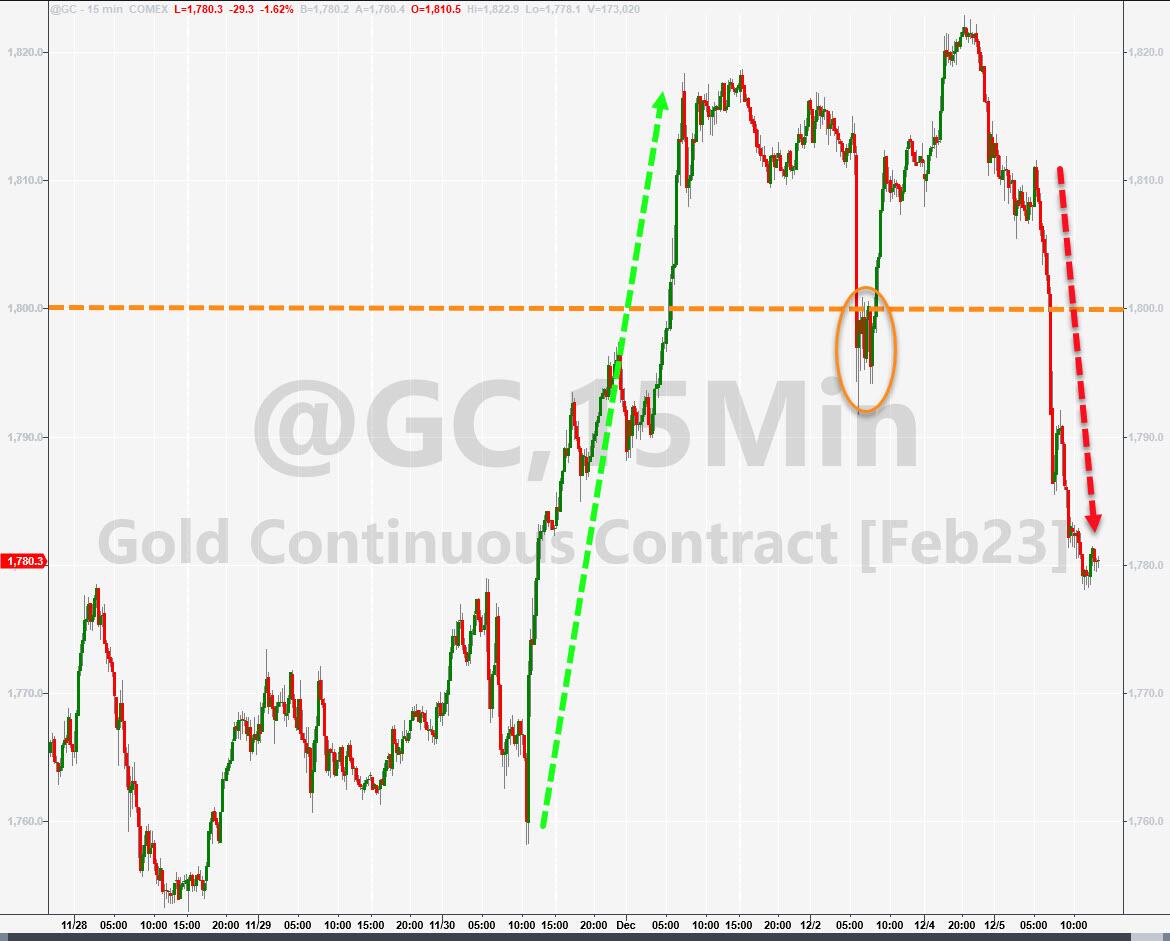
The stand-by and usually reliable bullish ammo failed today, because the most shorted stocks tanked as well, with no bailout squeeze attempt in sight. The US Dollar rebounded, and Gold dropped back below $1,800.
After a temporary bullish diversion, will the S&P 500 now sync up again with the 2008-2009 analog?
2. “Buy” Cycle Suggestions
For the current Buy cycle, which starts on 12/1/2022, I suggest you reference my most recent StatSheet for ETFs selections. If you come on board later, you may want to look at the most current version, which is published and posted every Thursday at 6:30 pm PST.
I also recommend for you to consider your risk tolerance when making your selections by dropping down more towards the middle of the M-Index rankings, should you tend to be more risk adverse. Likewise, a partial initial exposure to the markets, say 33% to start with, will reduce your risk in case of a sudden directional turnaround.
We are living in times of great uncertainty, with economic fundamentals steadily deteriorating, which will eventually affect earnings negatively and, by association, stock prices. I can see this current Buy signal to be short lived, say to the end of the year, and would not be surprised if it ends at some point in January.
In my advisor practice, we are therefore looking for limited exposure in value, some growth and dividend ETFs. Of course, gold has been a core holding for a long time.
With all investments, I recommend the use of a trailing sell stop in the range of 8-12% to limit your downside risk.
3. Trend Tracking Indexes (TTIs)
Our TTIs reversed and dropped but remained above their respective trend lines. Only time will tell if this current Buy cycle has legs or will turn out to be short-lived.
This is how we closed 12/05/2022:
Domestic TTI: +2.28% above its M/A (prior close +4.30%)—Buy signal effective 12/1/2022.
International TTI: +2.62% above its M/A (prior close +3.79%)—Buy signal effective
12/1/2022.
Disclosure: I am obliged to inform you that I, as well as my advisory clients, own some of the ETFs listed in the above table. Furthermore, they do not represent a specific investment recommendation for you, they merely show which ETFs from the universe I track are falling within the specified guidelines.
All linked charts above are courtesy of Bloomberg via ZeroHedge.
Contact Ulli