
- Moving the market
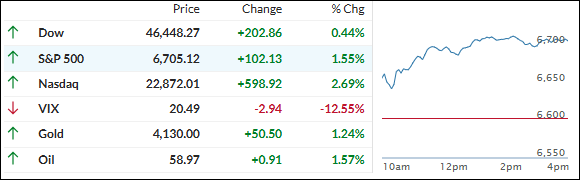
The markets came in determined to bounce into Thanksgiving week, and the bulls actually delivered.
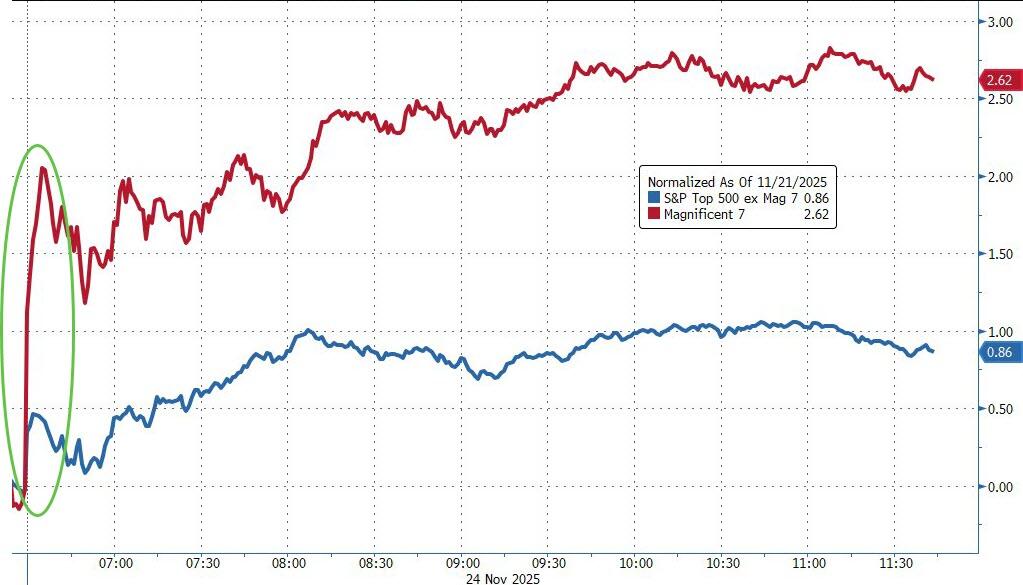
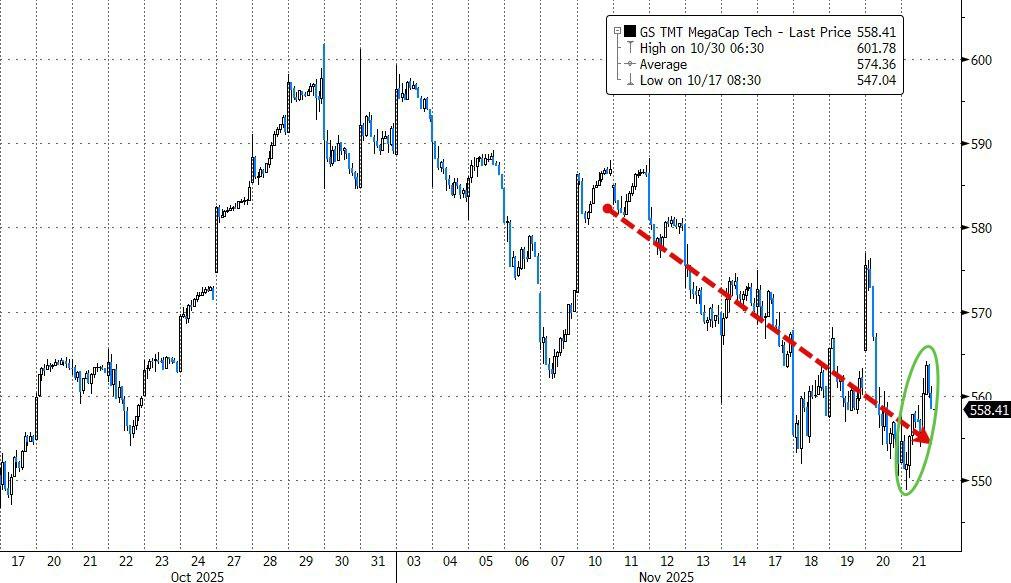
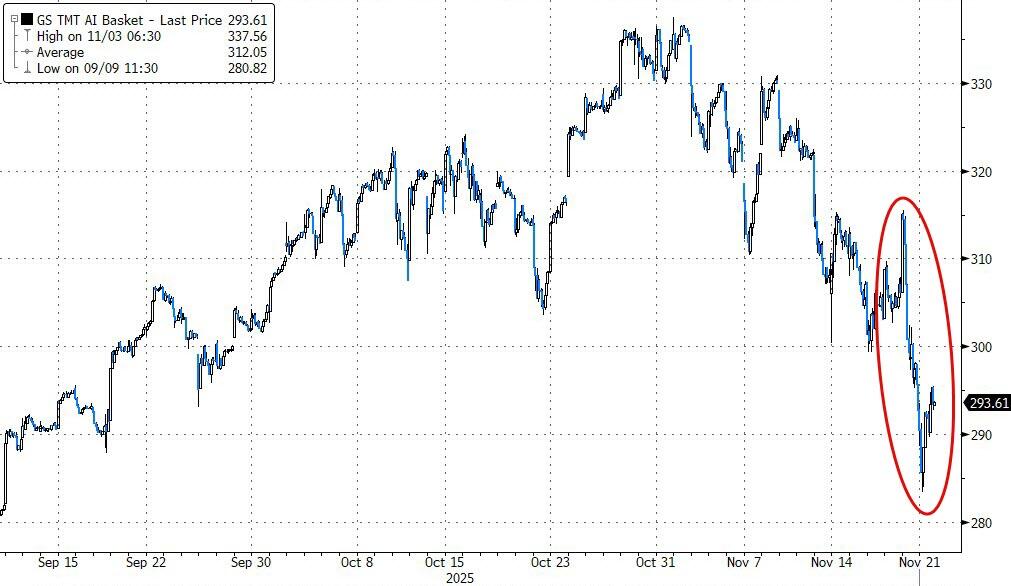
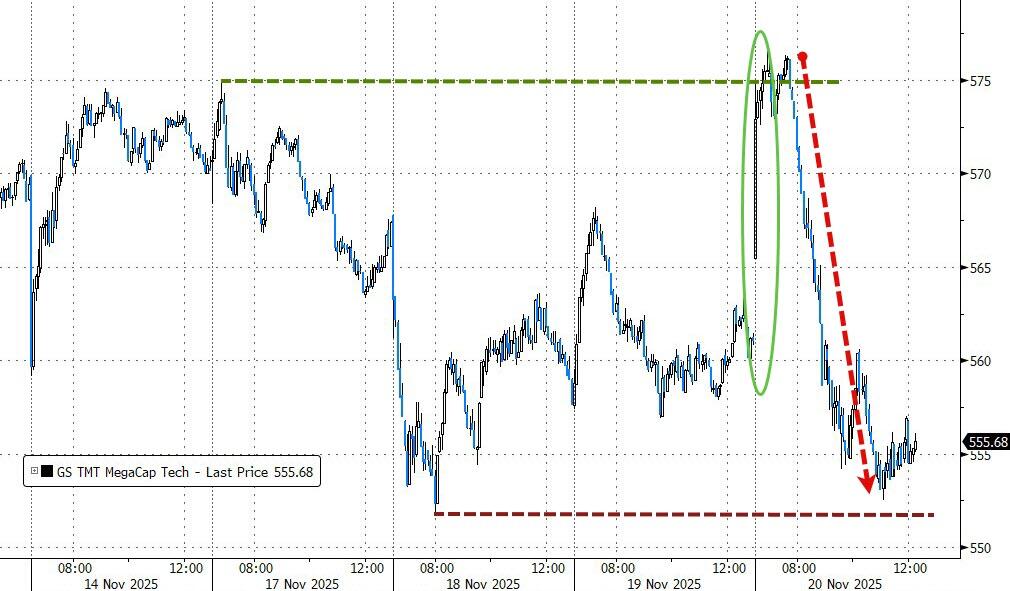
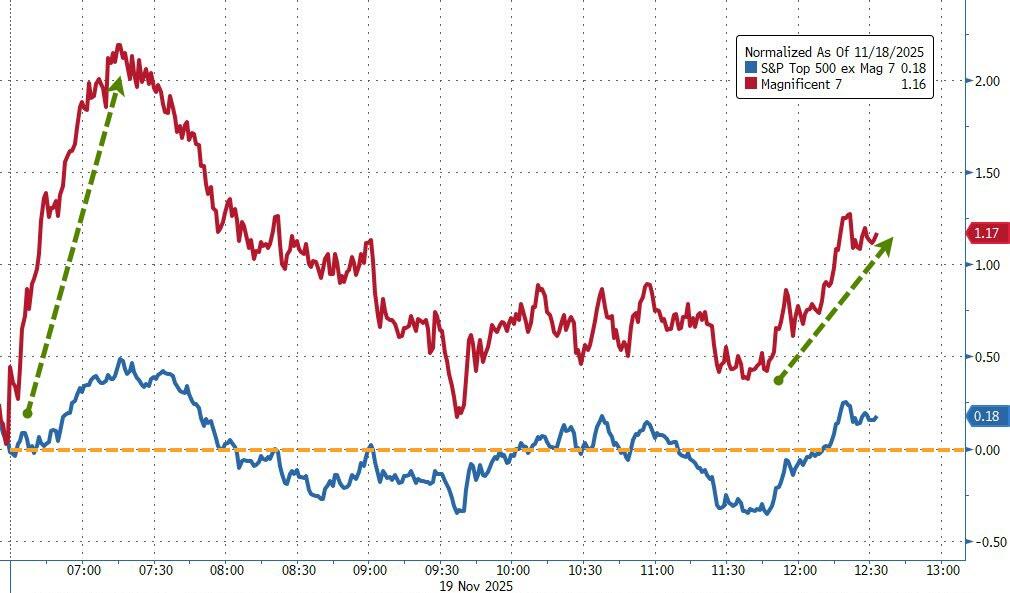
We opened strong and never really looked back—nice, steady grind higher all day. Alphabet was the star of the show, jumping 5% after Google dropped word of “Gemini 3” last week (their latest “we’re still in the AI race” flex).
That lit a fire under the whole mega-cap crew, and they dramatically outran the other 493 names in the S&P 500 by a mile.
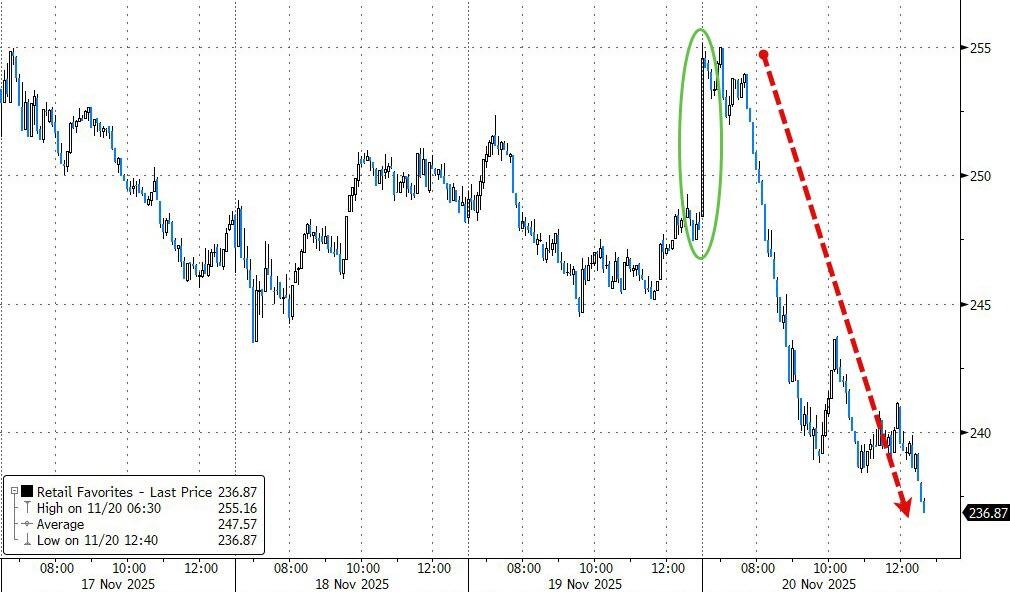
The major indexes are trying to claw back some dignity after a rough November—S&P down 2%+ so far this month, Nasdaq off over 4%, Dow also bleeding.
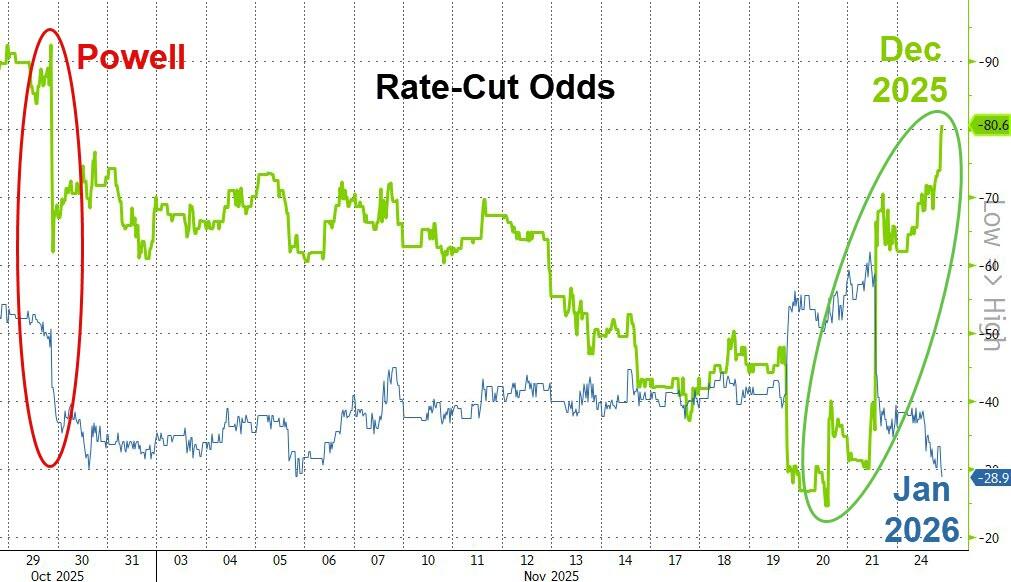
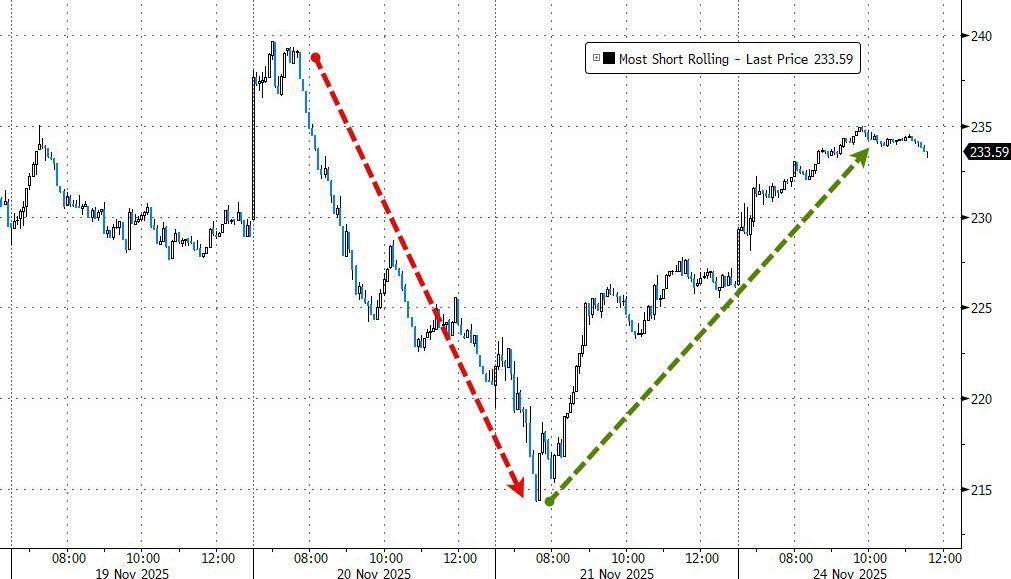
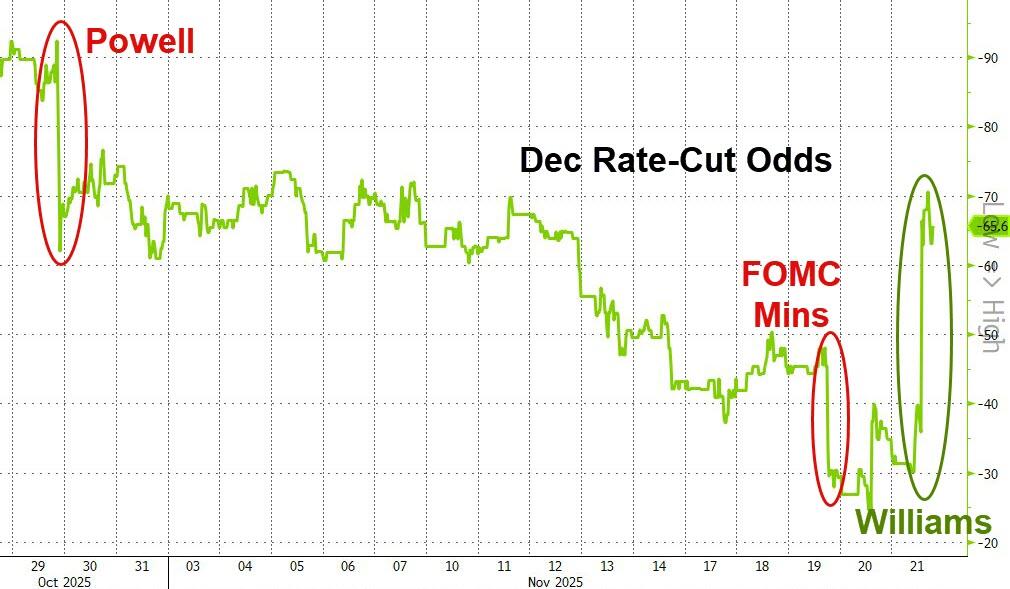
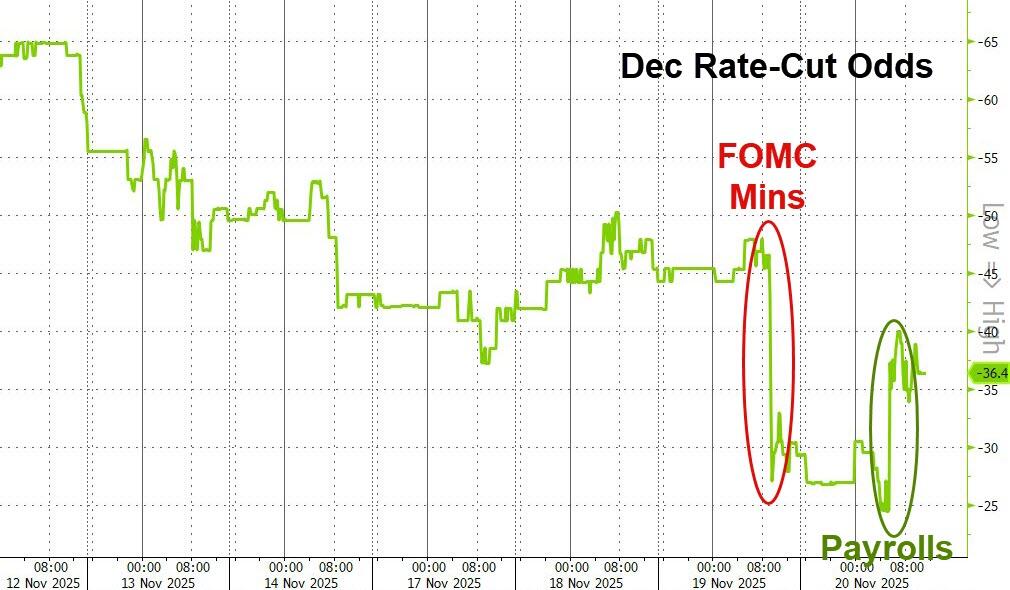
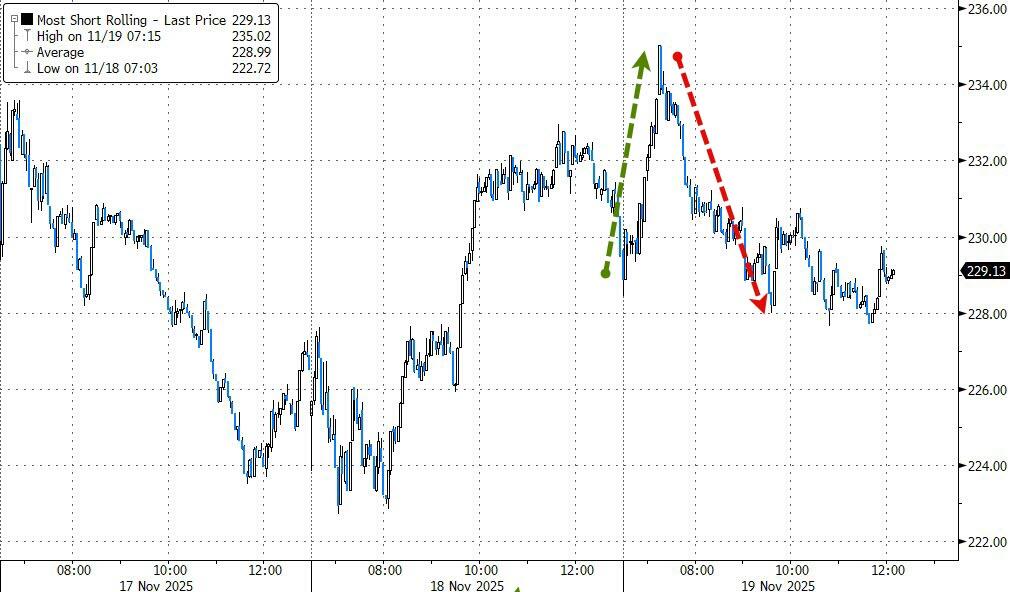
But Friday’s rebound, sharply rising December rate-cut odds and a juicy short squeeze gave us the fuel to stay green today.
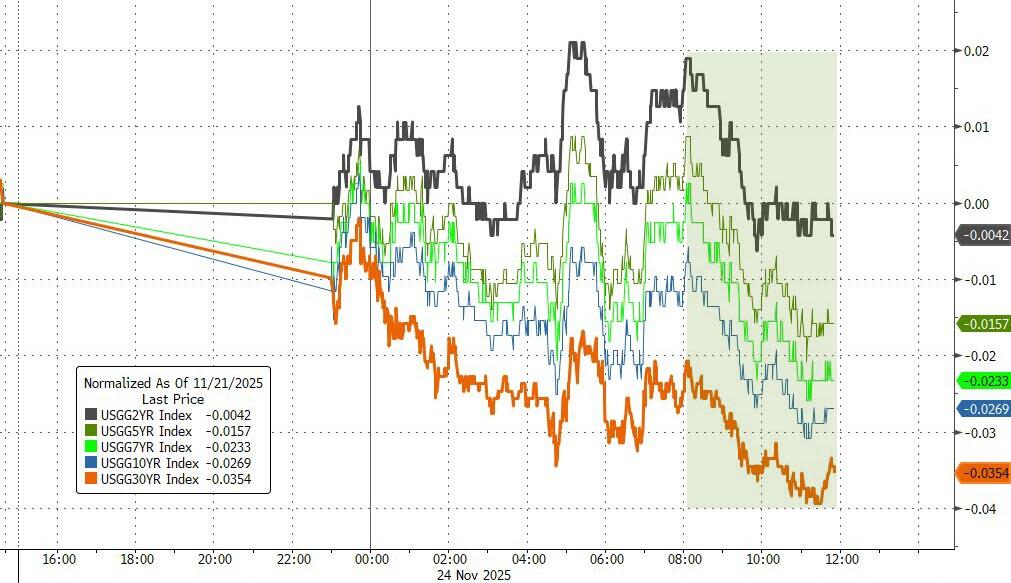
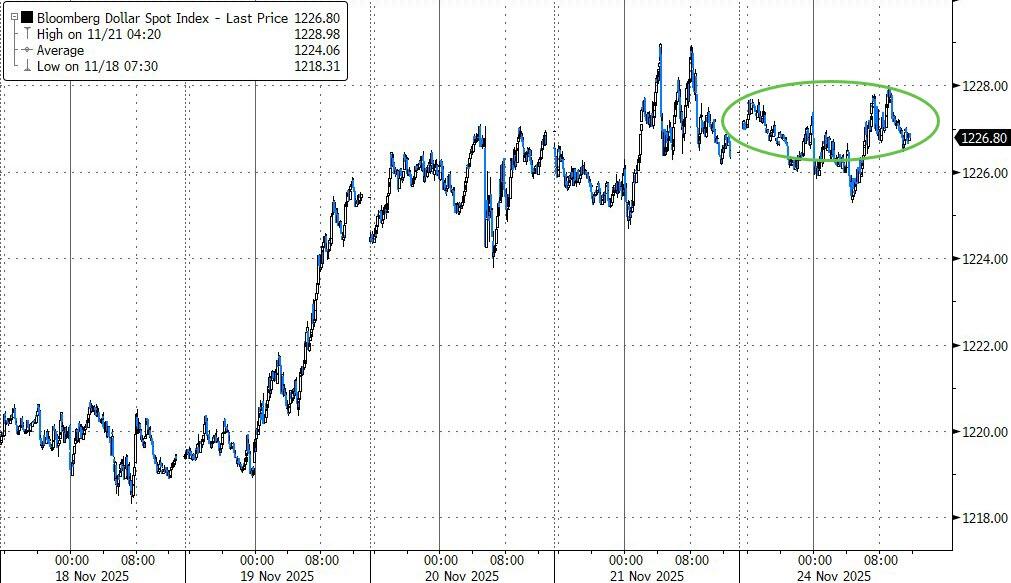
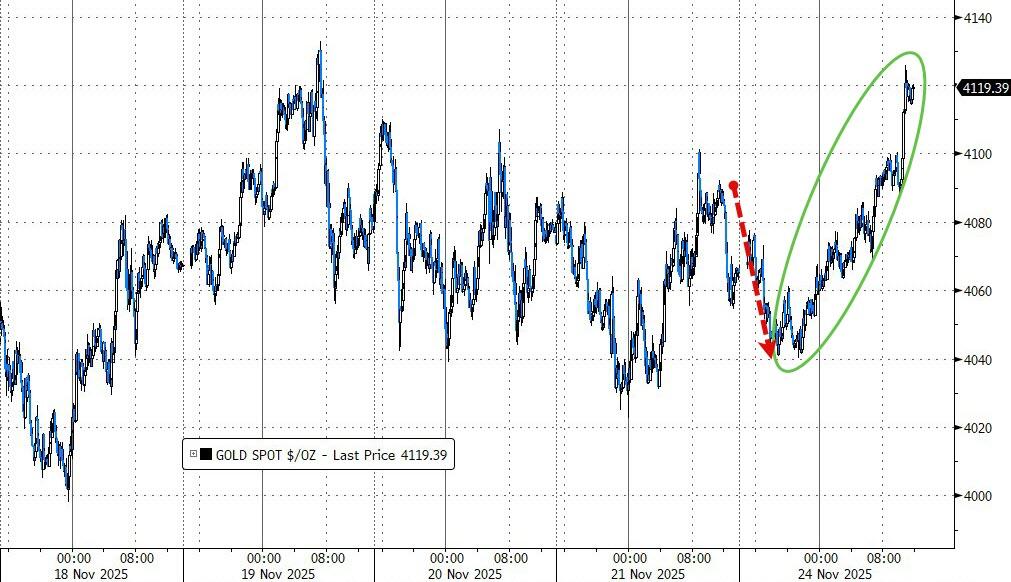
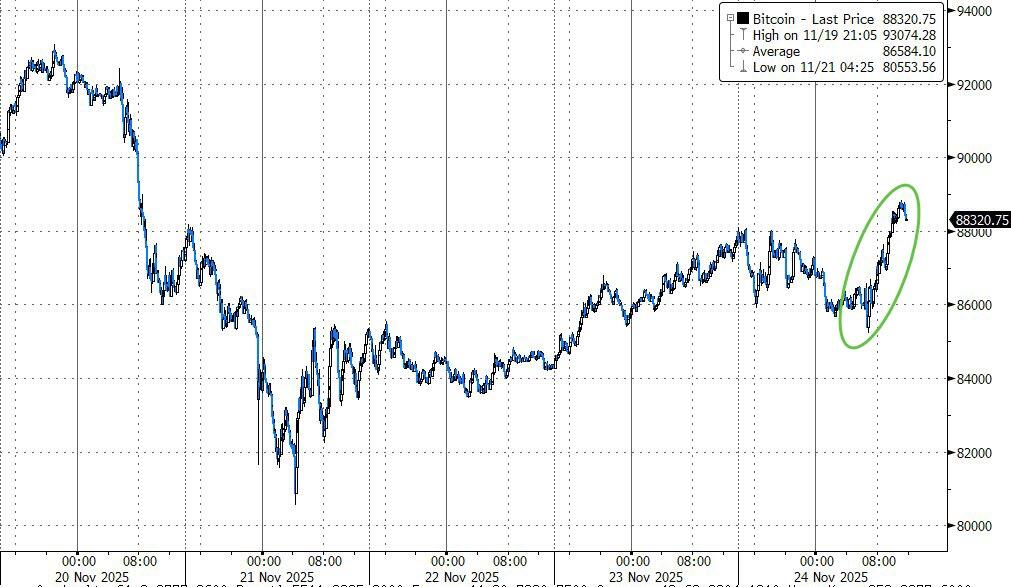
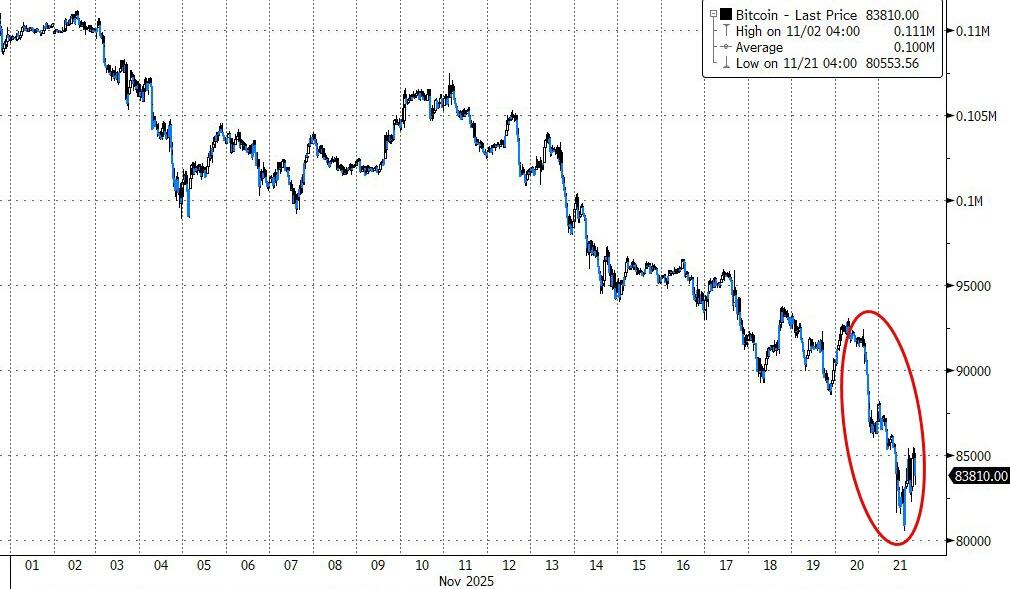
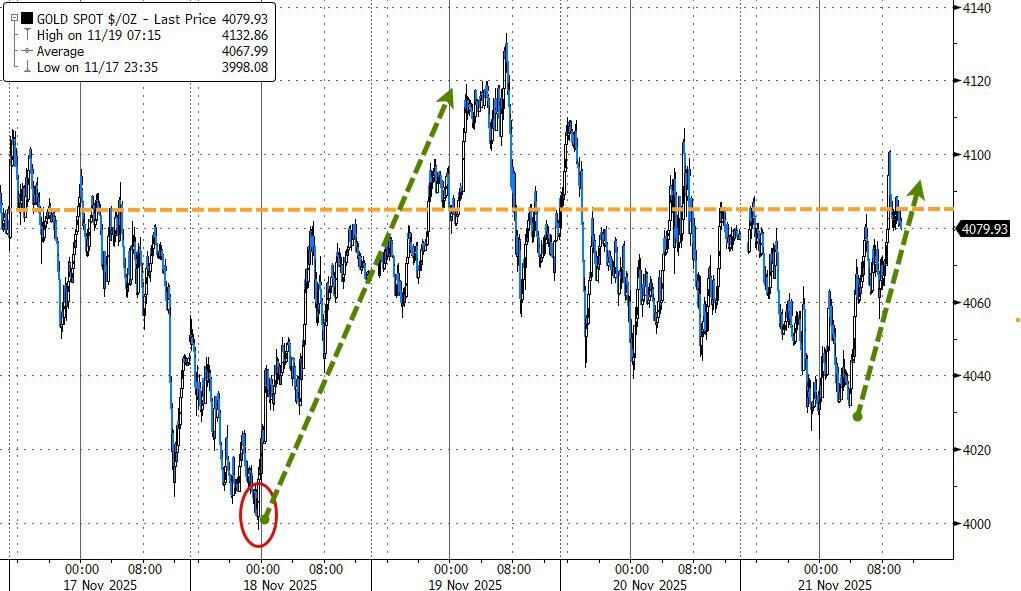
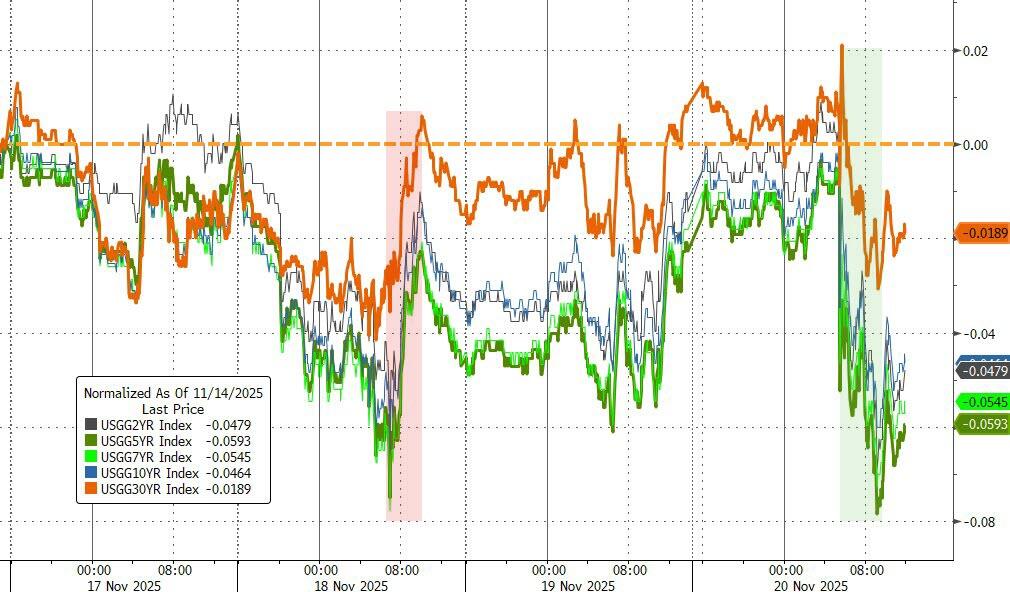
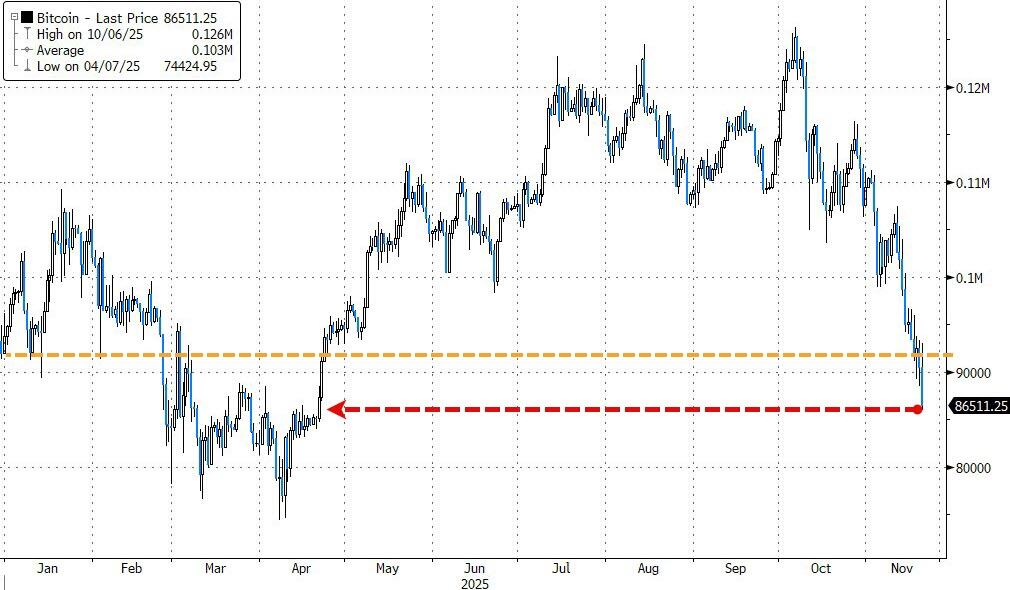
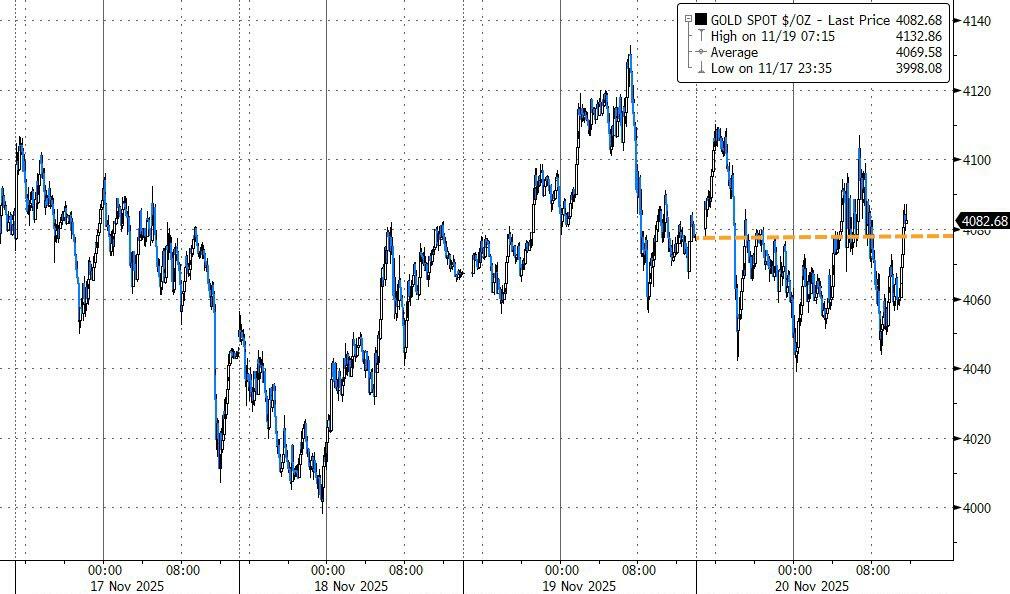
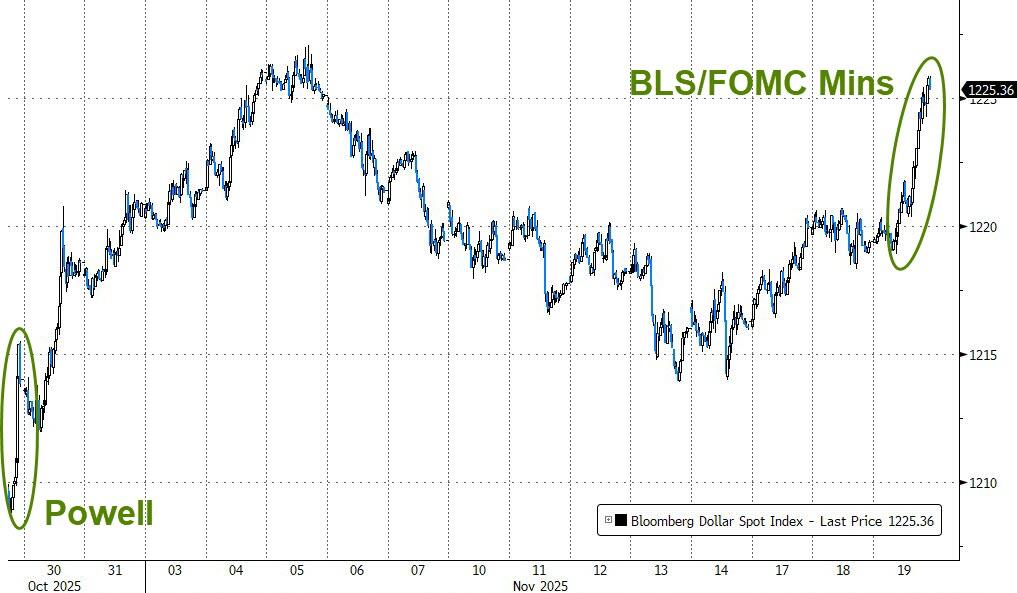
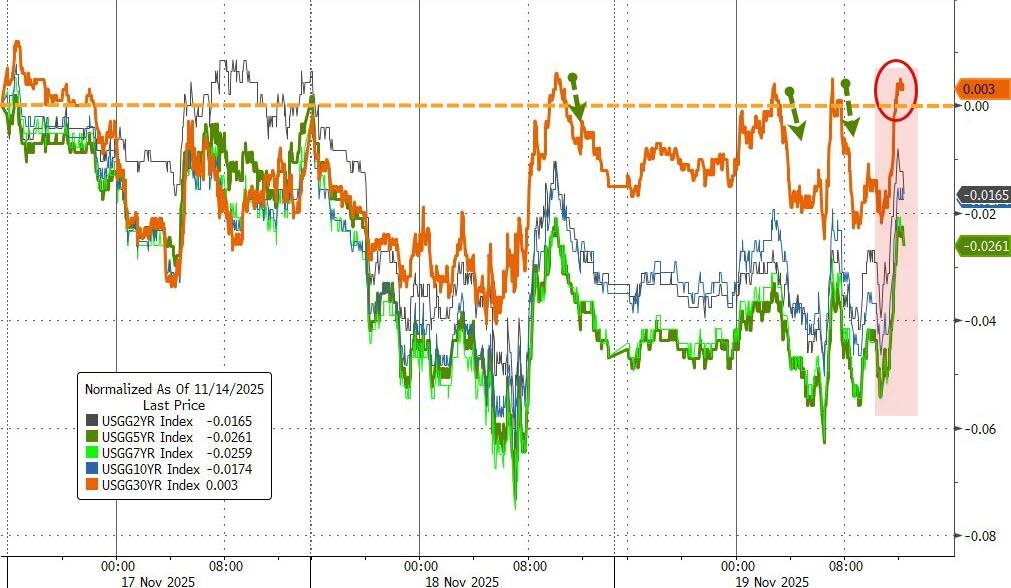
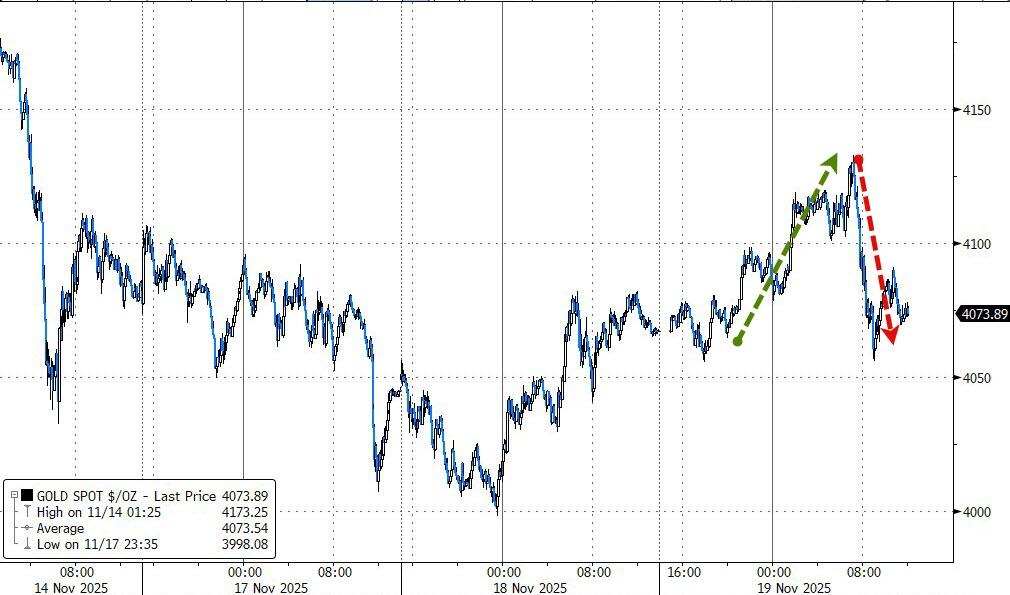
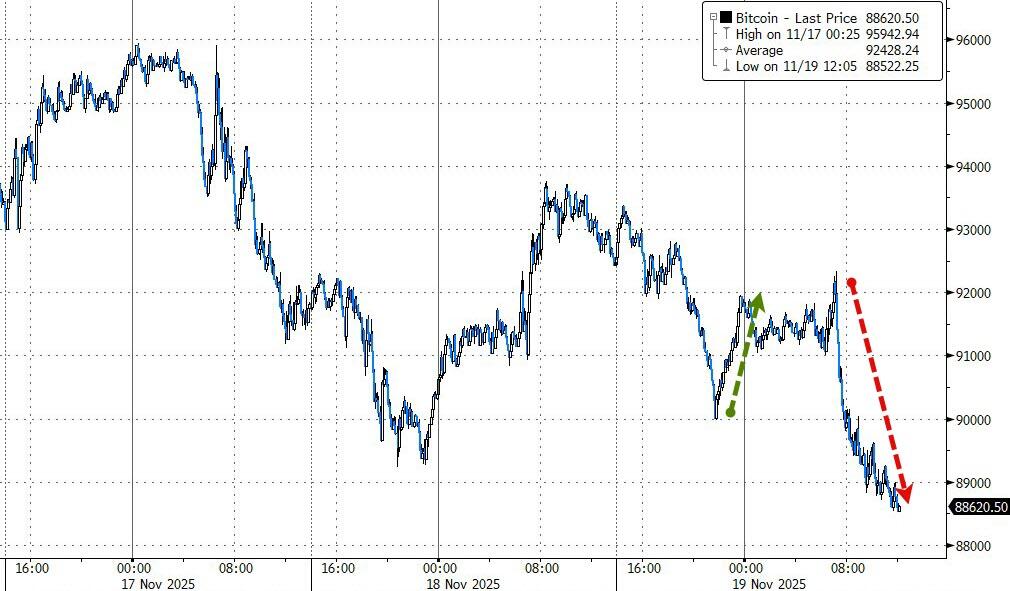
Bond yields slipped, the dollar just chilled, and the precious metals went nuts: gold surged 1.5%+ back above $4,100, silver ripped 2.9% past $51. Even bitcoin shook off the morning wobble, climbed over the weekend, and settled around $88K.
Volumes will get thin fast this week with everyone heading into turkey-coma mode, and there’s not much on the calendar until the Fed meeting in December… so expect some random air pockets.
Still, for now the vibe feels a lot better than it did a week ago.
Read More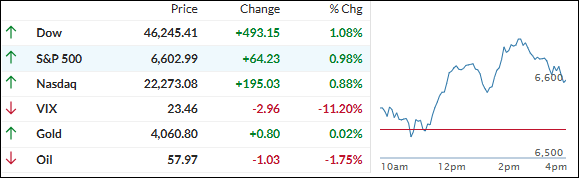

