
ETF Tracker StatSheet
You can view the latest version here.
STOCKS AND BANK RESERVES DIVERGE: A CROCODILE TRAP?
- Moving the markets
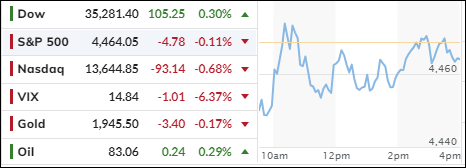
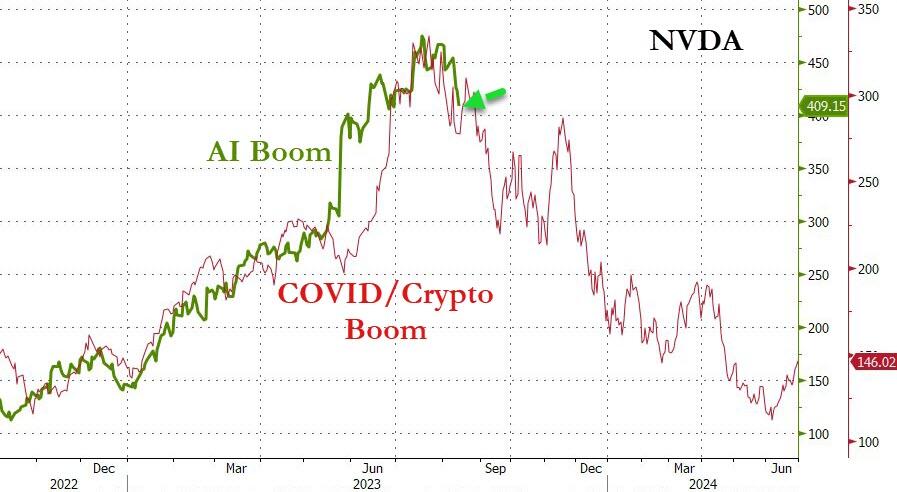
The stock market was stuck in a rut today, as the Nasdaq and S&P 500 closed slightly lower after some ups and downs. The Nasdaq has been on a losing streak for two weeks in a row, the first time since December, as investors got nervous about the AI bubble bursting.
The Dow managed to end the week higher, but the S&P 500 and the Small Caps joined the tech giants in the red. Traders were on their toes as they faced mixed signals from corporate earnings and inflation data.
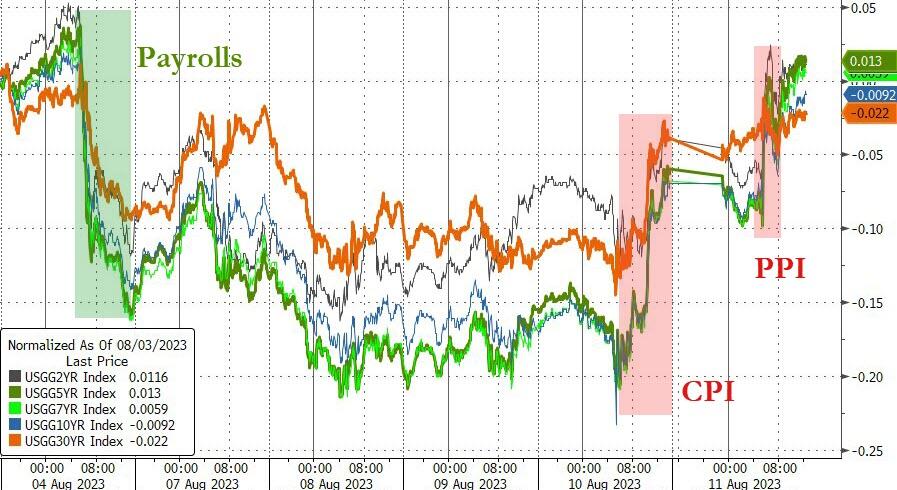
Yesterday’s CPI report was a grab bag of surprises, which initially boosted the market, but later fizzled out as the gains were erased. Today’s PPI report added more confusion, as wholesale prices rose 0.3% from last month, beating the expected 0.2% increase.
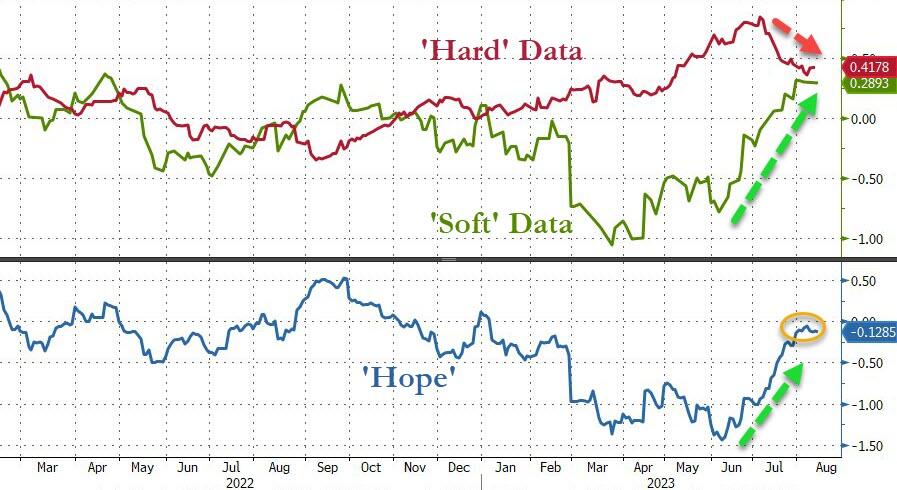
This week’s wobbly moves are part of a recent rough patch for the stock market, which had a strong performance in the first half of the year. The three major indexes are all below where they started August, as disappointing hard data and optimistic soft data clashed.
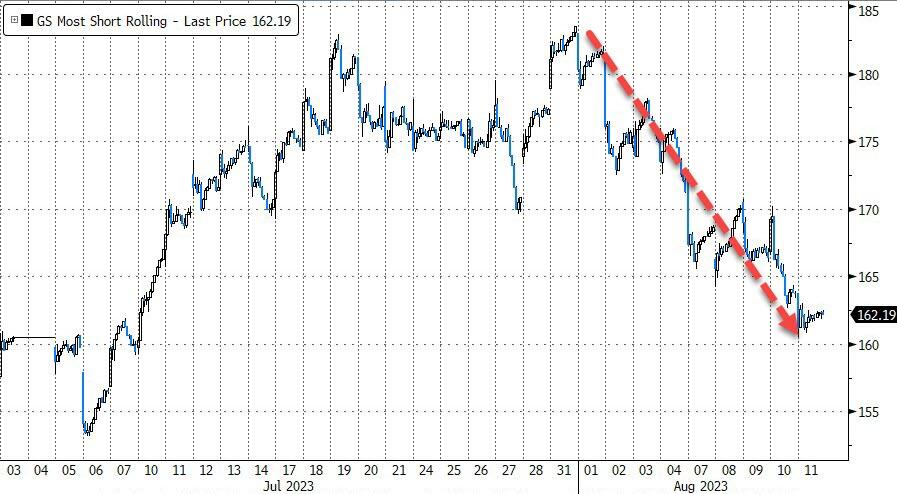
The most shorted stocks took a dive for the second week in a row, as all attempts to squeeze them were met with resistance. The most-shorted basket has been down for eight out of the last nine days.
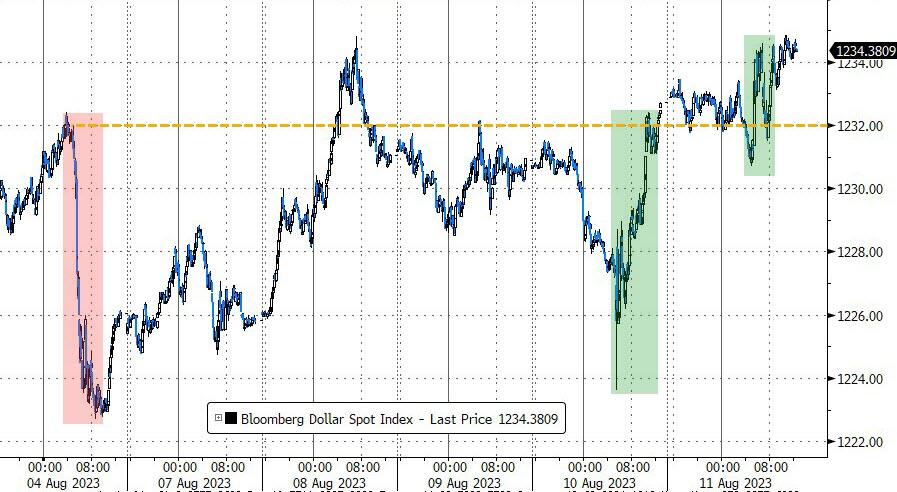
Bond yields swung wildly and ended up where they began last Friday. The dollar gained strength, which kept gold from shining.
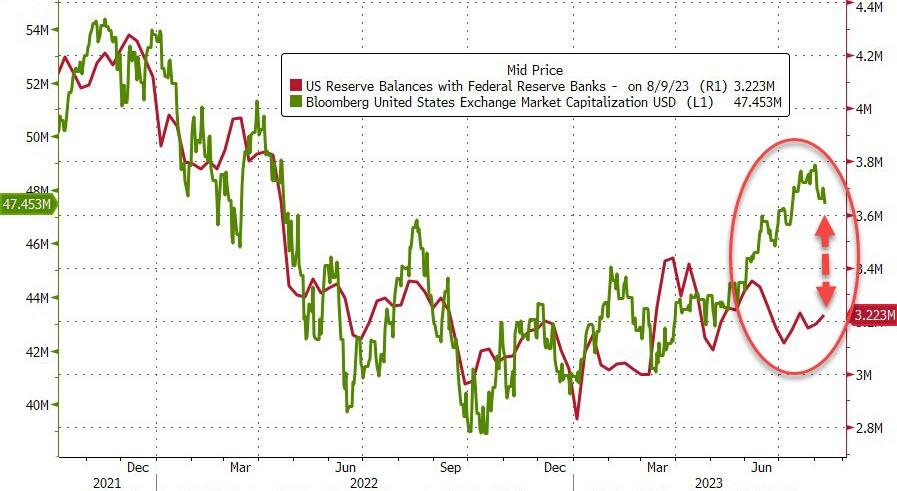
Another divergence emerged as stocks went their own way compared to bank reserves, as this chart shows. It makes me wonder when the jaws of this crocodile will snap.
- “Buy” Cycle Suggestions
The current Buy cycle began on 12/1/2022, and I gave you some ETF tips based on my StatSheet back then. But if you joined me later, you might want to check out the latest StatSheet, which I update and post every Thursday at 6:30 pm PST.
You should also think about how much risk you can handle when picking your ETFs. If you are more cautious, you might want to go for the ones in the middle of the M-Index rankings. And if you don’t want to go all in, you can start with a 33% exposure and see how it goes.
We are in a crazy time, with the economy going downhill and some earnings taking a hit. That will eventually drag down stock prices too. So, in my advisor’s practice, we are looking for some value, growth and dividend ETFs that can weather the storm. And of course, gold is always a good friend.
Whatever you invest in, don’t forget to use a trailing sell stop of 8-12% to protect yourself from big losses.
- Trend Tracking Indexes (TTIs)
The stock market wandered aimlessly today, as two of the three major indexes ended lower amid mixed signals. Traders stayed on the sidelines as they faced uncertain news.
Our TTIs also declined slightly, but they stayed within their bullish zones.
This is how we closed 08/11/2023:
Domestic TTI: +4.07% above its M/A (prior close +4.30%)—Buy signal effective 12/1/2022.
International TTI: +5.54% above its M/A (prior close +5.92%)—Buy signal effective 12/1/2022.
All linked charts above are courtesy of Bloomberg via ZeroHedge.
———————————————————-
WOULD YOU LIKE TO HAVE YOUR INVESTMENTS PROFESSIONALLY MANAGED?
Do you have the time to follow our investment plans yourself? If you are a busy professional who would like to have his portfolio managed using our methodology, please contact me directly to get more details.
Contact Ulli