
- Moving the markets
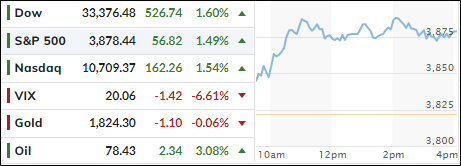
Upbeat earnings and robust consumer confidence data combined forces to pull the markets out of their doldrums and gave traders an excuse to push equities higher. Nike started things out by beating quarterly earnings and revenue expectations, as did FedEx with the company also announcing cost cutting plans.
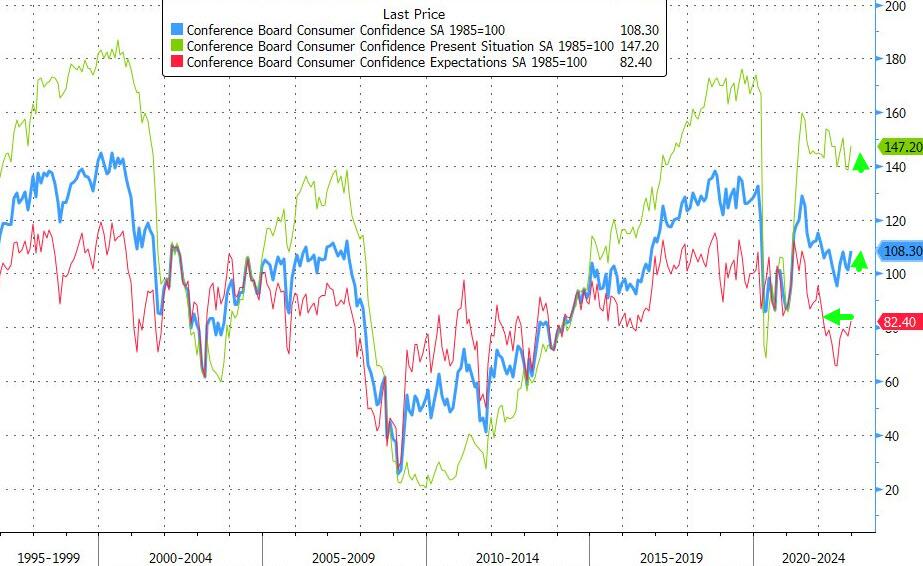
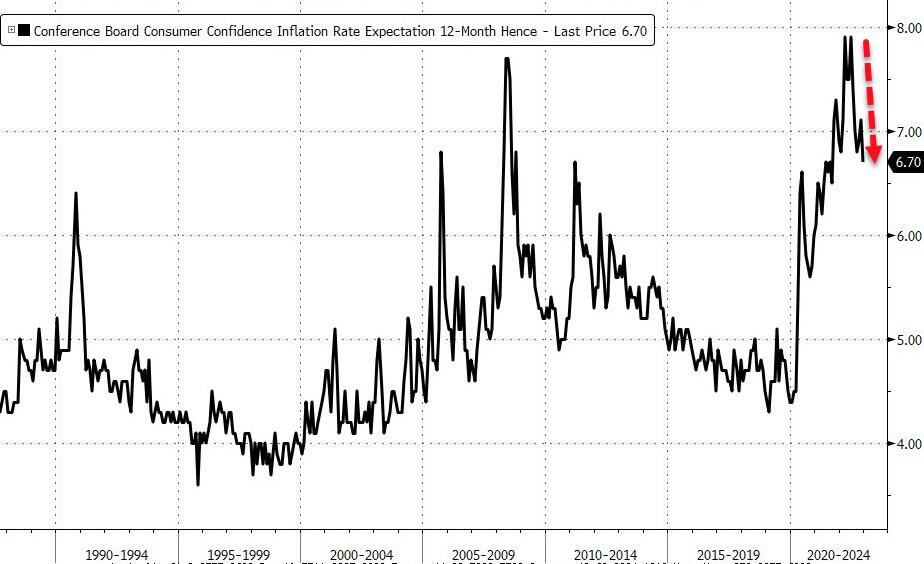
Consumer Confidence surged in December (to 108.3 vs. 101 expected), as ZeroHedge posted, while inflation expectations tumbled to its lowest since August 2021. That put the bulls back in charge with nothing being able to stop today’s Ramp-A-Thon.
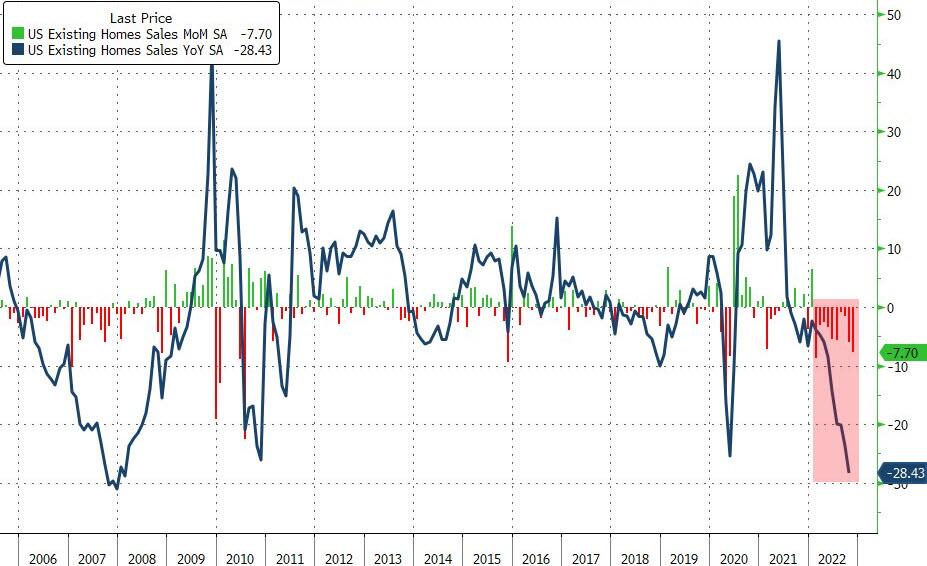
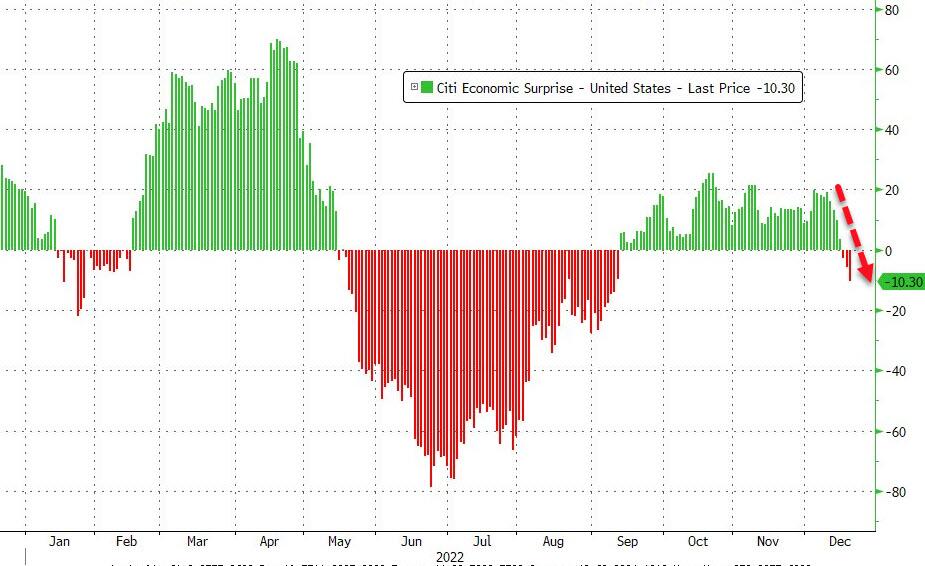
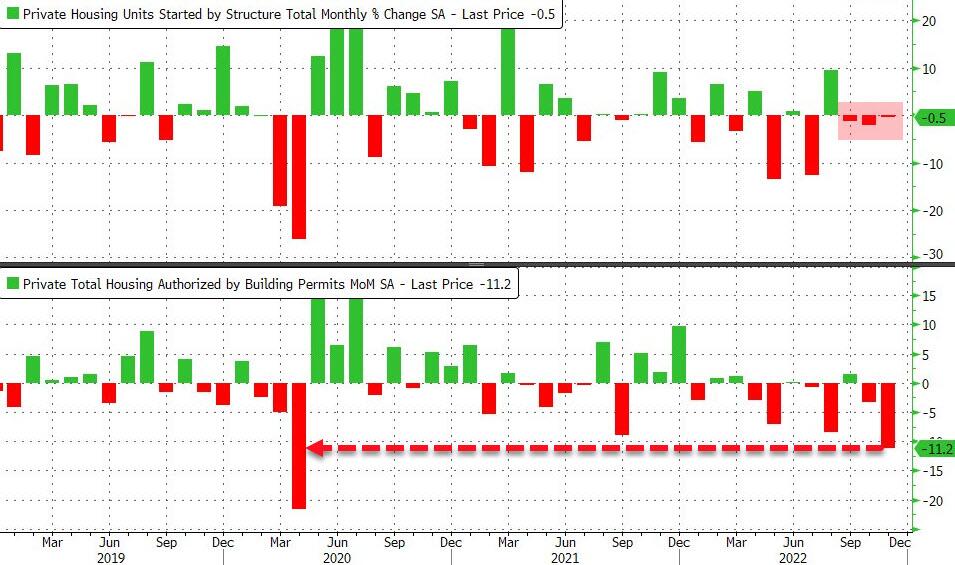
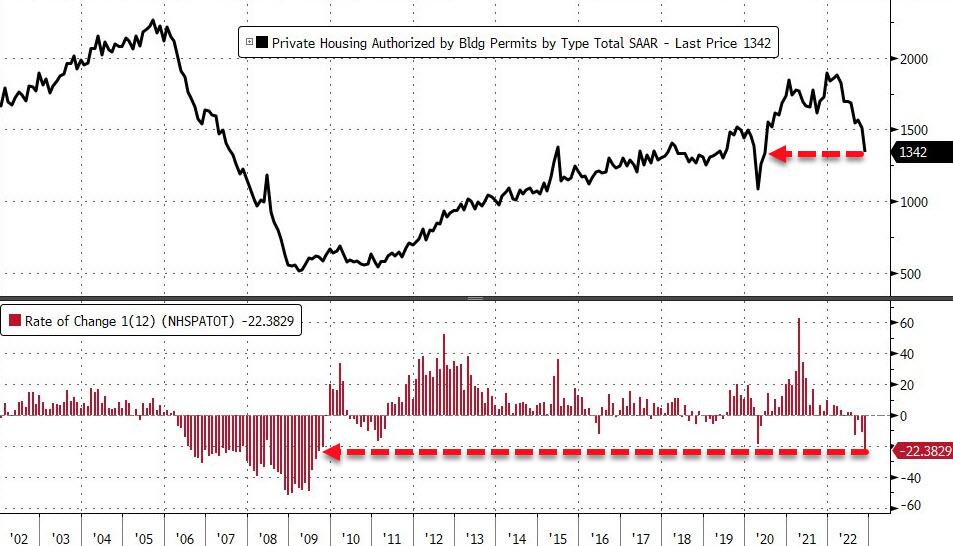
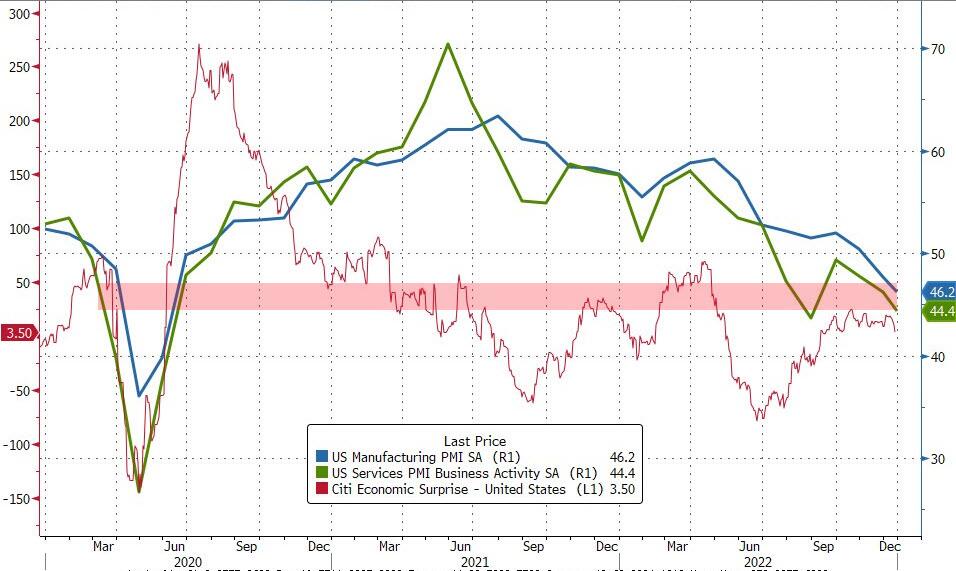
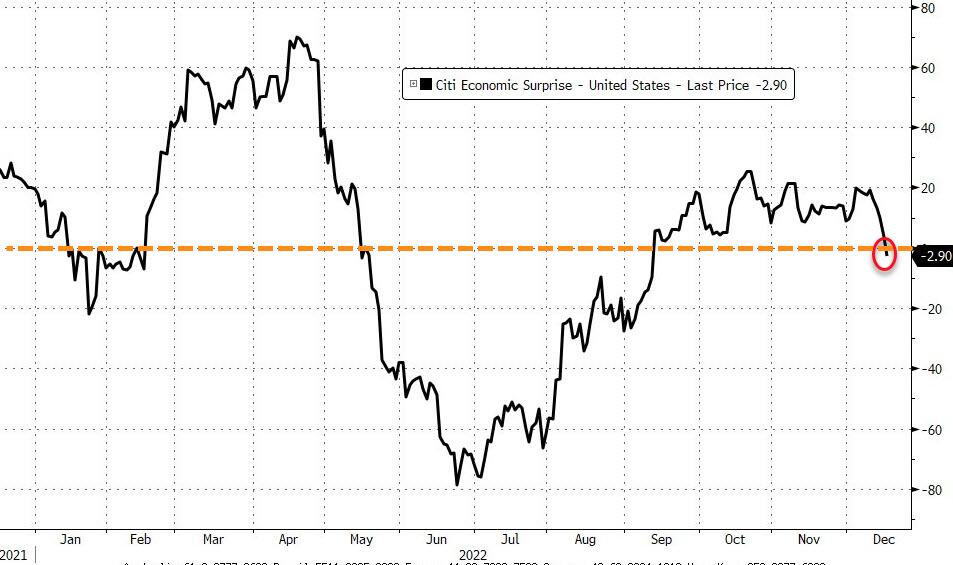
Not even horrific US Existing Home Sales, displaying their worst annual drop since 2008, could offset the bullish mood. However, the US Macro Surprise index showed the economy continuing to sink and the index has now reached its lowest point since early September.
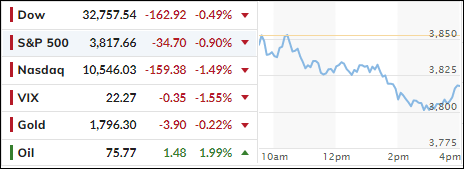
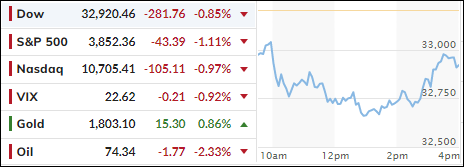
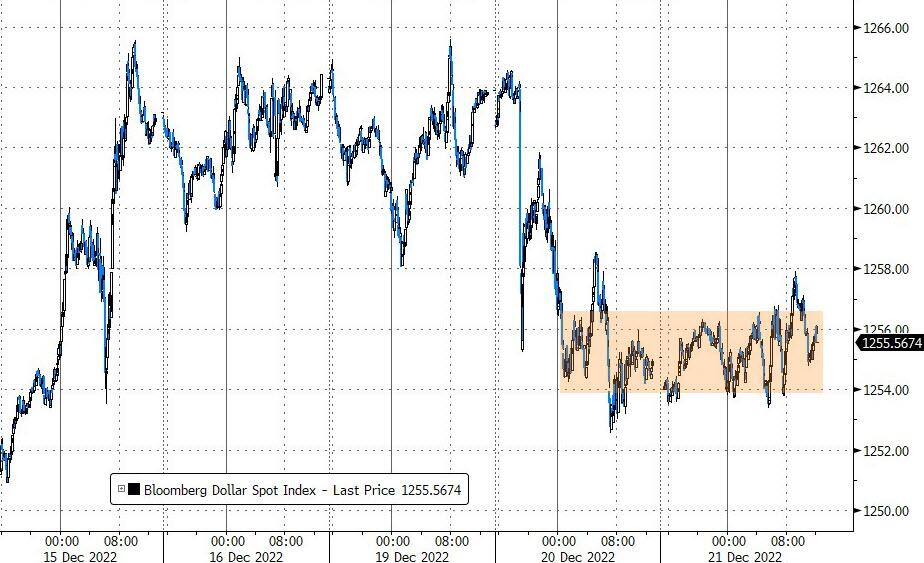
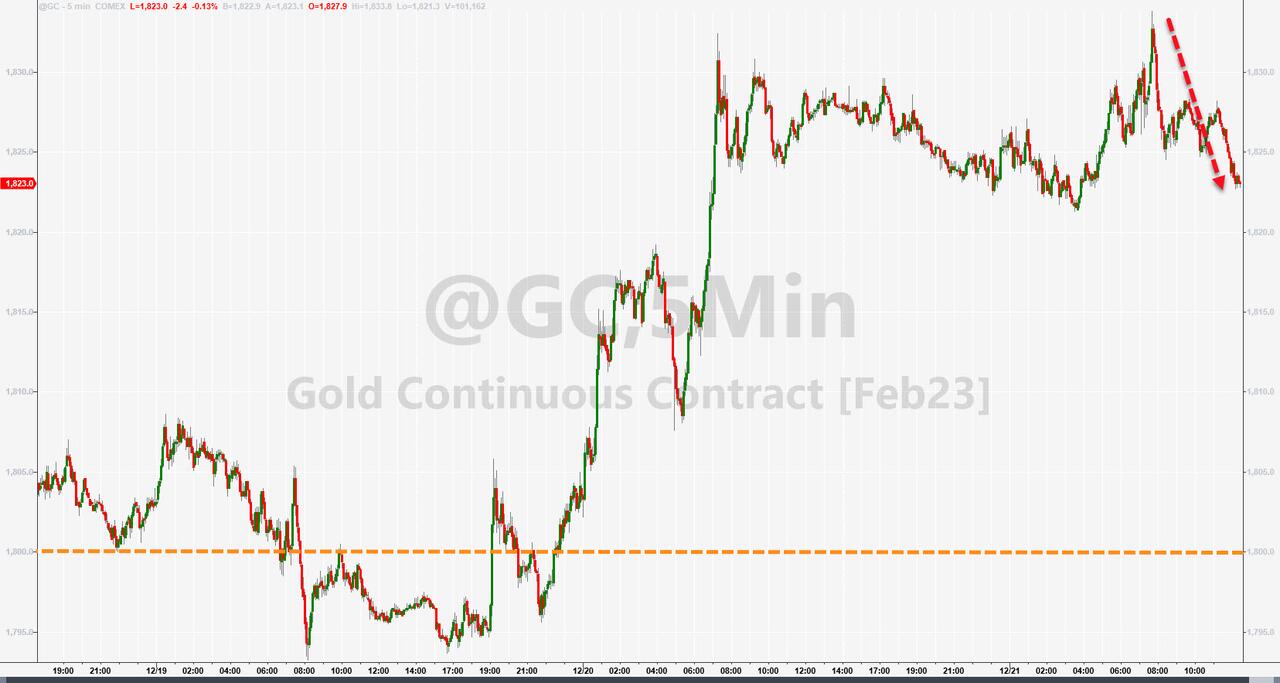
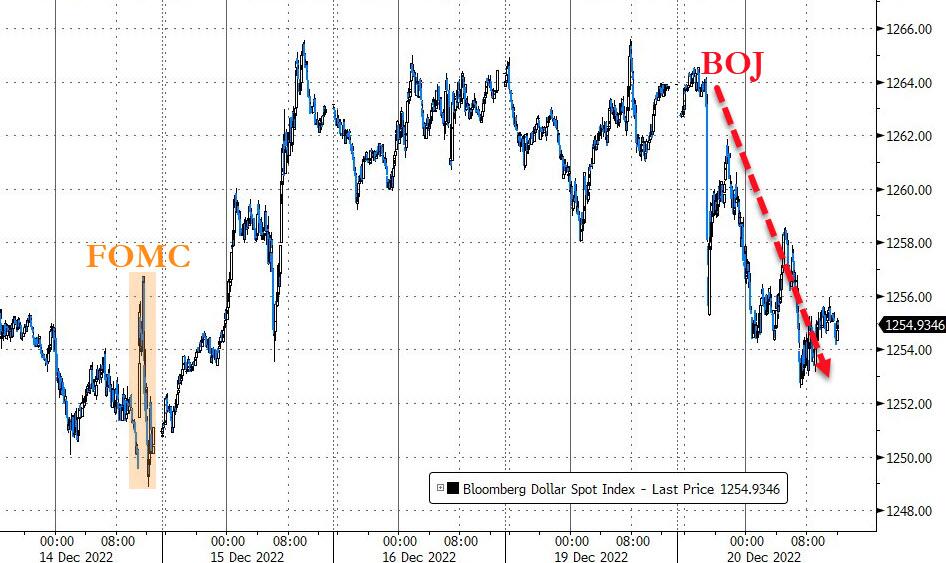
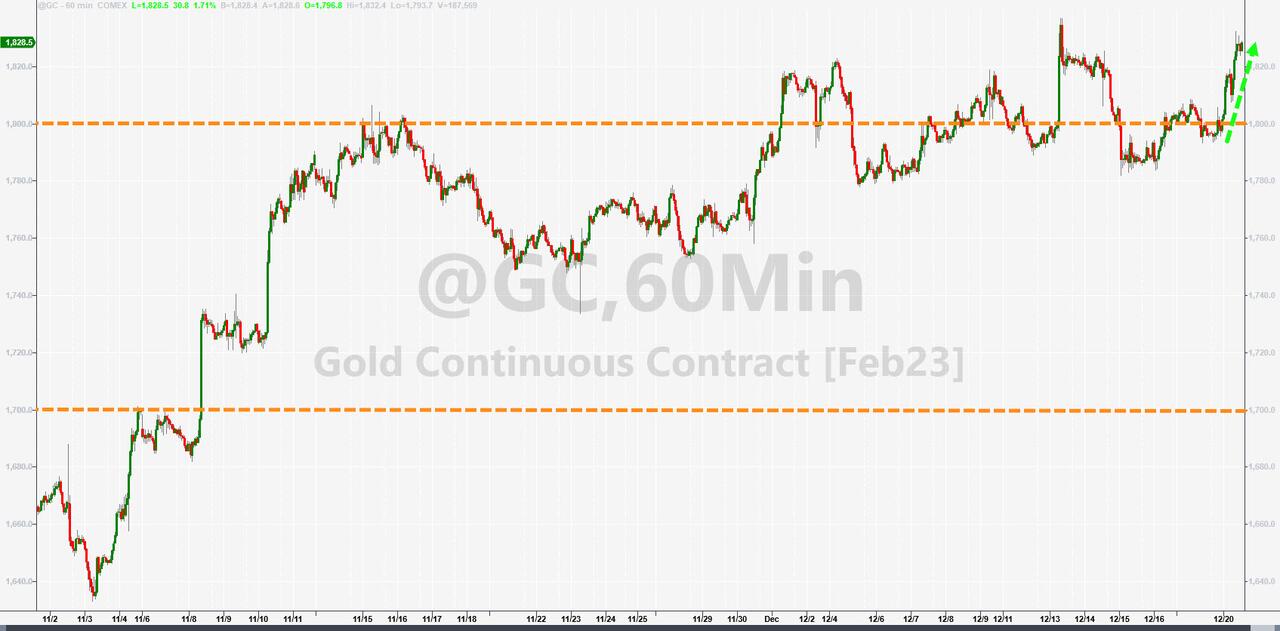
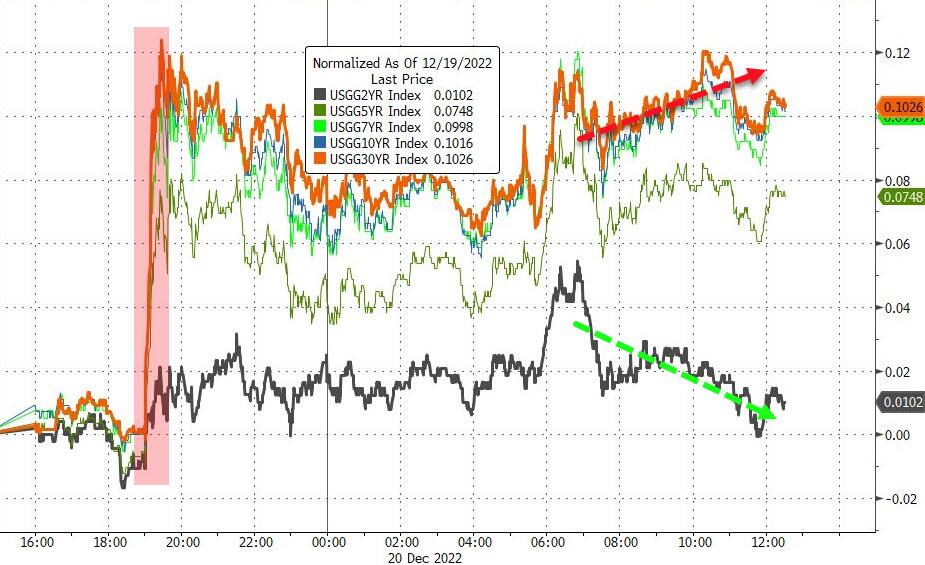
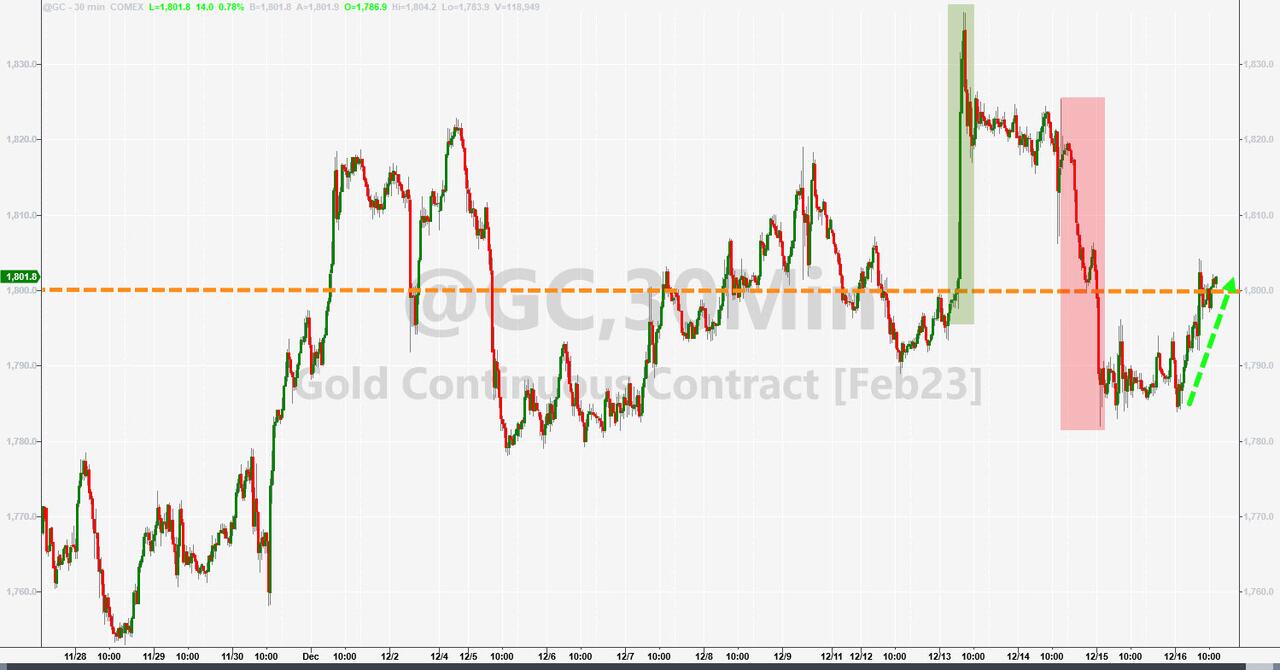
Bond yields dropped early on, rebounded, and slipped into the close ending the session just about unchanged. The US Dollar continued yesterday’s sideways pattern and held steady, as did gold with the precious metal remaining above its $1,800 level.
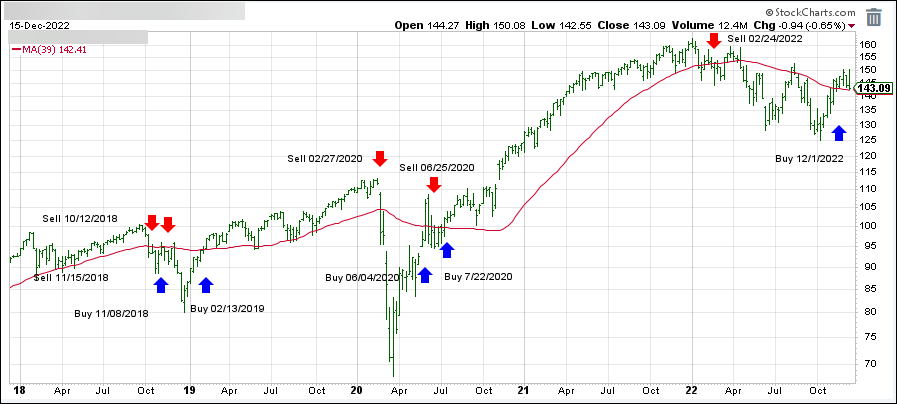
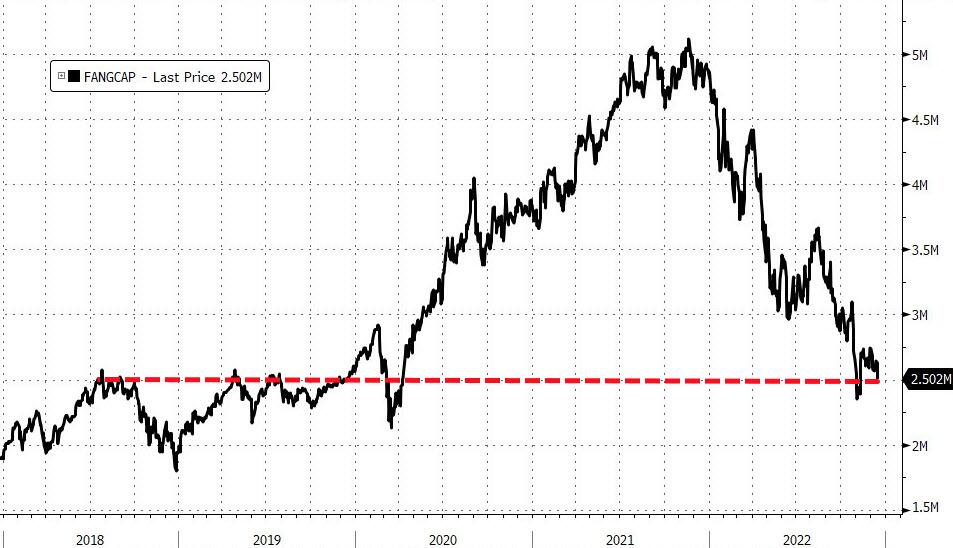
With only a few trading days left in 2022, the major indexes look to be snapping a 3-year win streak to post their worst year since 2008. As MarketWatch pointed out, the Dow is down 8.2% for the year and 3.6% for this month, while the S&P 500 shed 18.6% and 5%, respectively. The Nasdaq plummeted 31.5% in 2022 and 6.6% in December.
It was not a good year for the Buy-and-Hold crowd.
Read More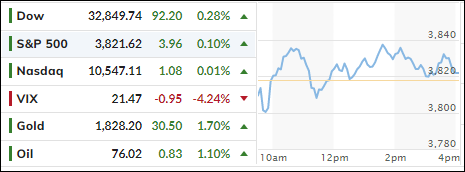
