Below, please find the latest High-Volume ETF Cutline report, which shows how far above or below their respective long-term trend lines (39-week SMA) my currently tracked ETFs are positioned.
This report covers the HV ETF Master List from Thursday’s StatSheet and includes 312 High Volume ETFs, defined as those with an average daily volume of more than $5 million, of which currently 178 (last report: 238) are hovering in bullish territory. The yellow line separates those ETFs that are positioned above their trend line (%M/A) from those that have dropped below it.
In case you are not familiar with some of the terminology used in the reports, please read the Glossary of Terms. If you missed the original post about the Cutline approach, you can read it here.
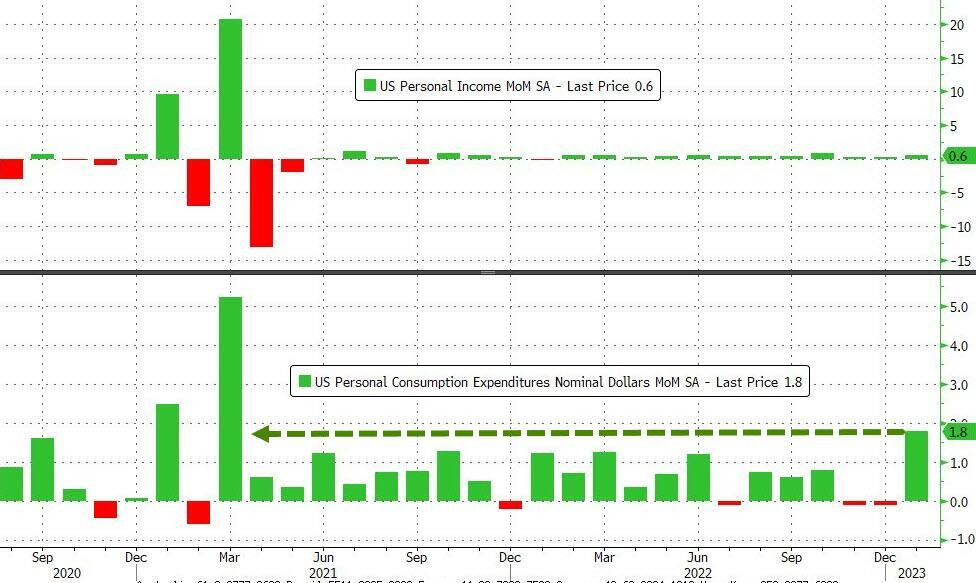
After yesterday’s modest bounce of hope, traders and algos alike were hit with another reality check, namely the fact that the Fed’s preferred measurement of inflation, the PCE (Personal Consumption Expenditures Price Index) rose 0.6% in January and 4.7% YoY.
That exceeded market expectations and, when combined with personal spending having soared by 1.8%, which was not only above hopes of 1.4%, but also the biggest leap since March 2021, you have a recipe for market chaos.
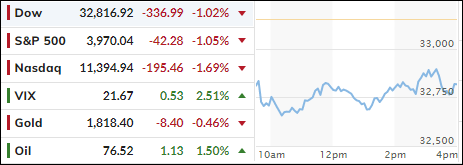
That’s exactly what we got, as the Dow dumped some 470 points early on, but that deficit was reduced a little as dip buyers could not resist and nibbled at those bottom prices. Still, to me these numbers merely represent just another nail in the “pause or pivot” agenda, as the theme, that the Fed might suddenly turn dovish, is merely a vanishing point in the rearview mirror.
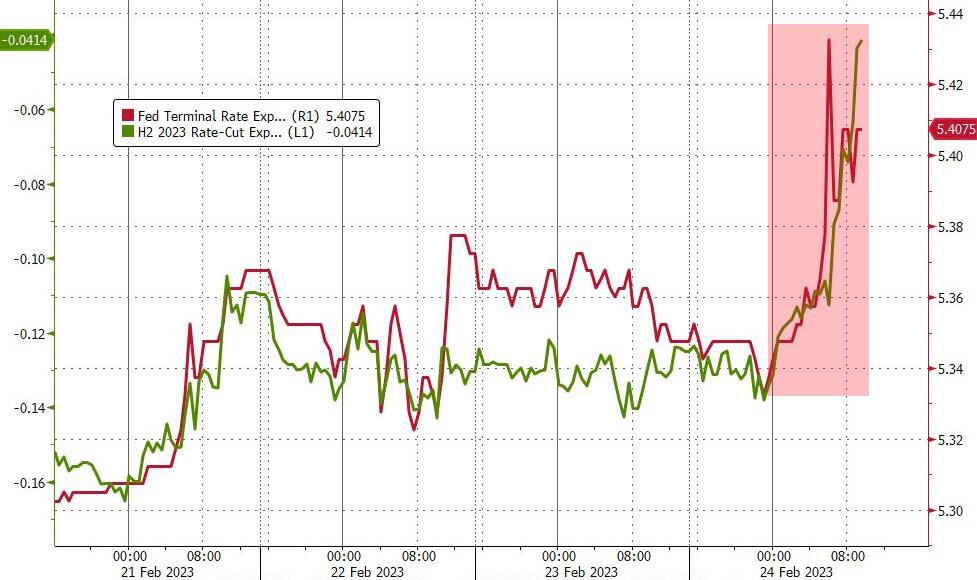
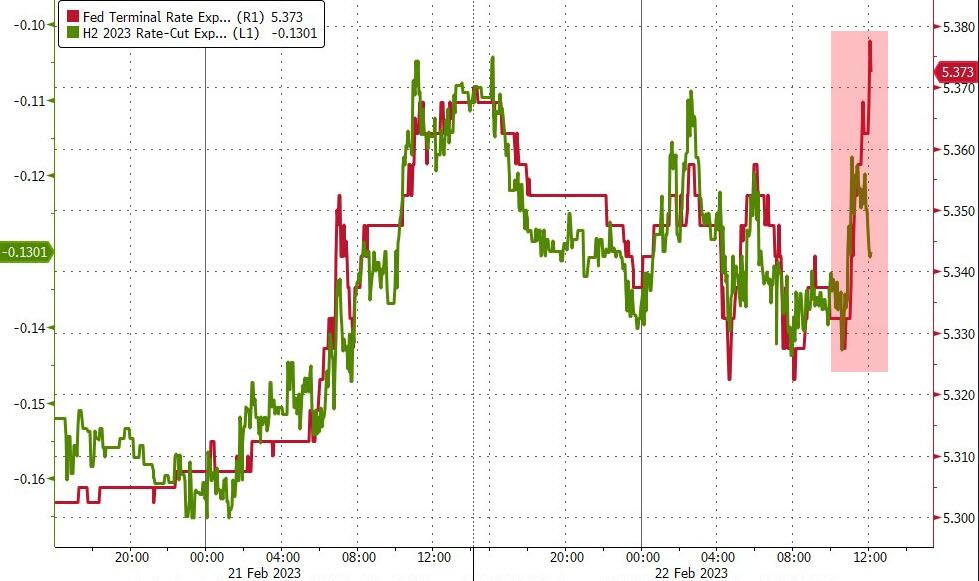
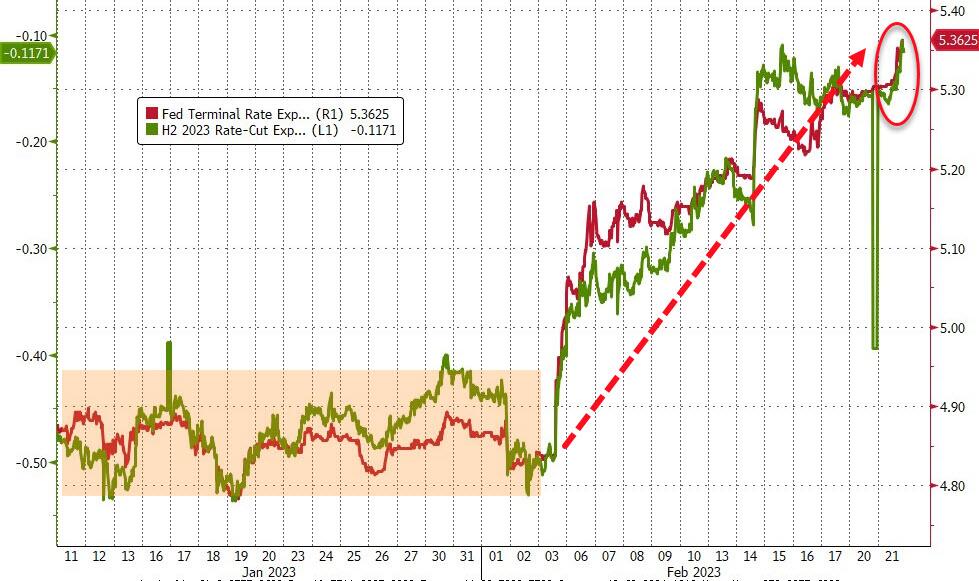
As a result, the Fed’s terminal rate propelled to a new high, as the hope for rate cuts disappeared, which is a sign that recent receding inflation numbers were nothing but transitory, and that we may now see again an increase in prices.
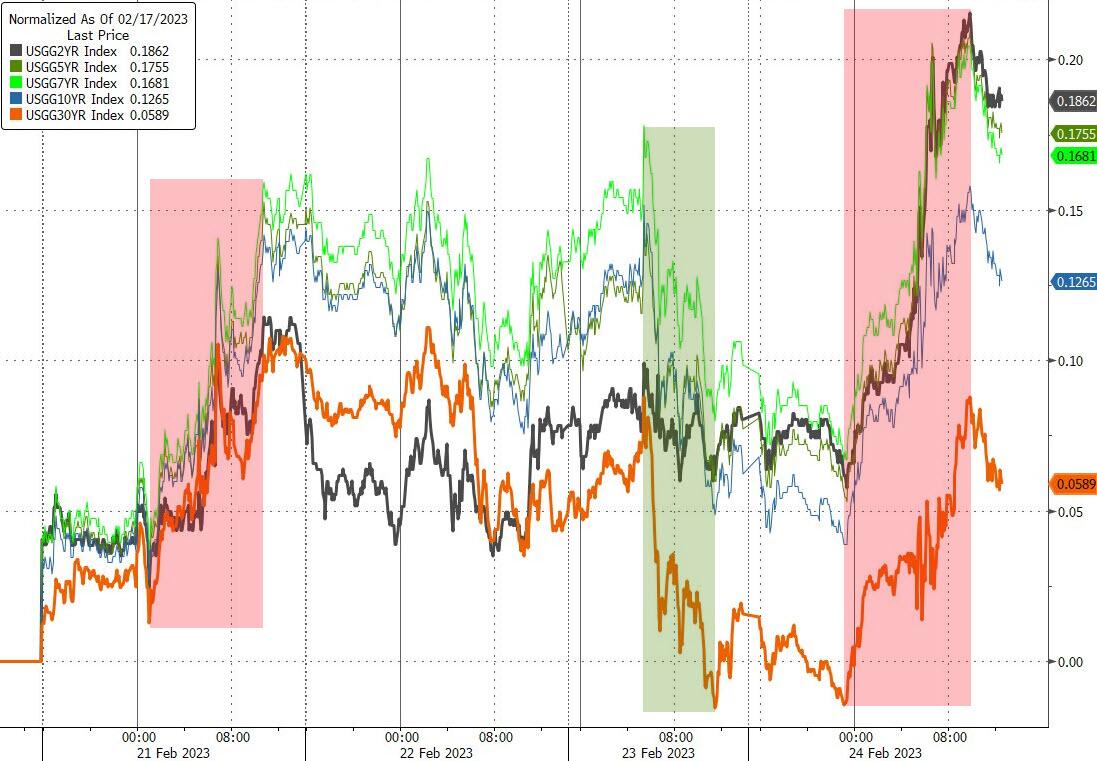
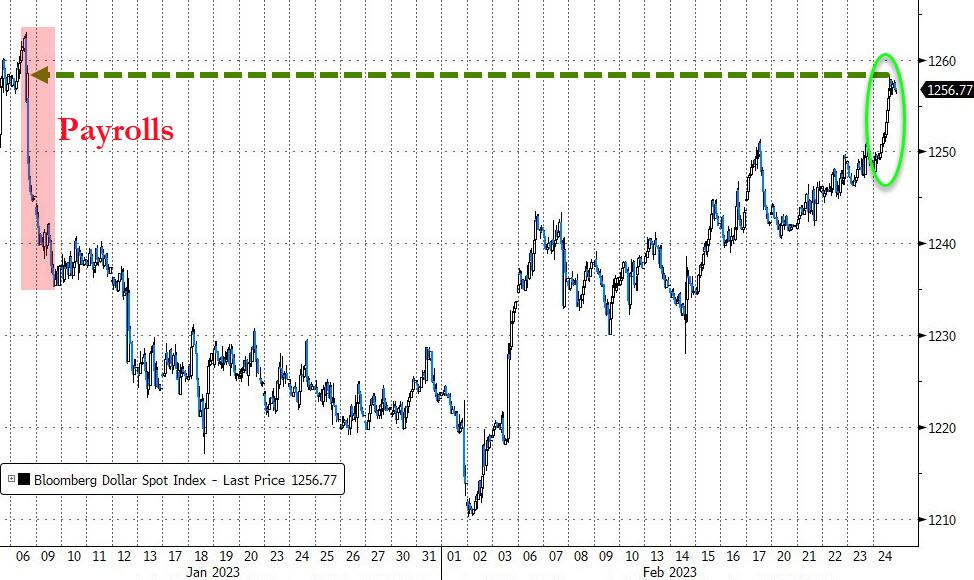
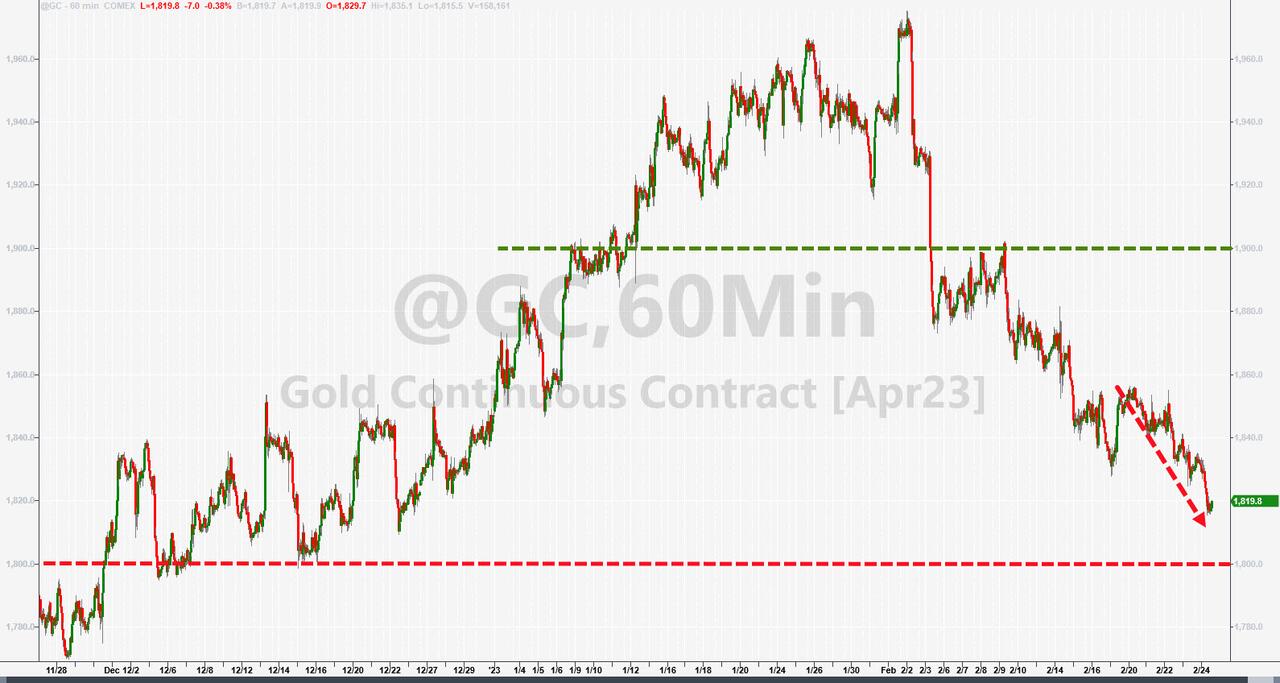
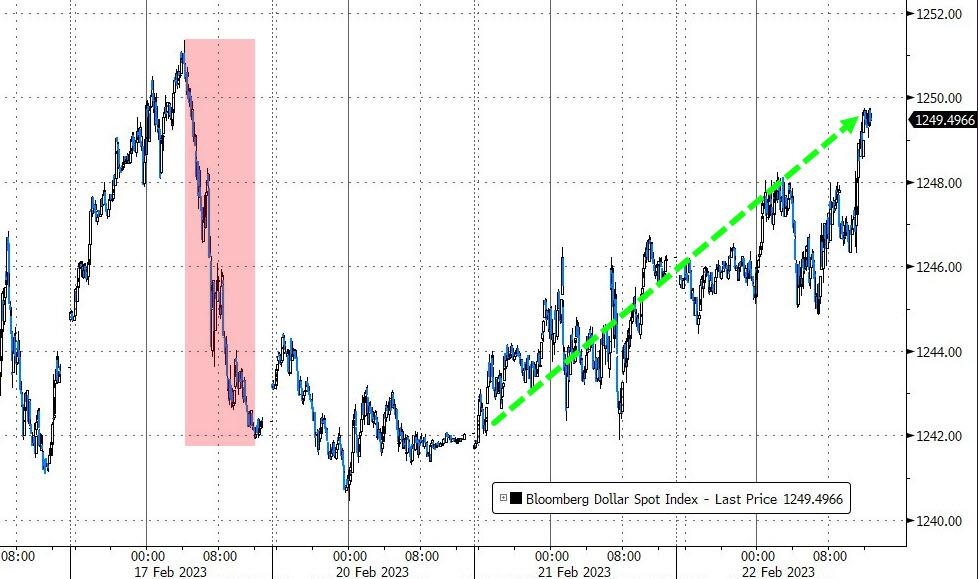
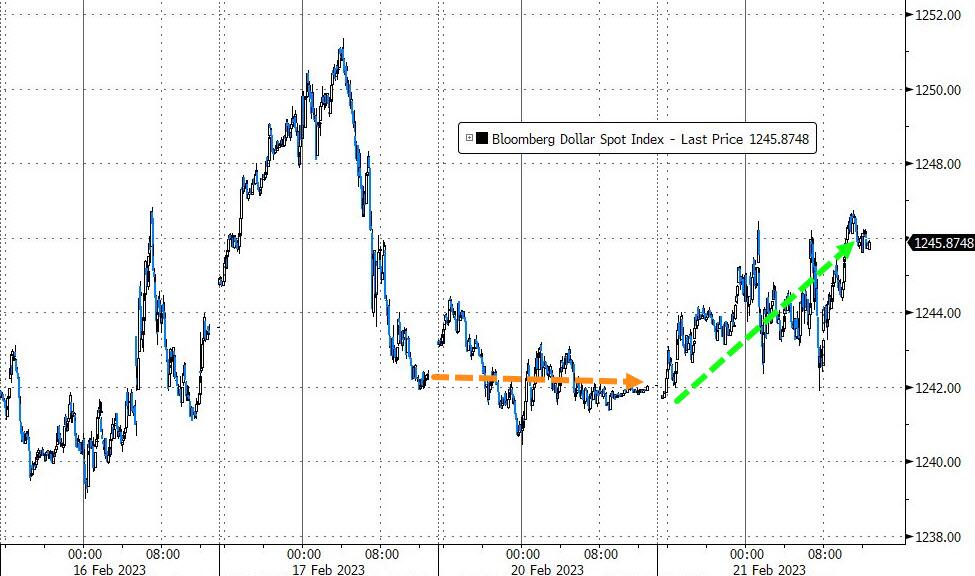
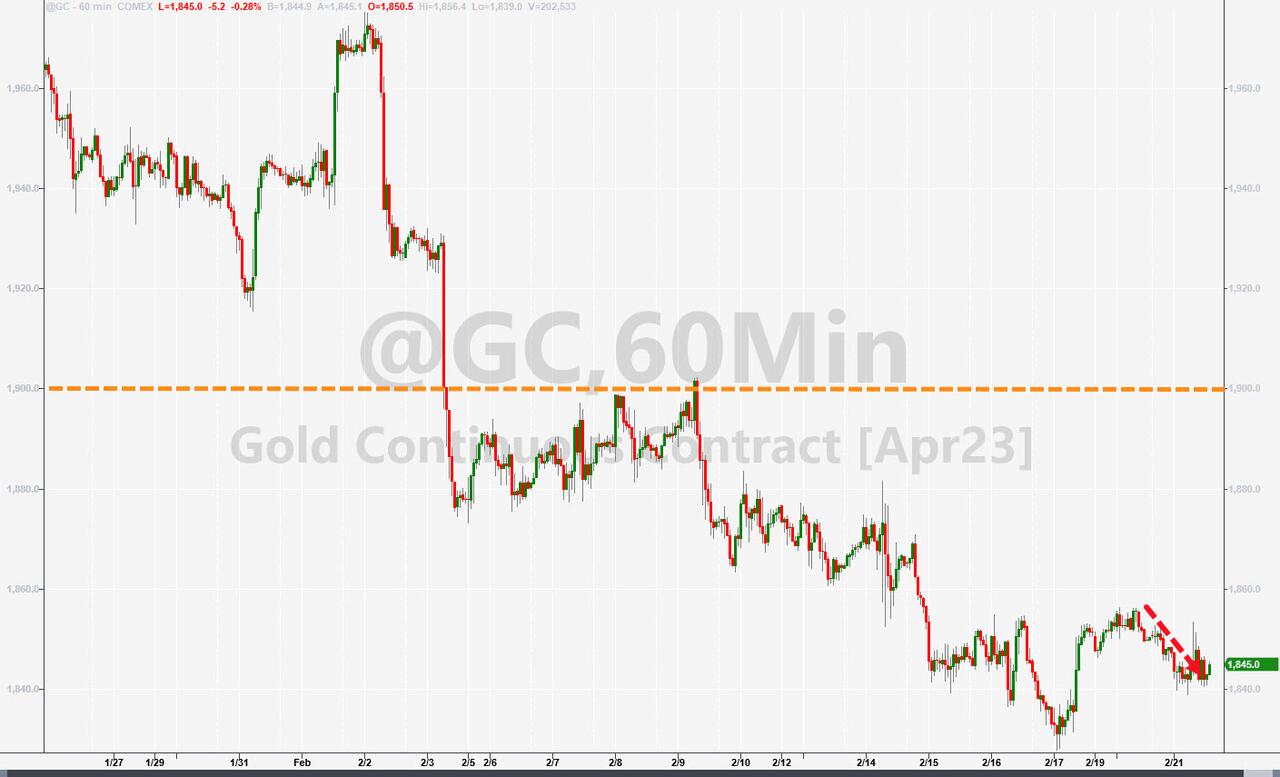
Bond yields were higher during this Holiday shortened week, with the US Dollar continuing its upswing, which now has erased all of January’s losses, a trend that was not beneficial for Gold, which, however, has managed to defend its $1,800 level.
For the month of February, the S&P 500 has surrendered 2.6% so far, with two trading days to go. While our Trend Tracking Indexes (TTIs-section 3) have weakened as well, they still remain on the bullish side of their respective trend lines.
However, should the inflation scenario worsen, and consequently bond yields surging even higher, we must be prepared to deal with a potential sell signal in equities. For sure, I am ready to pull the trigger, if a major change in market direction necessitates such a move.
ETF Data updated through Thursday, February 23, 2023
Methodology/Use of this StatSheet:
1. From the universe of over 1,800 ETFs, I have selected only those with a trading volume of over $5 million per day (HV ETFs), so that liquidity and a small bid/ask spread are assured.
2. Trend Tracking Indexes (TTIs)
Buy or Sell decisions for Domestic and International ETFs (section 1 and 2), are made based on the respective TTI and its position either above or below its long-term M/A (Moving Average). A crossing of the trend line from below accompanied by some staying power above constitutes a “Buy” signal. Conversely, a clear break below the line constitutes a “Sell” signal. Additionally, I use a 12% trailing stop loss on all positions in these categories to control downside risk.
3. All other investment arenas do not have a TTI and should be traded based on the position of the individual ETF relative to its own respective trend line (%M/A). That’s why those signals are referred to as a “Selective Buy.” In other words, if an ETF crosses its own trendline to the upside, a “Buy” signal is generated. Here too, I recommend trailing sell stop of 12%, or less, depending on your risk tolerance.
If you are unfamiliar with some of the terminology, please see Glossary of Termsand new subscriber information in section 9.
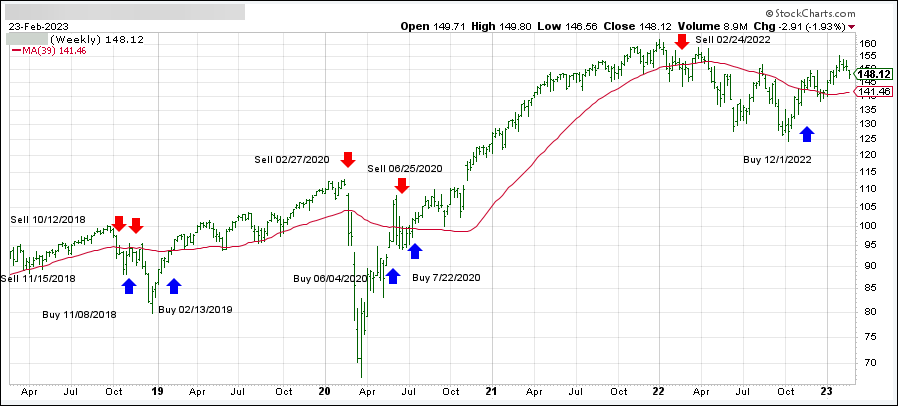
1. DOMESTIC EQUITY ETFs: BUY — since 12/01/2022
Click on chart to enlarge
Our main directional indicator, the Domestic Trend Tracking Index (TTI-green line in the above chart) has reclaimed its long-term trend line (red) by +4.70% and remains in “Buy” mode for the time being.
The release of the most recent Fed minutes was on traders’ minds, while they looked for clues as to what the next move by the Central Bank would be in terms of inflationary measures. An early bounce of hope reversed, despite a short squeeze, and the bears scored another win with the S&P 500 now having notched its 4th straight day of losses.
The Fed’s summary showed that inflation hovered well above the Fed’s 2% target, while the Labor market appears to be still very tight and thereby continues to keep upward pressure on wages and prices.
The only positive was the mention of a welcome reduction in the monthly pace of price increases, as MarketWatch reported. But, the disclaimer followed right away in that more progress would be required to confirm a sustainable downward path of inflationary trends.
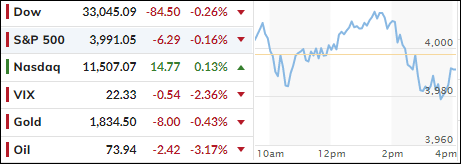
In other words, no hope was given to those still thinking that the Fed might pause/pivot in the near future. As a result, the early bullish theme shifted into reverse, and two of the three major indexes closed the session with modest losses.
Bond yields rode the roller coaster with yields softening somewhat, as the 10-year pulled back a modest 3 bps to close at 3.925%. However, the Fed’s terminal rate moved higher from yesterday’s 5.33% indicating more hawkishness.
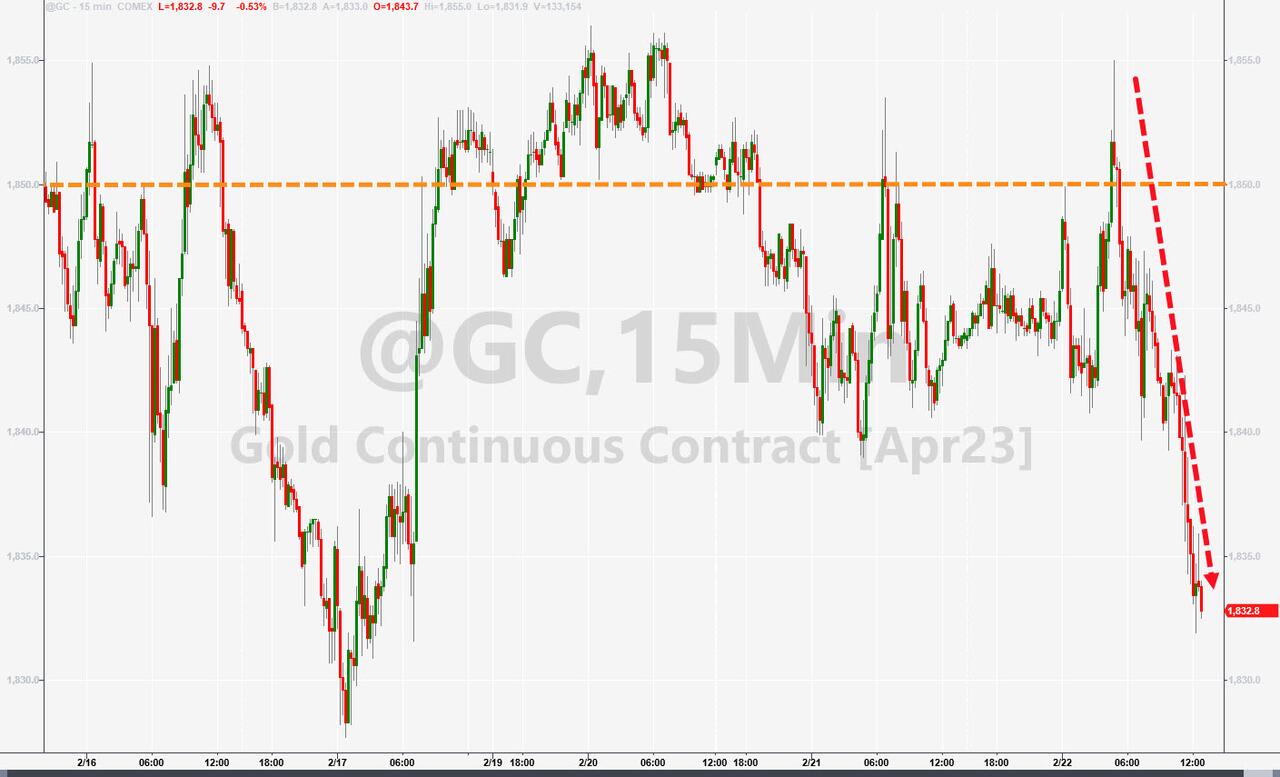
The US Dollar resumed its trajectory to higher prices and wiped out the majority of Friday’s losses. Gold slipped again and was not able to hang on to its $1,850 level.
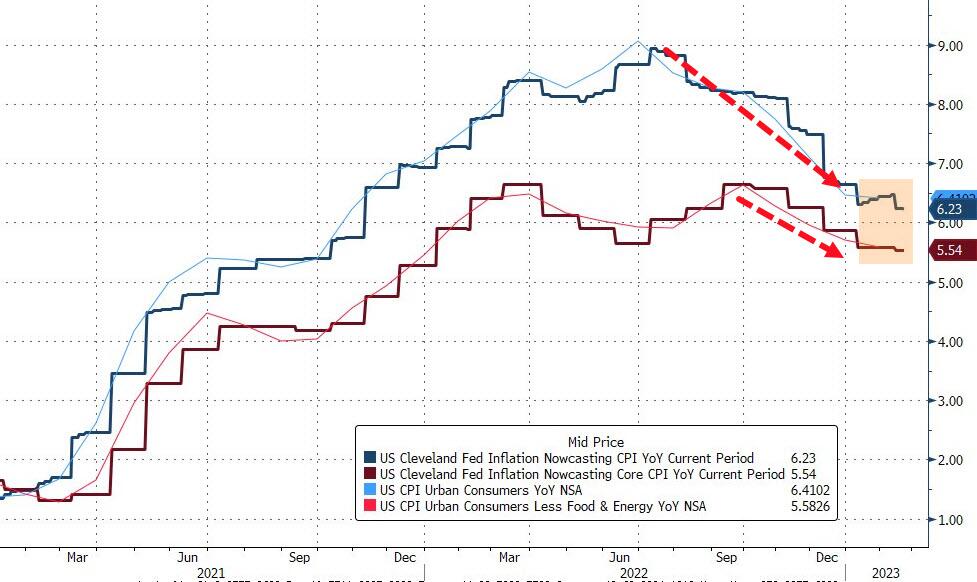
The Cleveland Fed’s own inflation forecasting model shows that the disinflation of the past few months appears to have come to an end, as ZeroHedge commented. Does that mean inflation will now rear its ugly head again?
It appeared that traders and algos alike finally were confronted with a reality check, namely that interest rates will not retreat and likely move considerably higher. This has been the consistent theme of the Fed and its mouthpieces, and I have repeatedly suggested that front running and hopeful thinking does not change underlying facts.
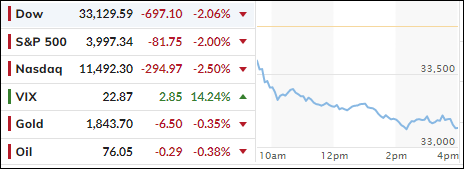
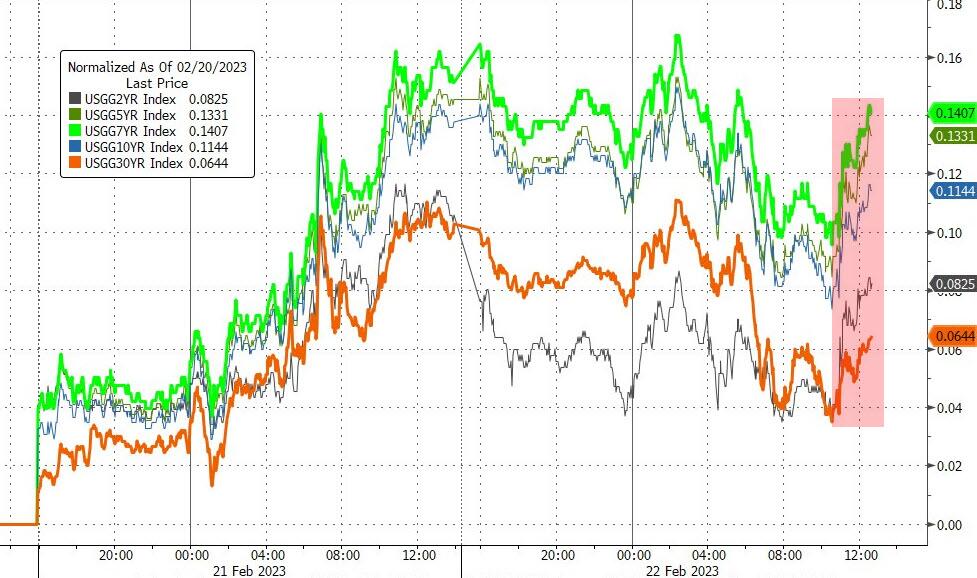
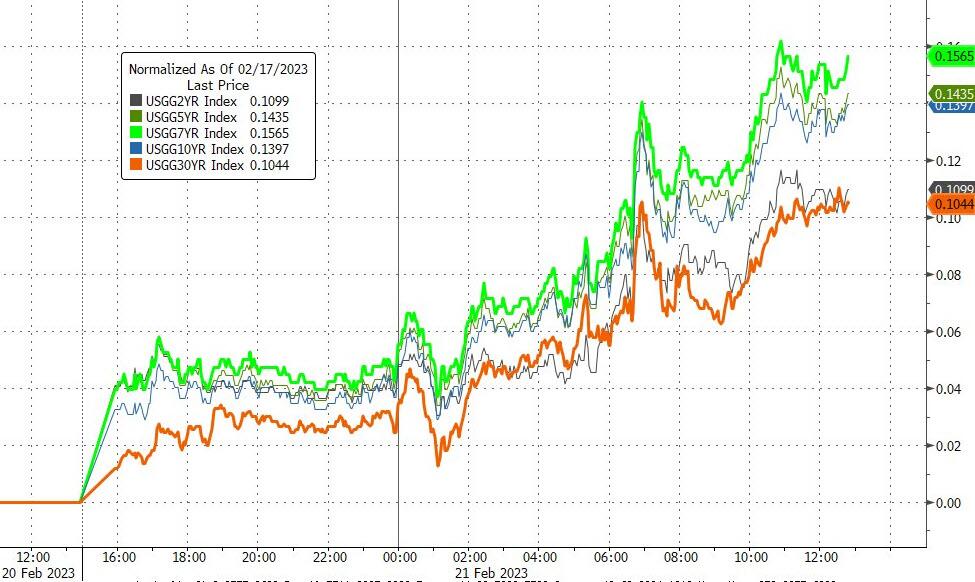
That’s what we saw today, as the markets experienced a phenomenon that I call “hammer time,” meaning that all asset classes were slammed and there was no place to hide. Especially not bonds, as all yields rose sharply with the 10-year propelling to its highest level this year (3.96%).
The widely held bond ETF TLT dropped over 2% on the day and has now lost some 6.3% for the month of February. So much for the perceived security of this asset class in times of turmoil.
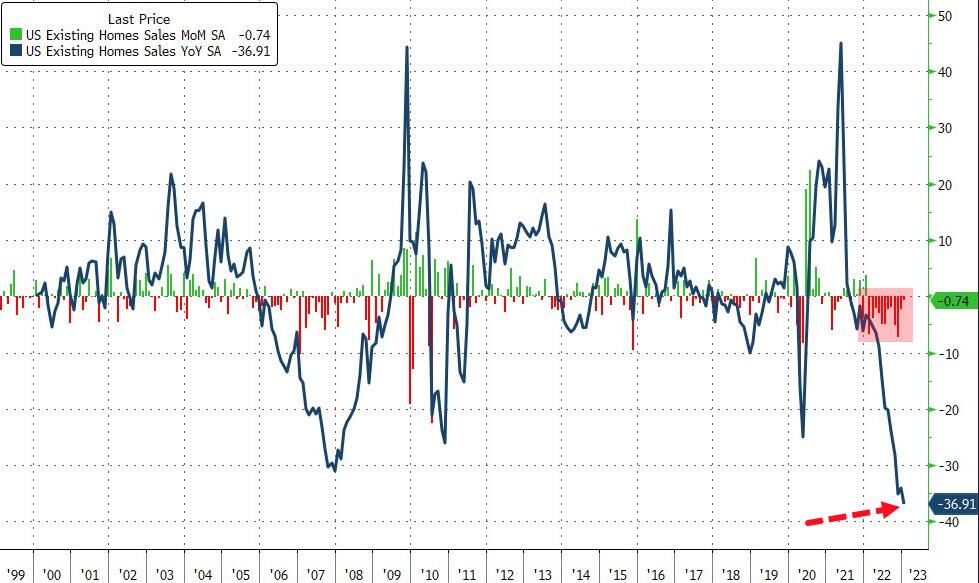
Surging rates obviously pressured the bullish theme, while retail earnings rang alarm bells regarding the health of the consumer and his ability to keep spending. After all, some 67% of all economic activity is consumer generated. News in the econ arena was poor, with Walmart issuing disappointing guidance, while Existing Home Sales unexpectedly declined in January and collapsed YoY by 37%. Ouch!
The Fed’s terminal rate exploded to over 5.3% and the usual dovish voices, counting on any rate cuts in 2023, disappeared mysteriously. This means, for the time being, that the consistently promoted “Fed pivot” narrative has died.
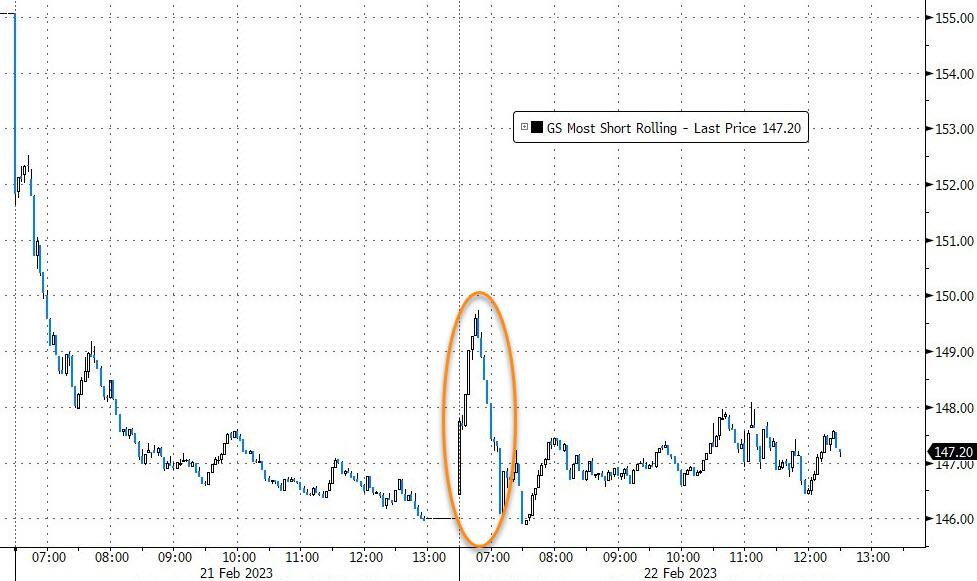
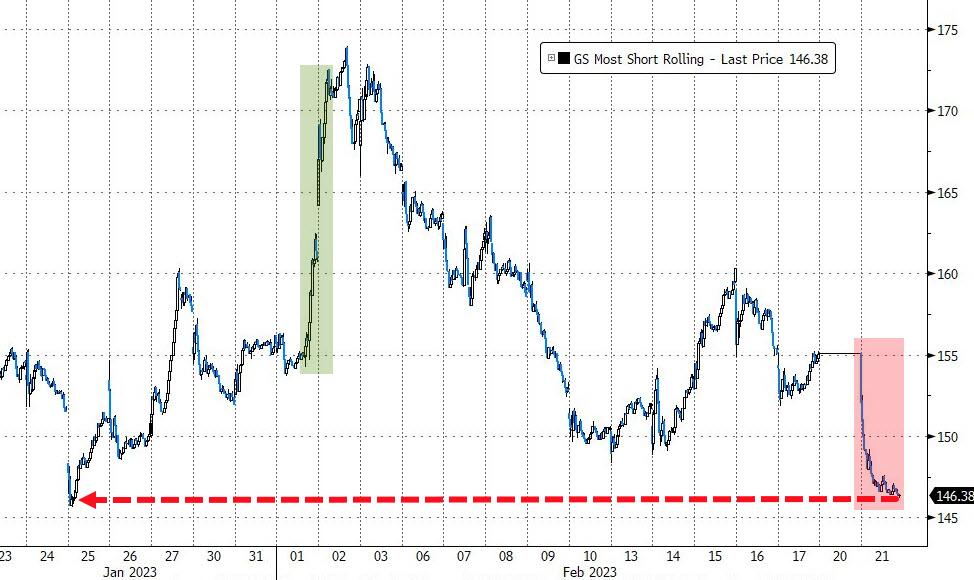
The most shorted stocks were clubbed like a baby seal, according to ZeroHedge, and saw their biggest single day decline since June 2022.
The US Dollar gained a little on the day, causing Gold to drop a tad.
Below, please find the latest High-Volume ETF Cutline report, which shows how far above or below their respective long-term trend lines (39-week SMA) my currently tracked ETFs are positioned.
This report covers the HV ETF Master List from Thursday’s StatSheet and includes 312 High Volume ETFs, defined as those with an average daily volume of more than $5 million, of which currently 238 (last report: 239) are hovering in bullish territory. The yellow line separates those ETFs that are positioned above their trend line (%M/A) from those that have dropped below it.

