Do you want to know which ETFs are hot and which ones are not? Then you need my High-Volume ETF Cutline report. It tells you how close or far each of the 311 ETFs I follow is from its long-term trend line (39-week SMA). These are the ETFs that trade more than $5 million a day, so they are not some obscure funds that nobody cares about.
The report is split into two parts: The winners that are above their trend line (%M/A), and the losers that are below it. The yellow line is the line of shame that separates them. You can see how many ETFs are in each group and how they have changed since the last report (221 vs. 177 current).
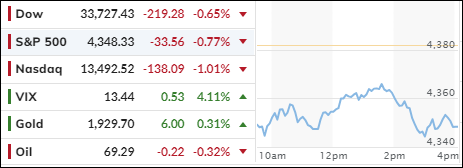
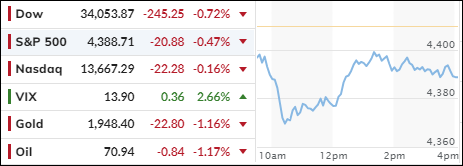
BEARS MAUL BULLS AS INFLATION AND RECESSION FEARS MOUNT
[Chart courtesy of MarketWatch.com]
Moving the markets
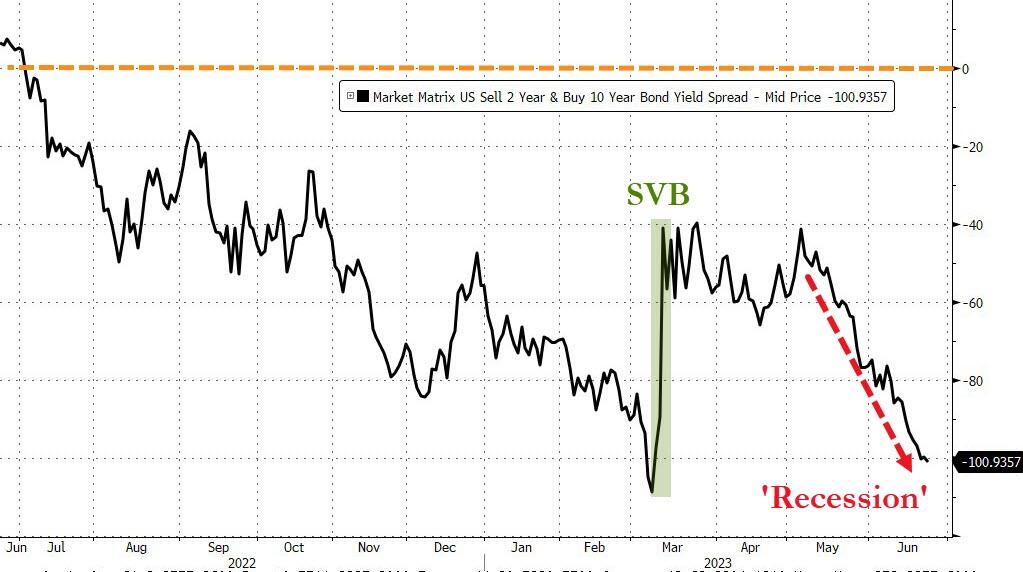
The bulls took a break this week as the bears came out to play. The main indexes snapped their winning streak as inflation fears, Fed tightening, and recession worries spooked the traders. The yield curve inverted again, signaling trouble ahead for the economy.
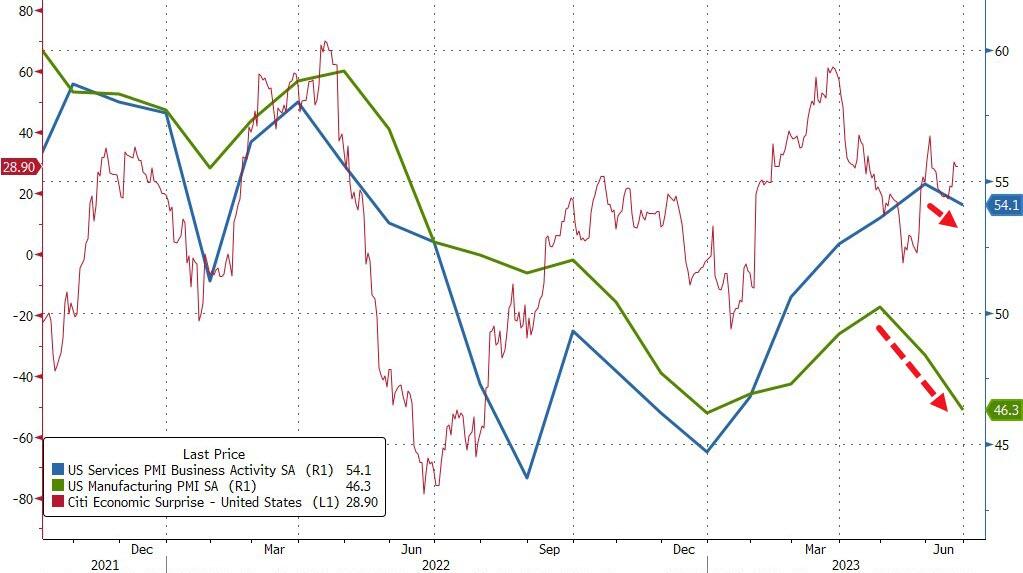
The bad news started overseas, where European PMI numbers showed a slowdown in manufacturing and services. The US PMI followed suit, dragging down the futures markets.
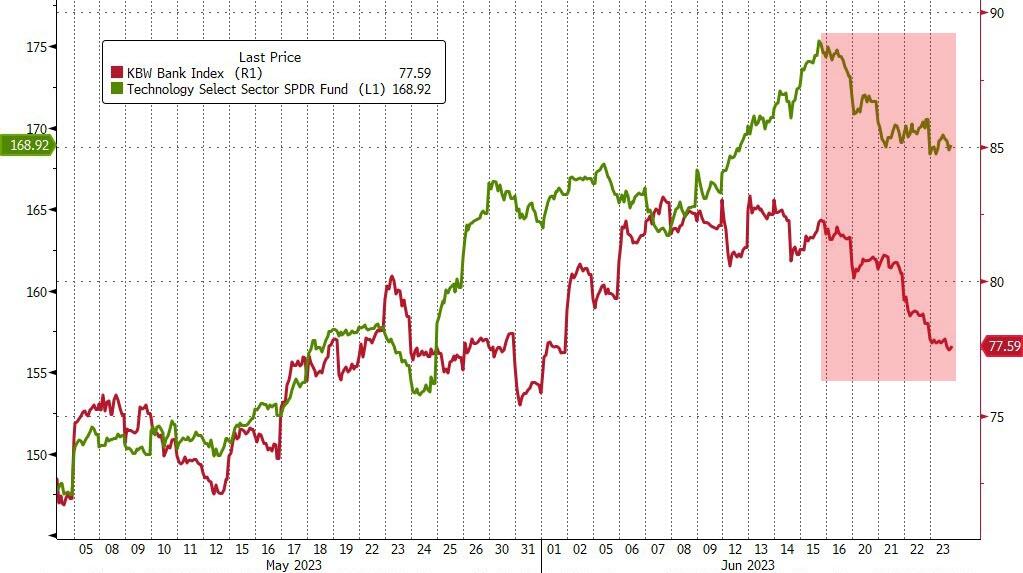
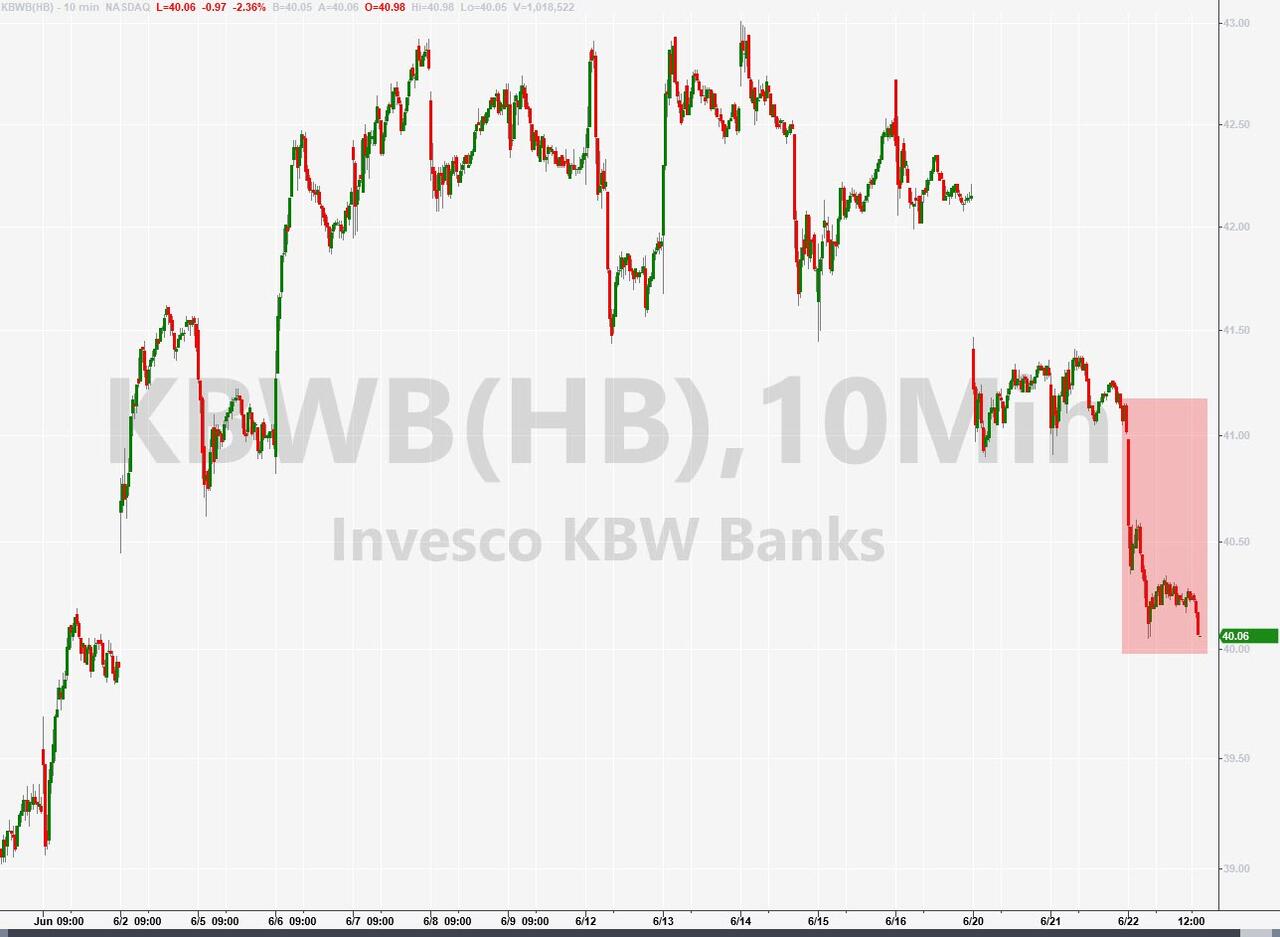
The sell-off was widespread, with almost all S&P 500 stocks in the red. This was a stark contrast to the recent rally, which was fueled by a handful of big tech stocks. Regional banks tried to bounce back but failed miserably. The Regional Banking ETF KRE plunged more than 8% this week, while the Nasdaq and Small Caps suffered their worst weekly loss since March.
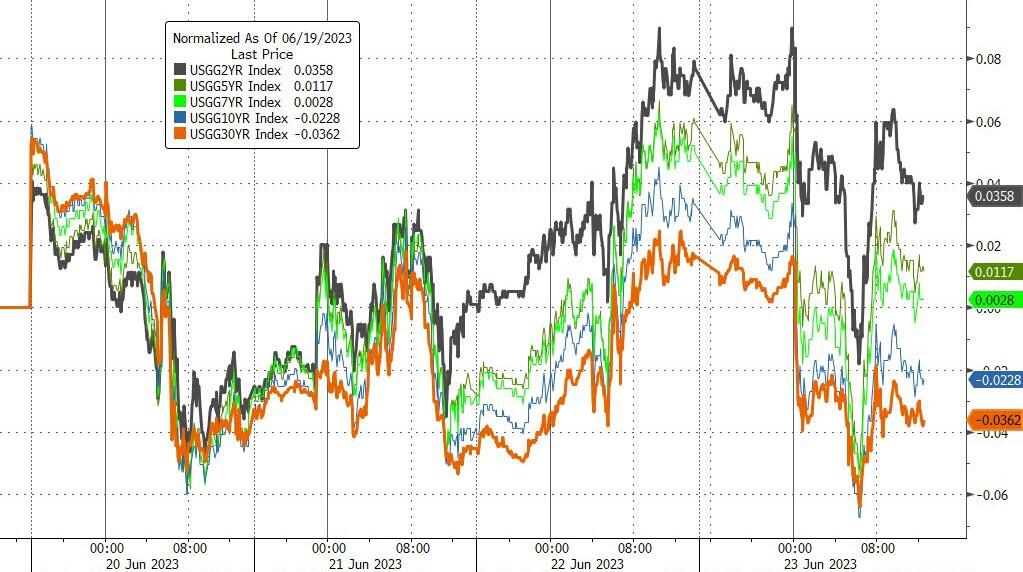
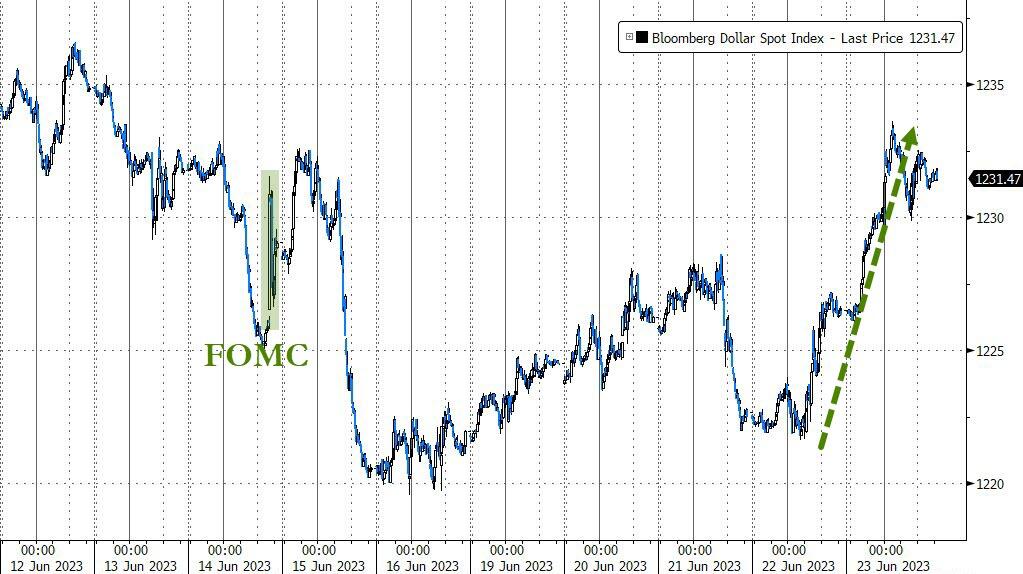
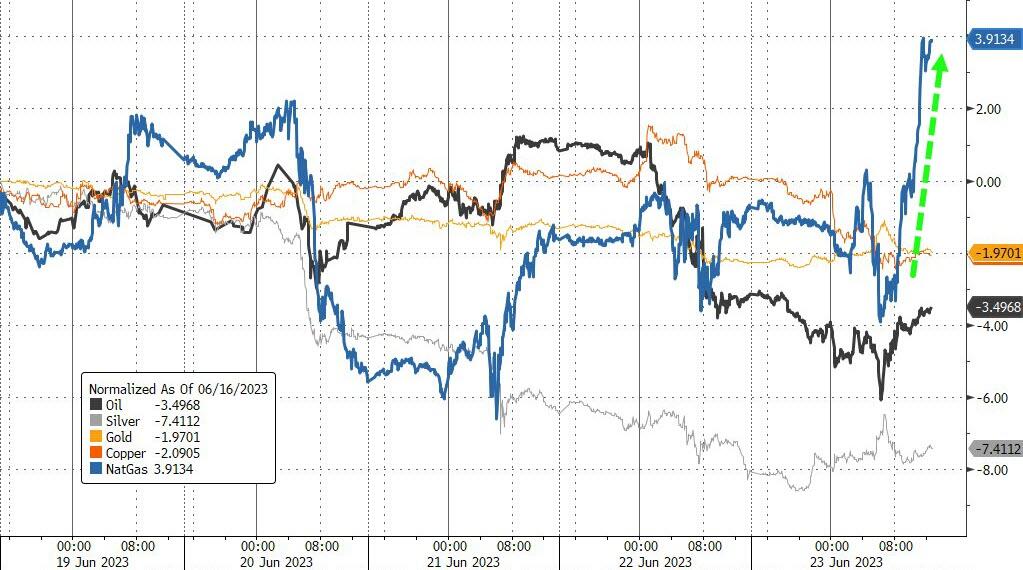
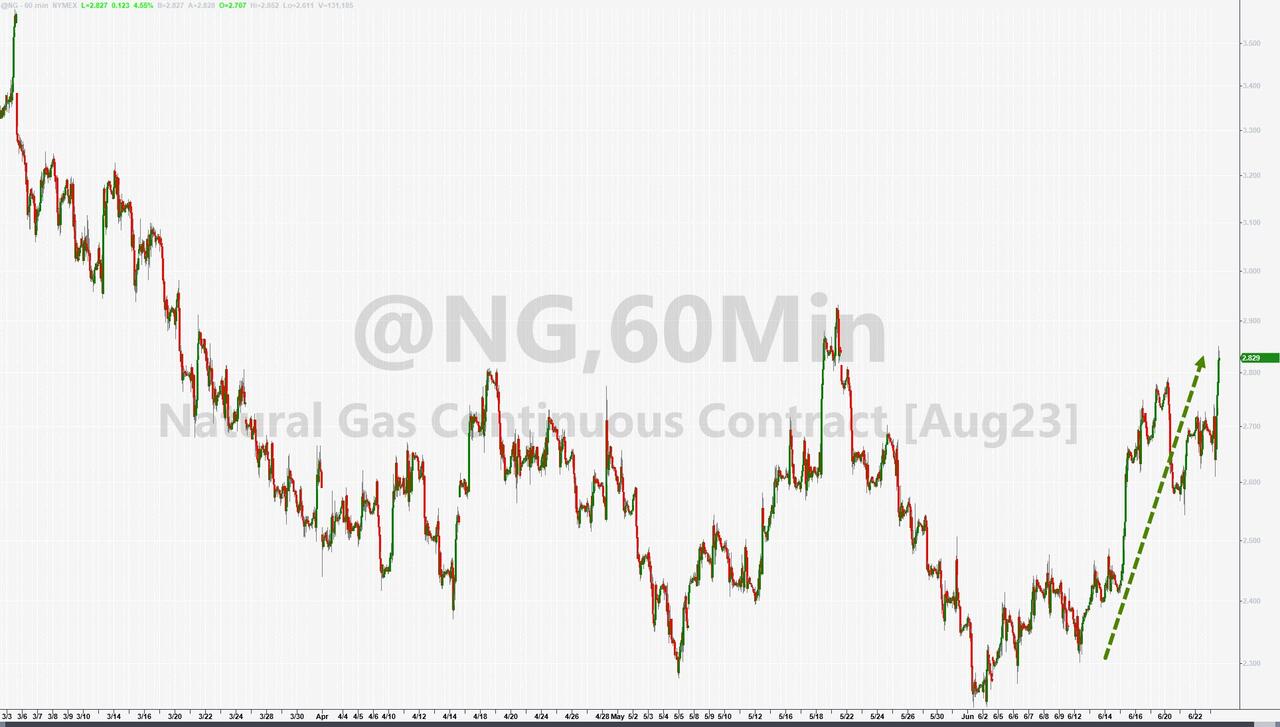
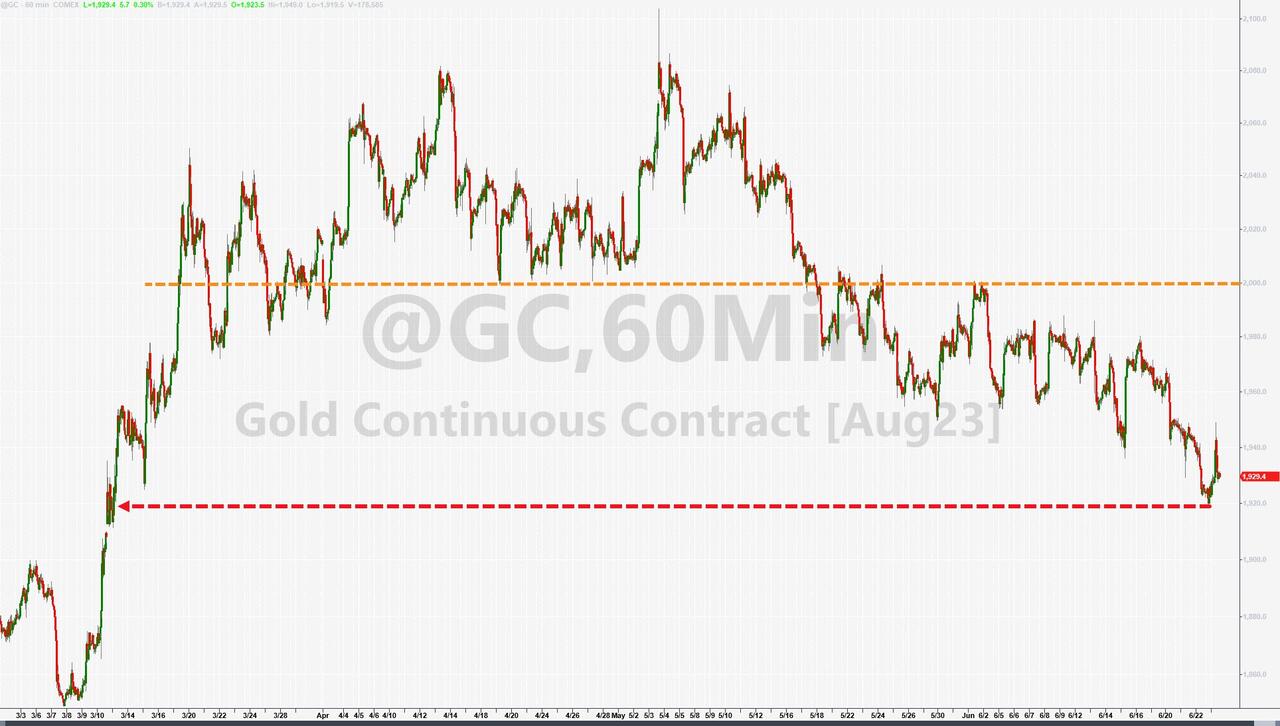
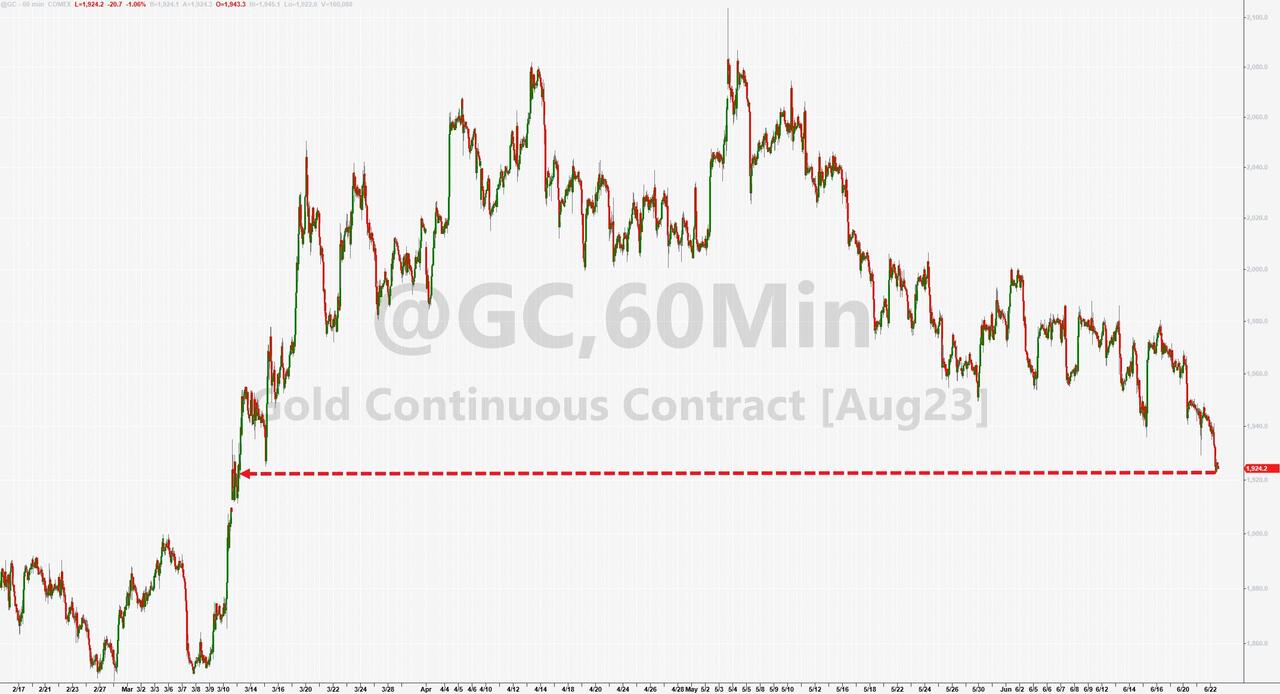
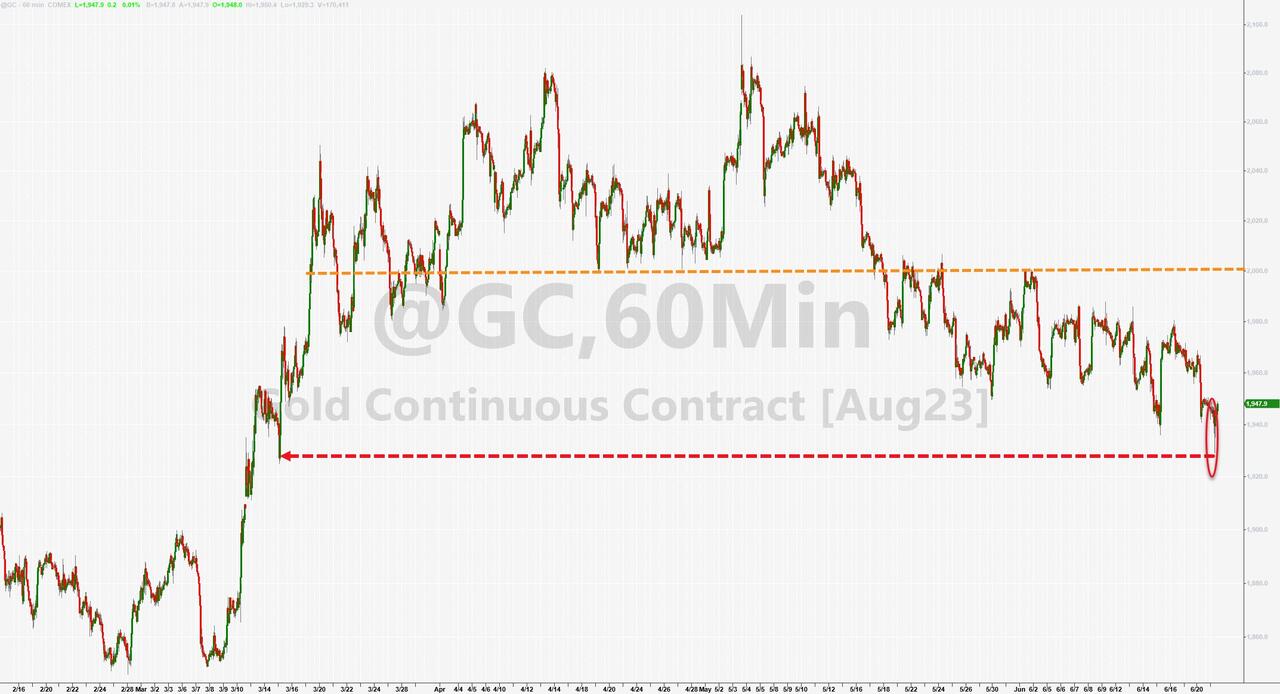
Big tech and banks moved in tandem, both ending the week lower for the first time in seven weeks. Bond yields were mixed, the Dollar rose, while commodities mostly fell on growth concerns. Natural Gas was an exception, surging higher. Gold recovered today but still languishes at 3-month lows.
The Fed holds the key to the market’s next move. But don’t expect any easy answers from them. They face a tough dilemma:
Either raise rates to fight inflation and risk crashing the economy and markets or print more money and devalue the currency in your wallet.
What will they do?
My guess is they will choose the latter when push comes to shove. Because who doesn’t love some free money?
Out of the 1,800+ ETFs out there, I only pick the ones that trade over $5 million per day (HV ETFs), so you don’t get stuck with a lemon that nobody wants to buy or sell.
Trend Tracking Indexes (TTIs)
These are the main indicators that tell you when to buy or sell Domestic and International ETFs (section 1 and 2). They do that by comparing their position to their long-term M/A (Moving Average). If they cross above, and stay there, it’s a green light to buy. If they fall below, and keep going, it’s a red light to sell. And to make sure you don’t lose your shirt if things go south, I also use a 12% trailing stop loss on all positions in these categories.
All other investment areas don’t have a TTI and should be traded based on the position of each ETF relative to its own trend line (%M/A). That’s why I call them “Selective Buy.” In other words, if an ETF goes above its own trend line, you can buy it. But don’t forget to use a trailing sell stop of 12%, or less if you’re feeling nervous.
If some of these words sound like Greek to you, please check out the Glossary of Terms and new subscriber information in section 9.
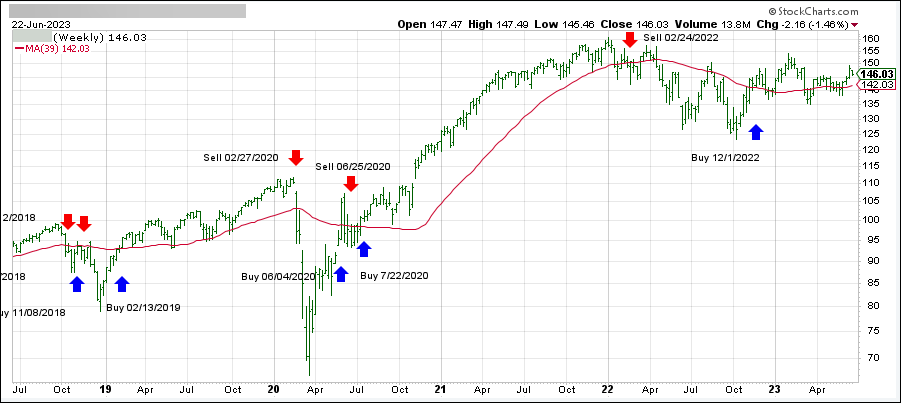
DOMESTIC EQUITY ETFs: BUY— since 12/01/2022
Click on chart to enlarge
This is our main compass, the Domestic Trend Tracking Index (TTI-green line in the above chart). It has now broken above its long-term trend line (red) by +2.69% and remains in “Buy” mode.
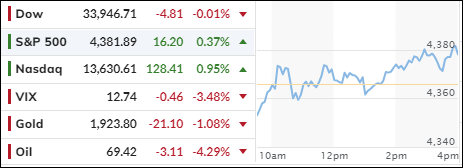
The stock market was a rollercoaster ride yesterday, with the S&P 500 and Nasdaq barely ending in the green after a three-day losing streak. The culprit? Fed chair Powell’s hawkish comments on more rate hikes to tame inflation.
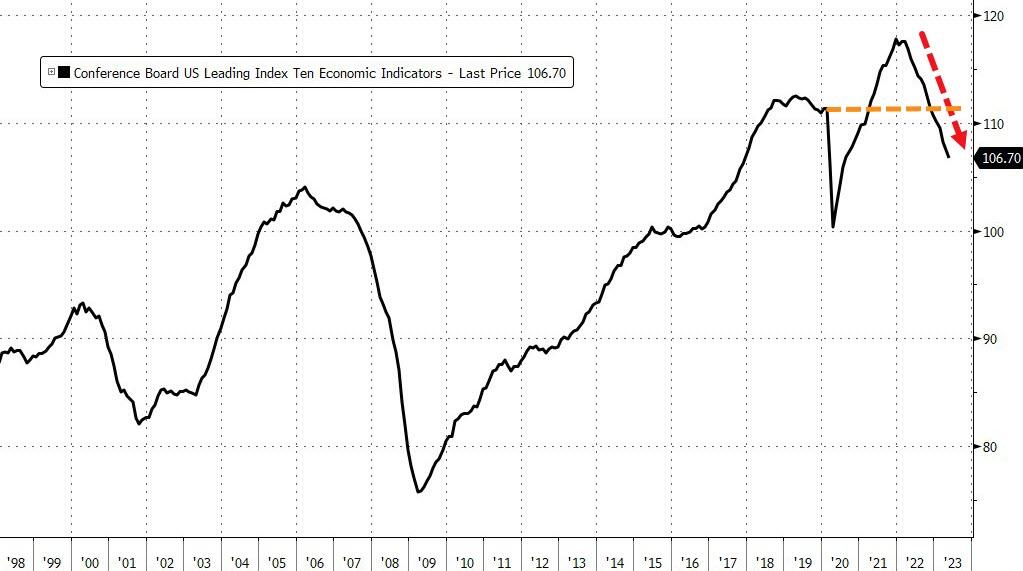
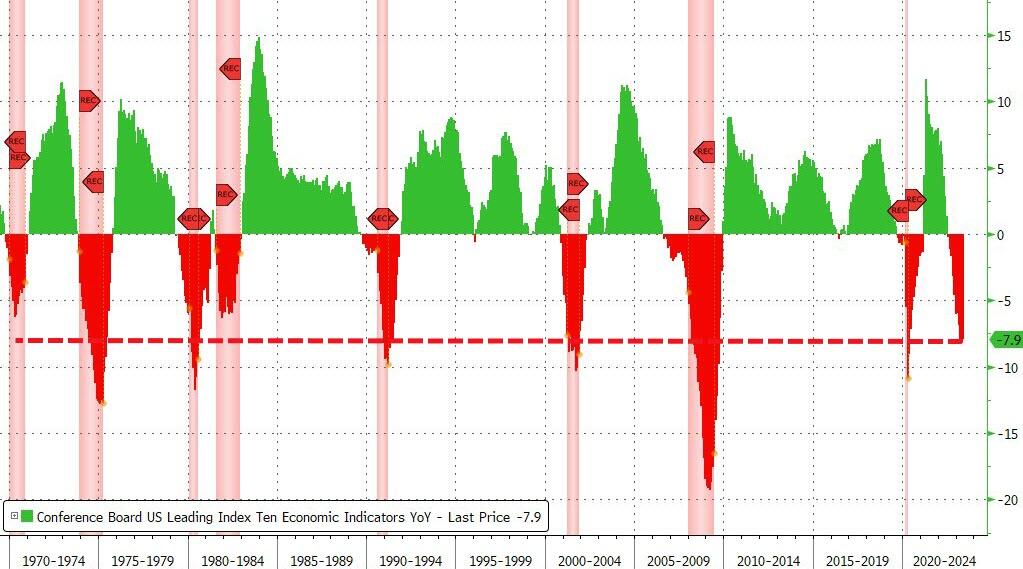
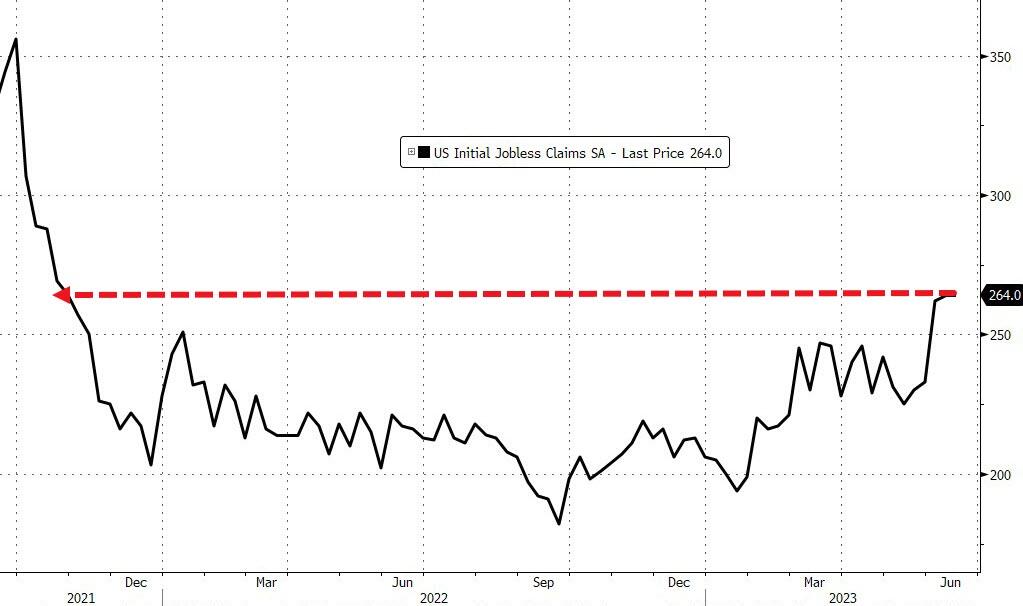
The economic outlook was also gloomy, with the US Leading Economic Indicator (LEI) dropping for the 14th consecutive month, signaling weaker activity ahead. The LEI plunged 7.9% year over year, close to its worst decline since 2008.
Across the pond, the Bank of England (BoE) shocked the markets with a 50-bps rate hike to fight their soaring inflation. Exchequer Jeremy Hunt said that “bringing inflation down is our absolute priority.”
That sounds familiar, doesn’t it? But US traders and algos seem to ignore Powell and keep buying stocks in the hope of lower rates.
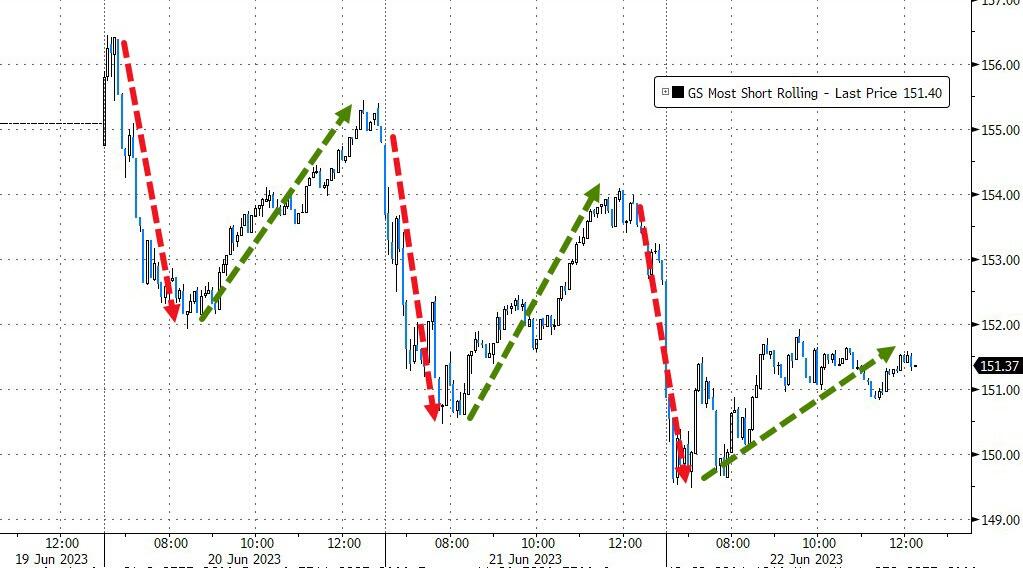
The only thing that saved the day was a short squeeze, which lacked conviction but managed to lift two of the three major indexes into positive territory.
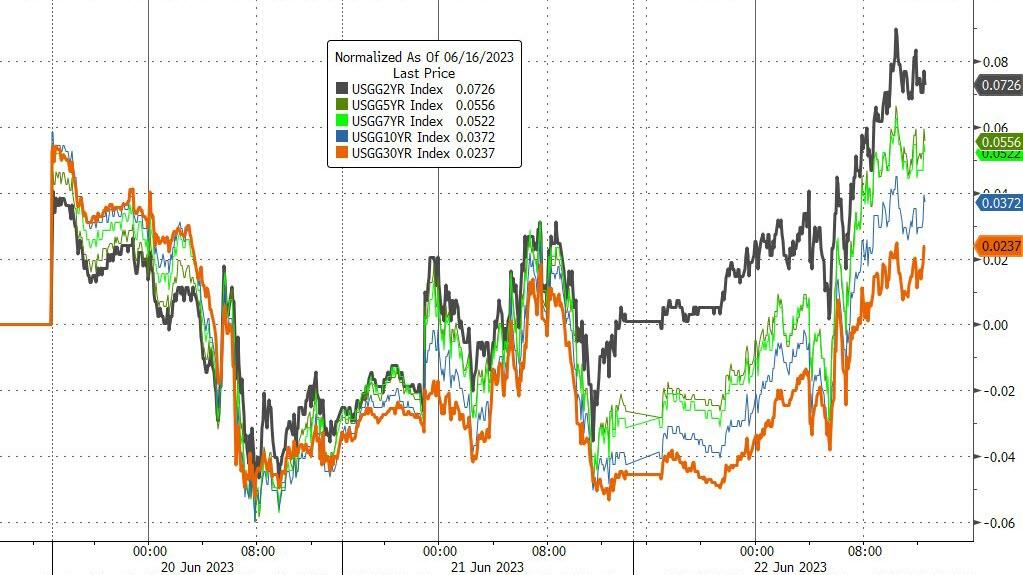
Banks continued to slide, bond yields rose, boosting the dollar and hurting gold, which sank to 3-month lows.
If you’re confused by all this market madness, you’re not alone. Cartoonist Bob Mankoff summed it up for you in this hilarious illustration:
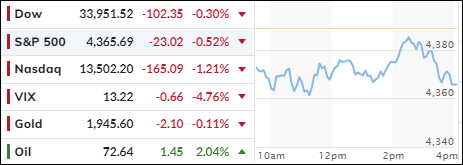
Fed chair Powell testified before congress today, reiterating his stance that inflation is still high and that interest rates will likely rise by the end of the year. He also expressed confidence in the resilience of the U.S. banking system, despite the headwinds from the pandemic and supply chain disruptions.
However, his words did not seem to sway the market sentiment, as Wall Street traders and algos continued to bet on a dovish Fed that will support the ongoing rally. The S&P 500 closed slightly lower for the fourth consecutive session, after an early sell-off and a midday rebound.
Inflation remains the top concern for many consumers and businesses, as real wages have been negative for 26 months in a row. The latest data shows that inflation is outpacing any wage gains, eroding the purchasing power of Americans.
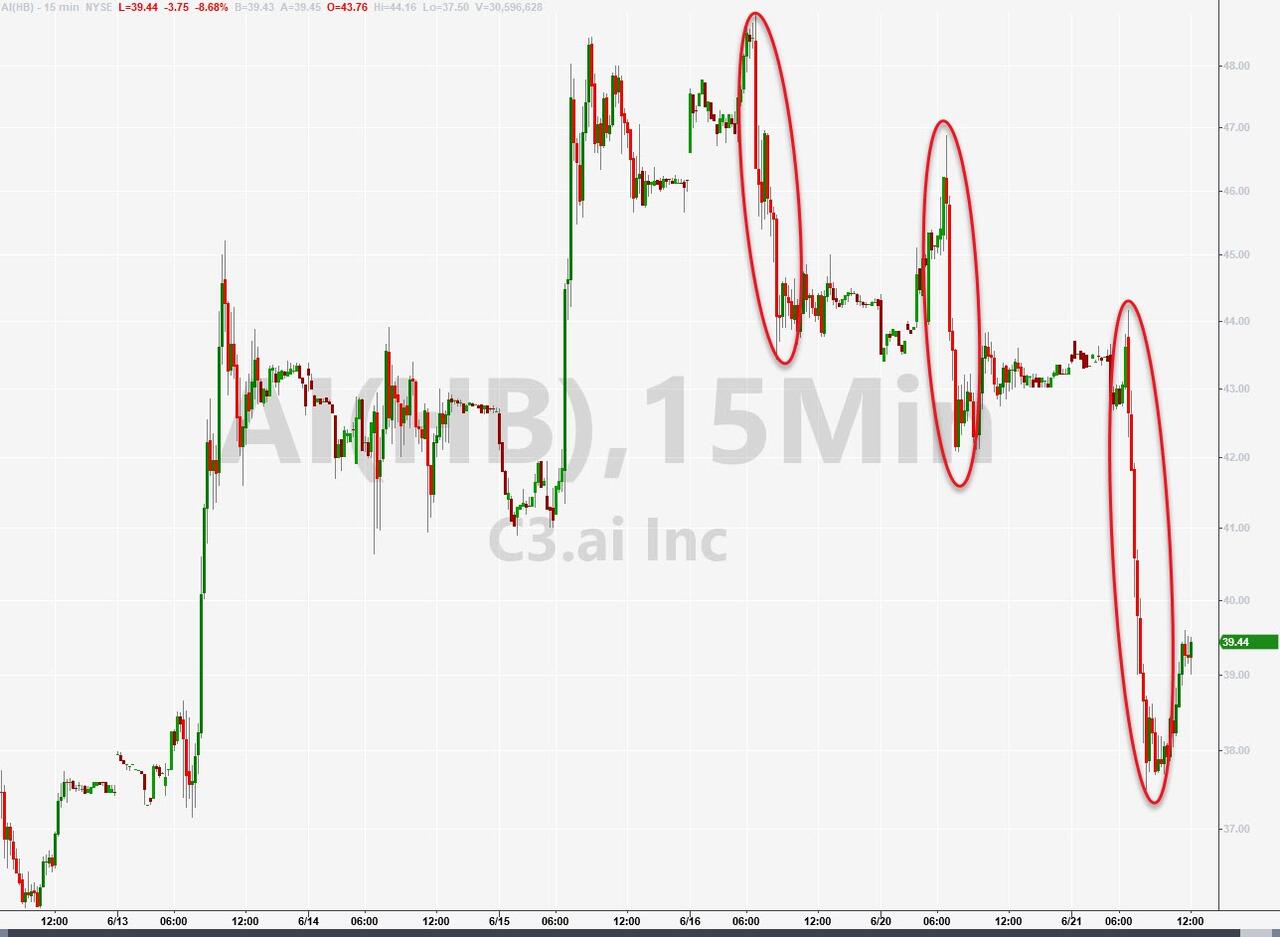
Moreover, the market rally has been driven by a narrow group of tech giants, known as the Big A.I. (AAPL, MSFT, GOOG, AMZN, TSLA, META, NVDA). Without them, the S&P 500 would have been almost flat year-to-date. This shows how uneven and fragile the market recovery has been.
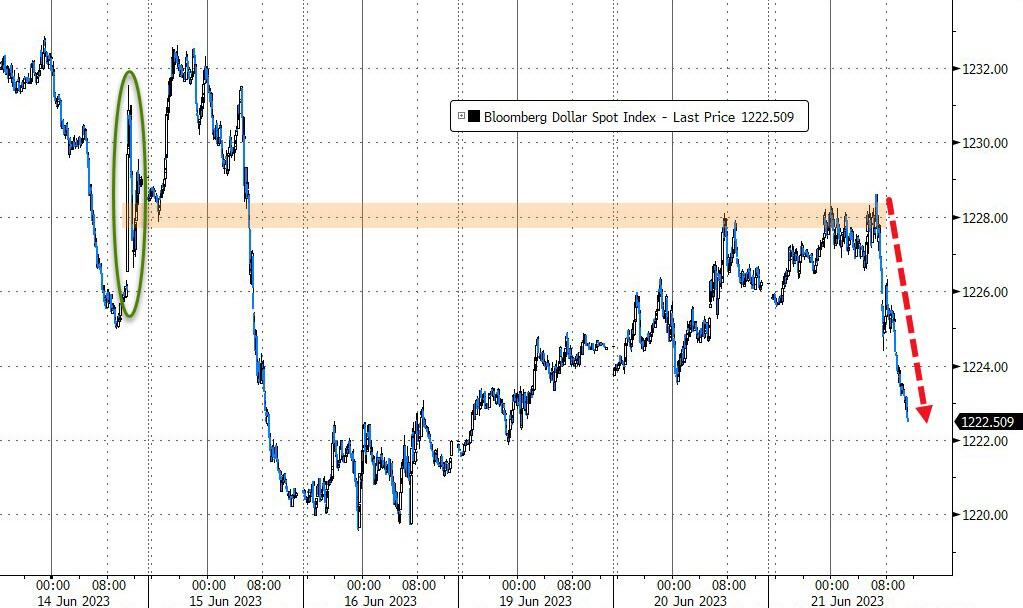
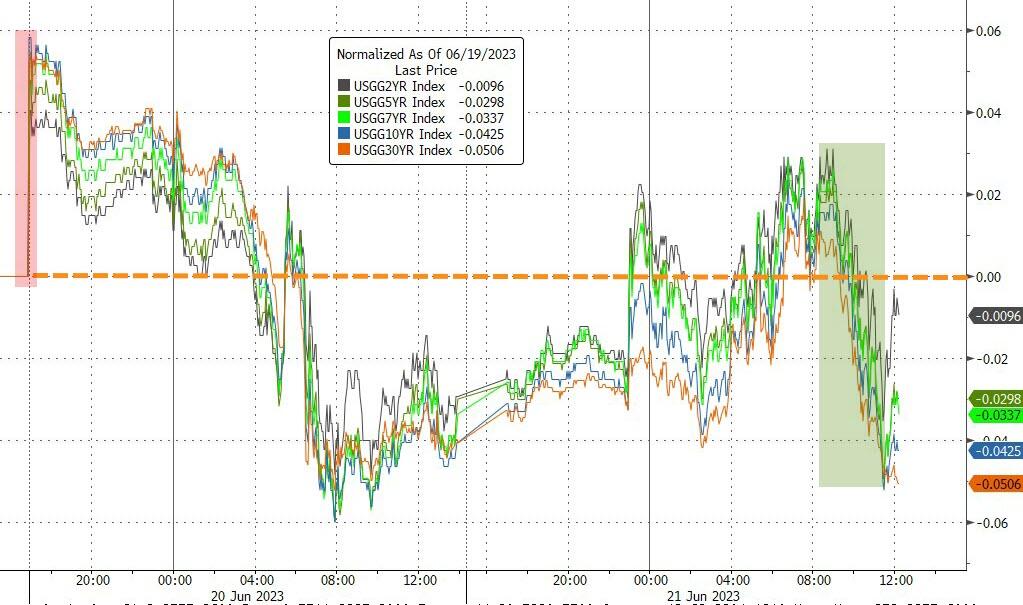
The US Dollar weakened, despite Powell’s hawkish tone, while bond yields fluctuated and ended up unchanged. Gold also recovered from a dip and closed flat. AI stocks fell again and gave up their recent gains.
Looking at the global picture, the U.S. economy seems to be holding up better than the Eurozone and China, which are facing more challenges from Covid-19 variants and slowing growth.
In summary, Powell’s testimony did not change much for the market outlook, as investors remain skeptical about the Fed’s ability and willingness to rein in inflation and normalize monetary policy.
The market rally is losing steam and becoming more concentrated on a few tech stocks, while inflation is hurting consumers and businesses alike.
Stocks took a dive early in the session, continuing from Friday’s slump, as they needed a break after the recent unstoppable climb to the highest levels in a year driven by the AI craze.
Suddenly, investors started to worry about paying too much for their shares, while analysts struggled to find convincing reasons for the markets to keep going up. But they managed to recover some of their losses later in the session.
After all, the Fed’s hawkish stance, despite last week’s pause, and plenty of gloomy data points, will have an impact on where the markets go next. Recession or not, if any data shows signs of inflation, more rate hikes will be inevitable.
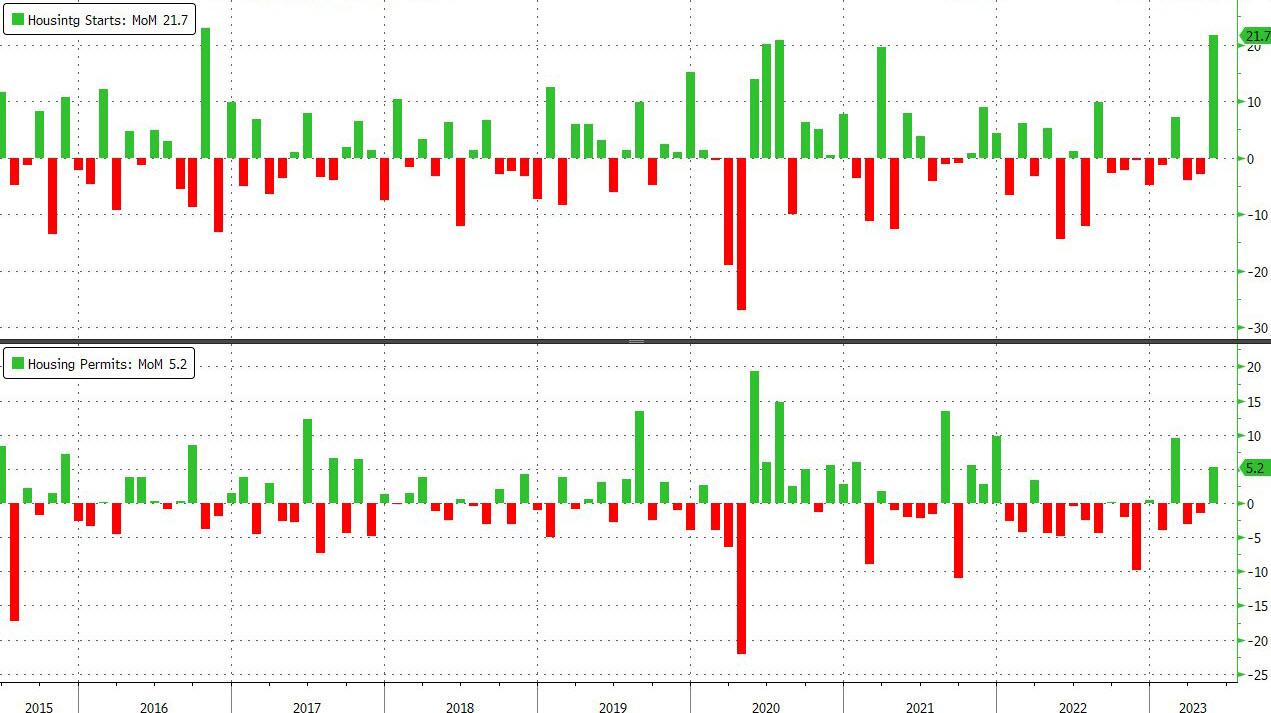
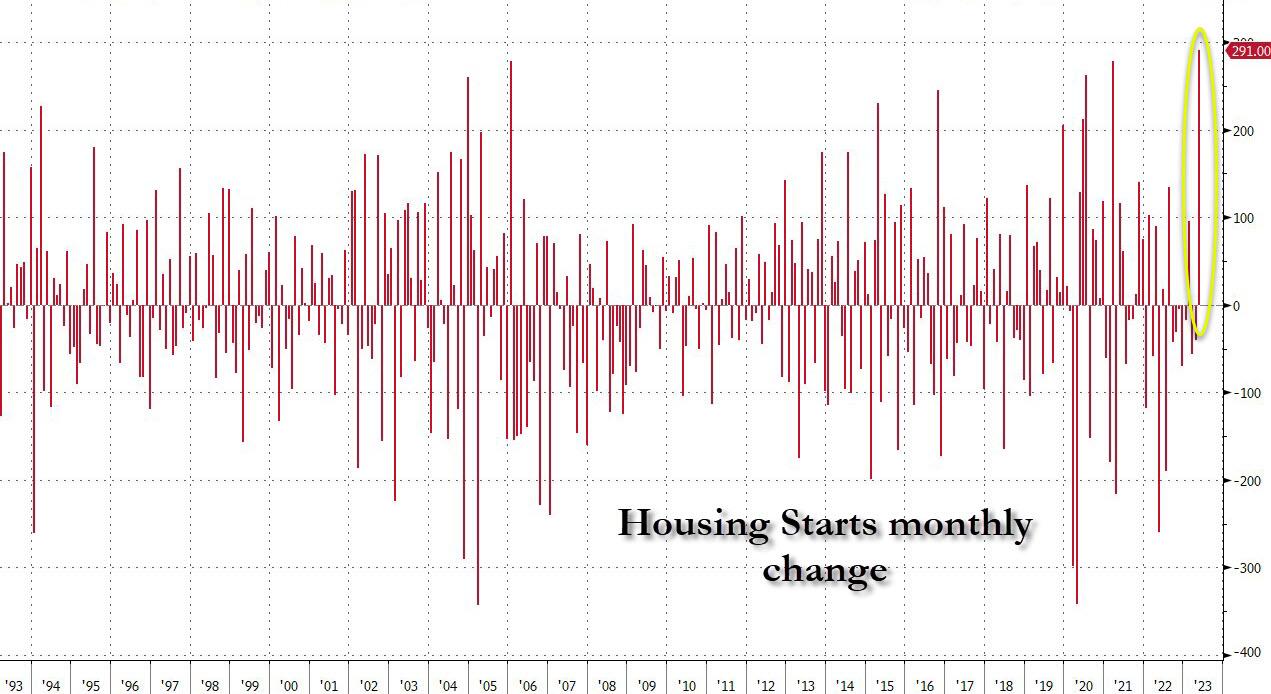
The Fed might not be happy with today’s shocking Housing Starts data, which showed the biggest monthly jump on record, as ZeroHedge pointed out. The 291k increase was the biggest percentage rise since October 2016. I’ll wait for the downward revisions before I believe it.
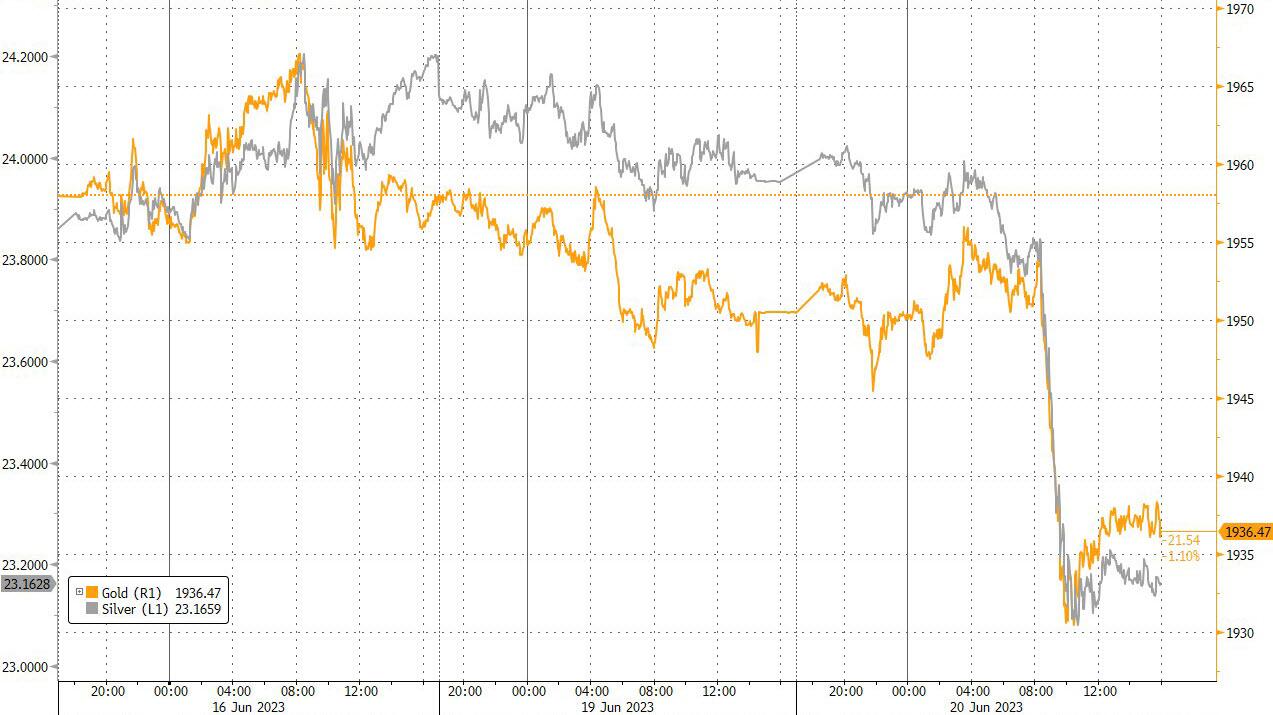
I guess the Fed’s pause was based on the idea of a weakening economy, so this positive “surprise” might change their mind. The unexpected strength in housing data hurt the precious metals, which fell to one-week lows. Bond yields dropped giving bond holders something to smile about.
In the end what matters is this question:
Are the markets so overpriced that a correction is now unavoidable, or is there enough juice left in the AI machine to push stocks to even more unrealistic valuations?


