
- Moving the markets
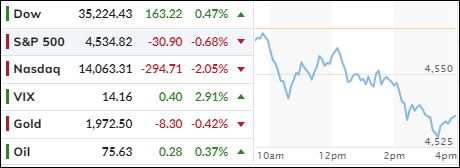
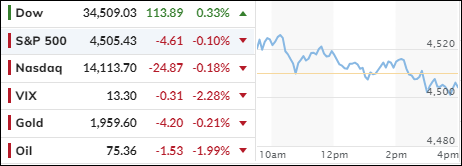
The Dow managed to squeeze out a tiny gain for the 9th day in a row, but the rest of the market was not so lucky. The S&P 500 fell, and the Nasdaq took a big hit.
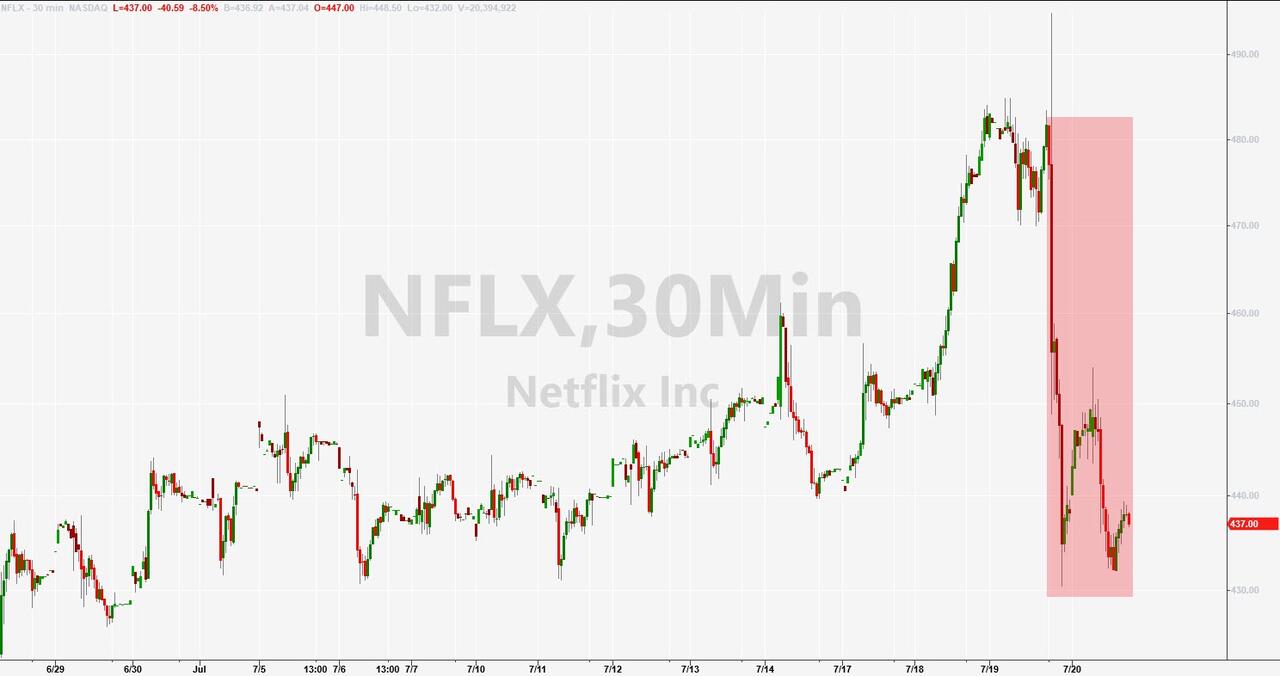
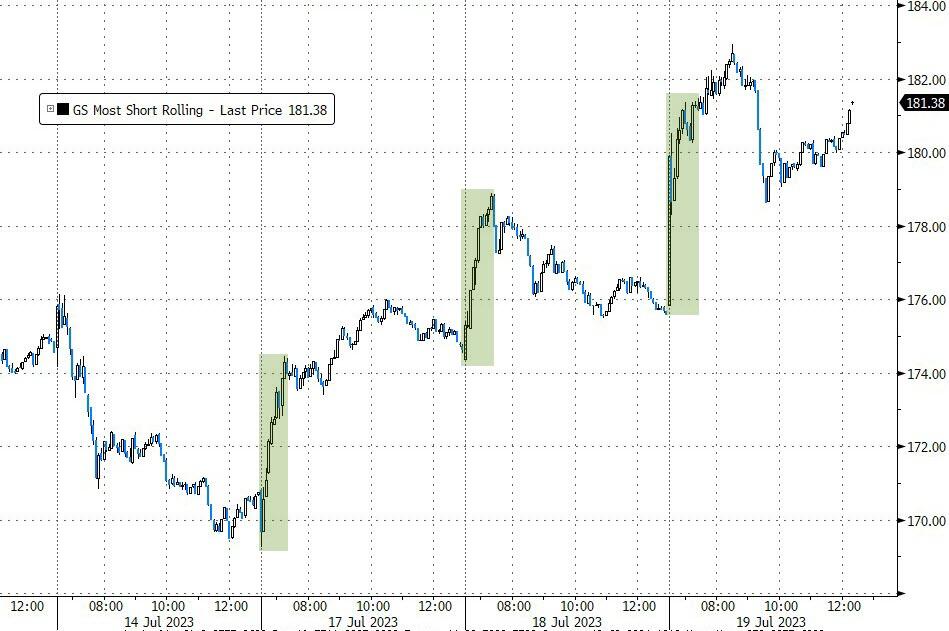
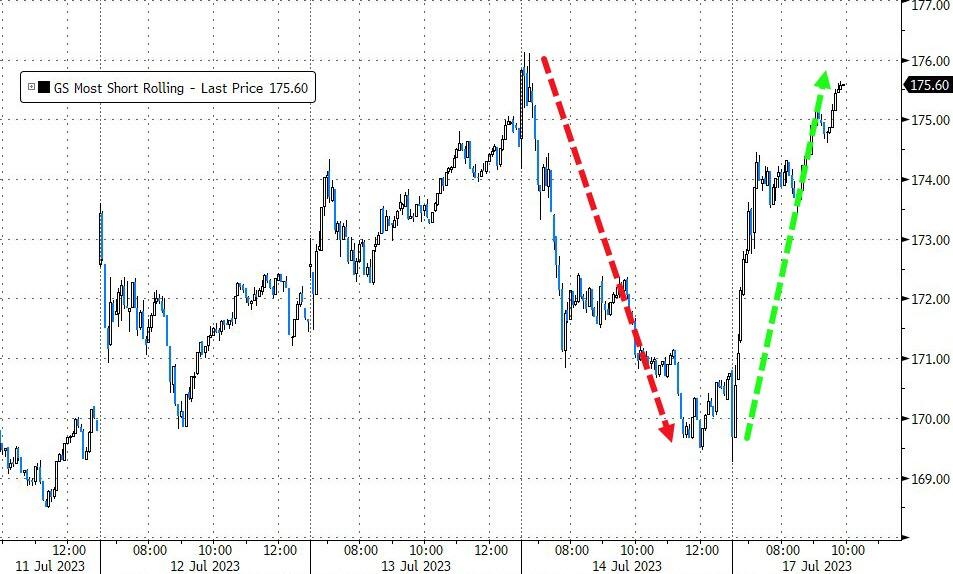
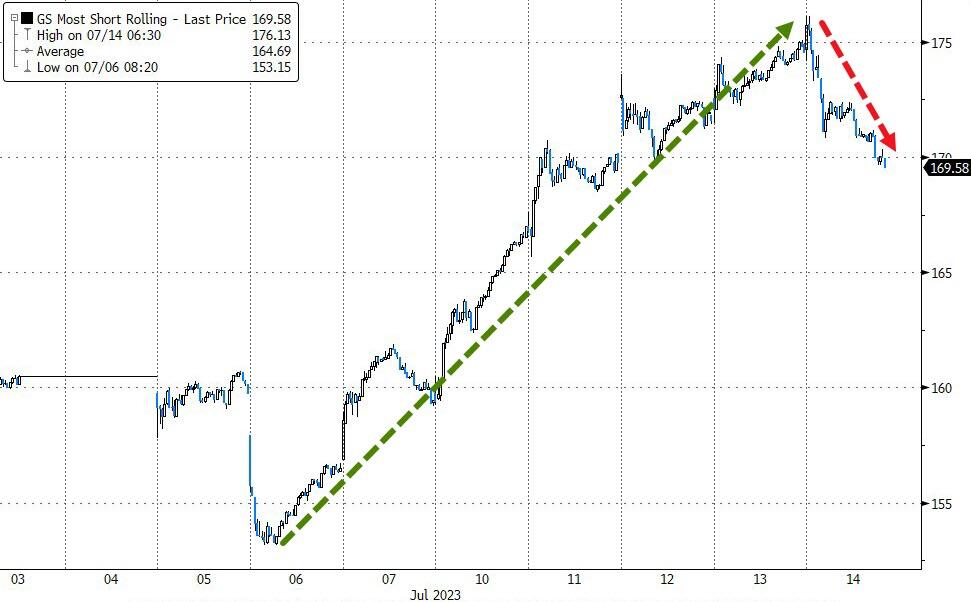
Johnson & Johnson’s strong earnings helped the Dow, but there was no sign of a short squeeze to boost the stock further. The market was weighed down by mixed earnings results, as Netflix lost 8% and Tesla dropped 9% due to production woes.
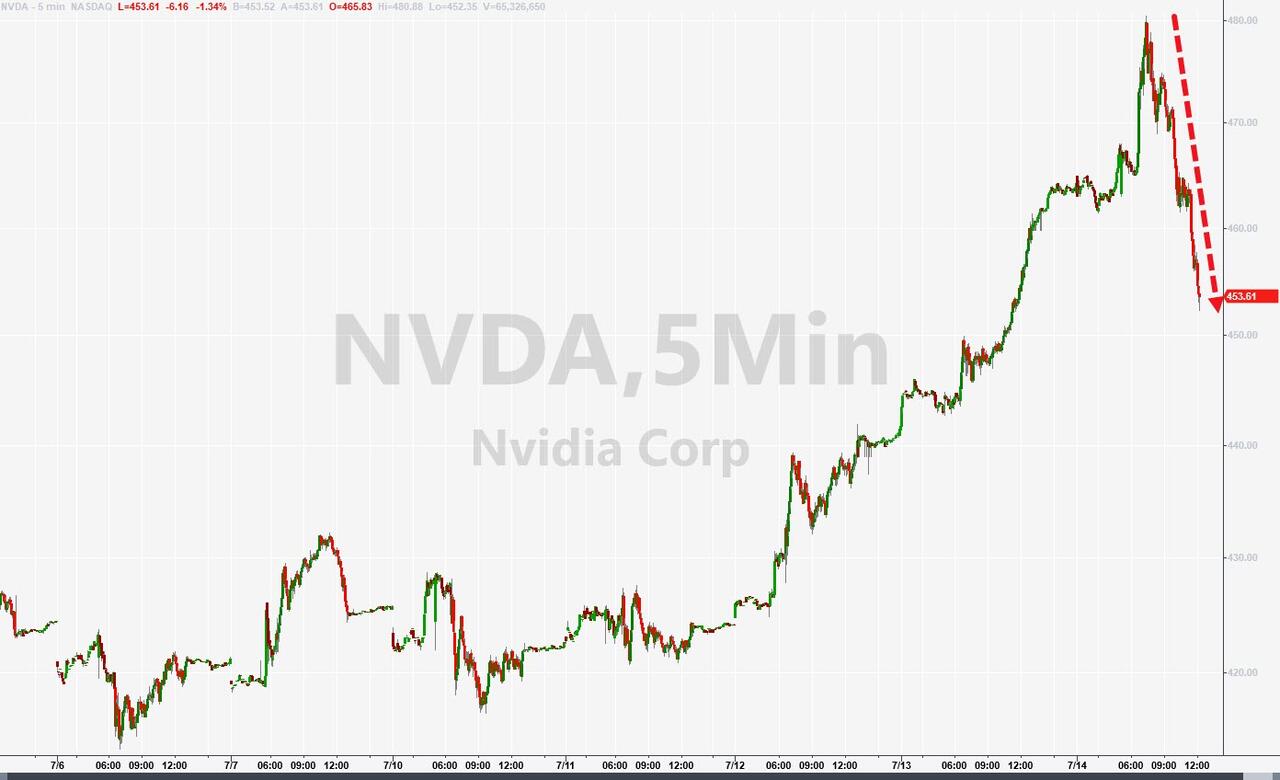
The Nasdaq also suffered from the news that Taiwan Semiconductor, the world’s biggest chipmaker, cut its revenue forecast for 2023 by half.
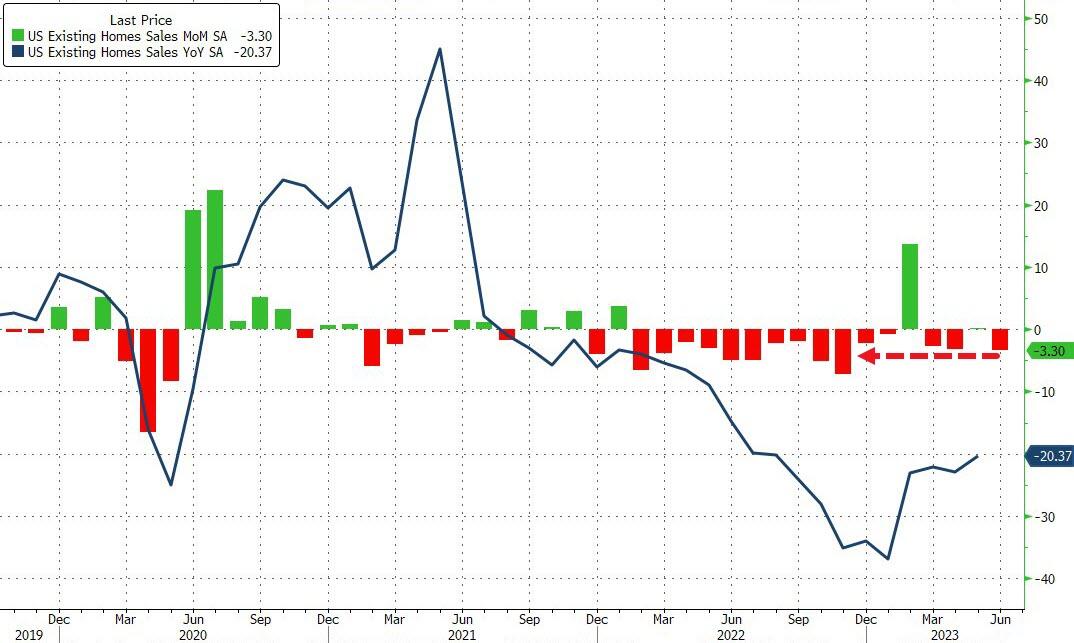
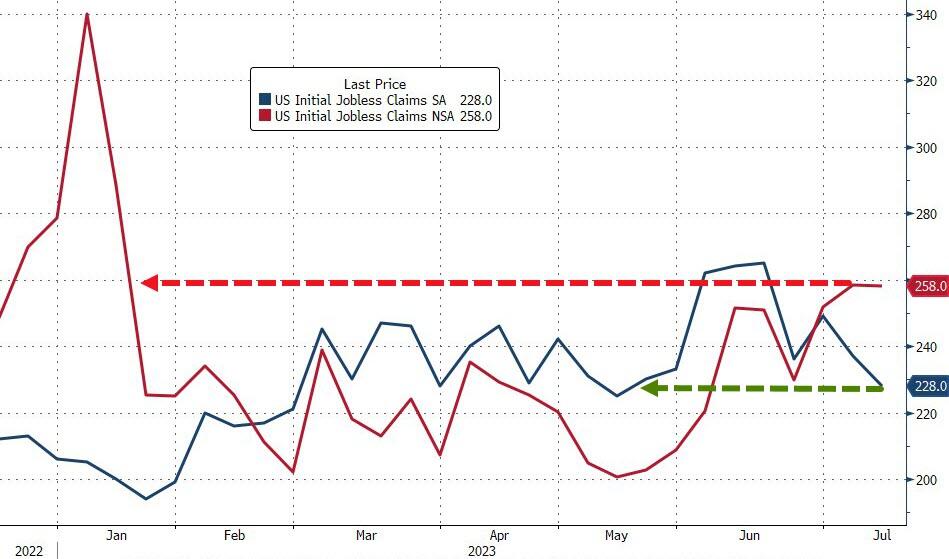
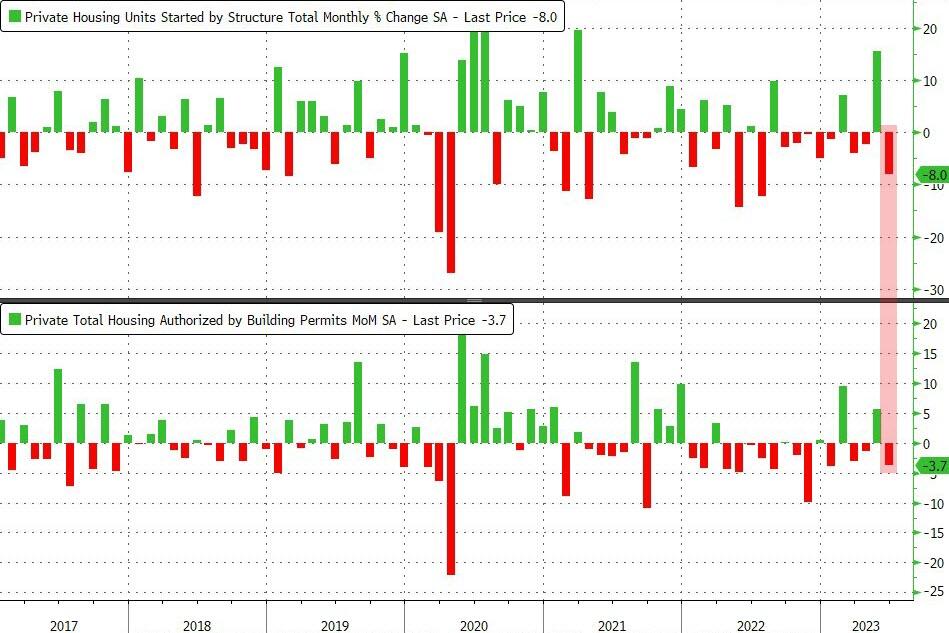
The economic news was not much better, as US home sales plunged in June, the Philly Fed index showed another month of shrinking manufacturing activity, and jobless claims rose to their highest level since January.
Commercial real estate continued to struggle, as another office tower in Baltimore was sold at a huge discount. This was not surprising, as many downtown buildings are losing tenants who prefer to work from home or elsewhere.
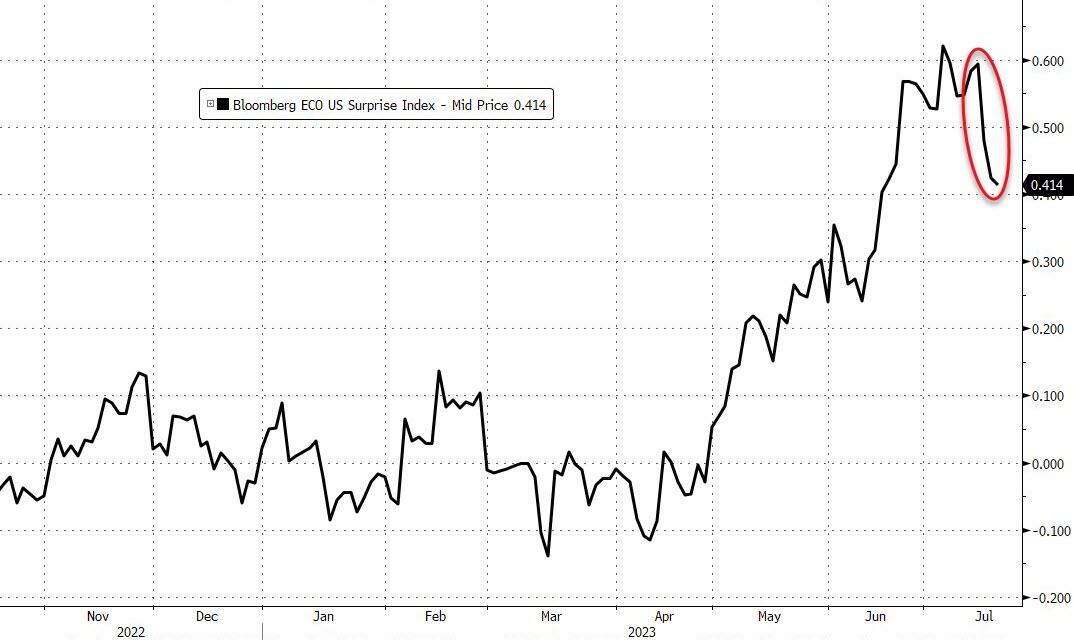
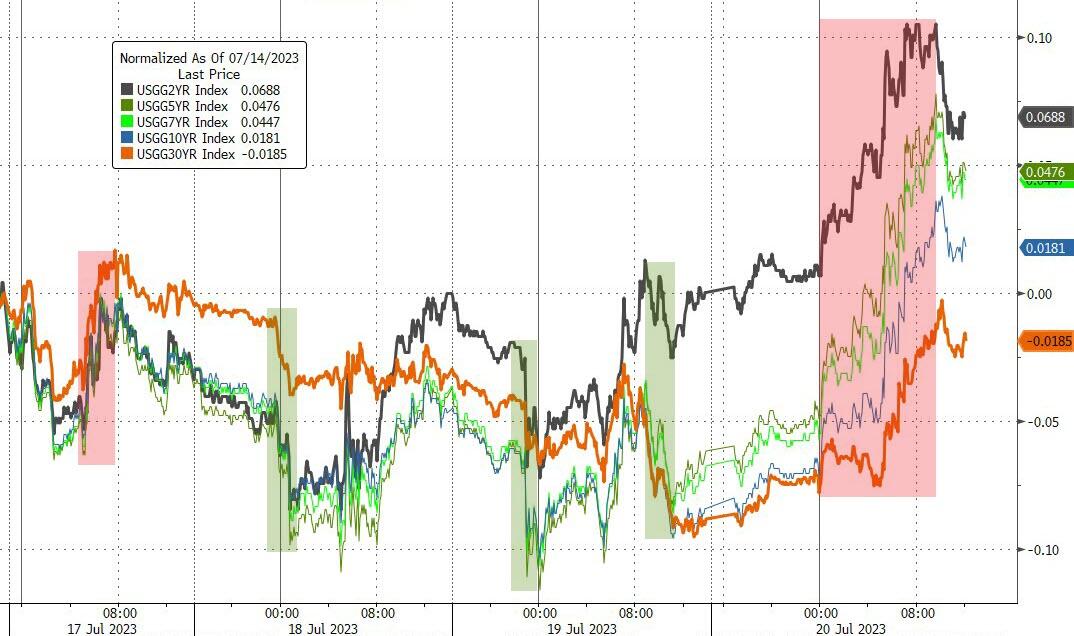
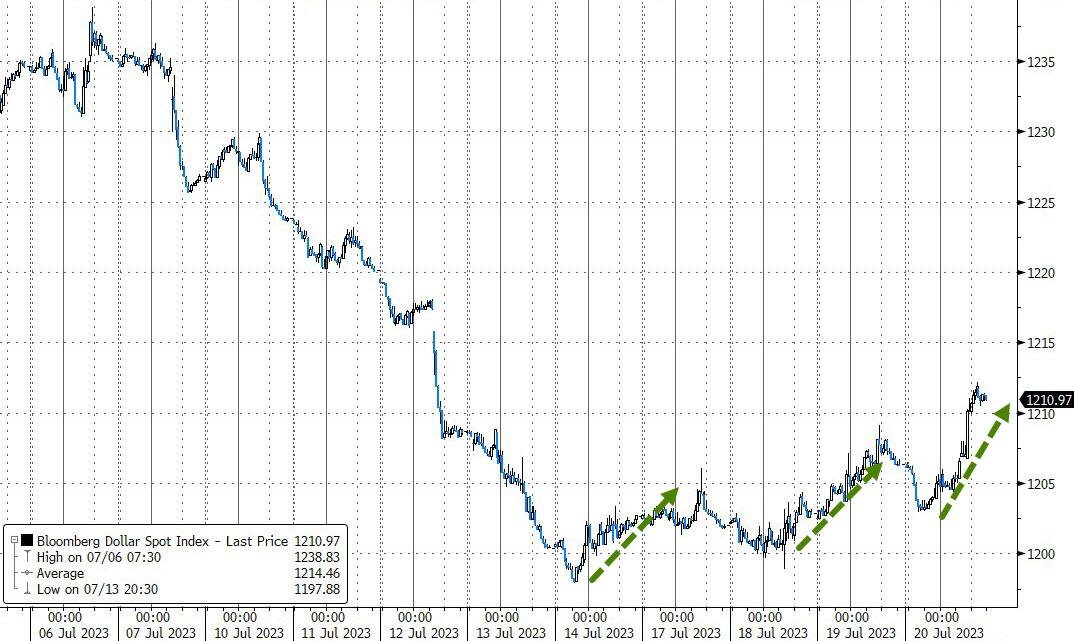
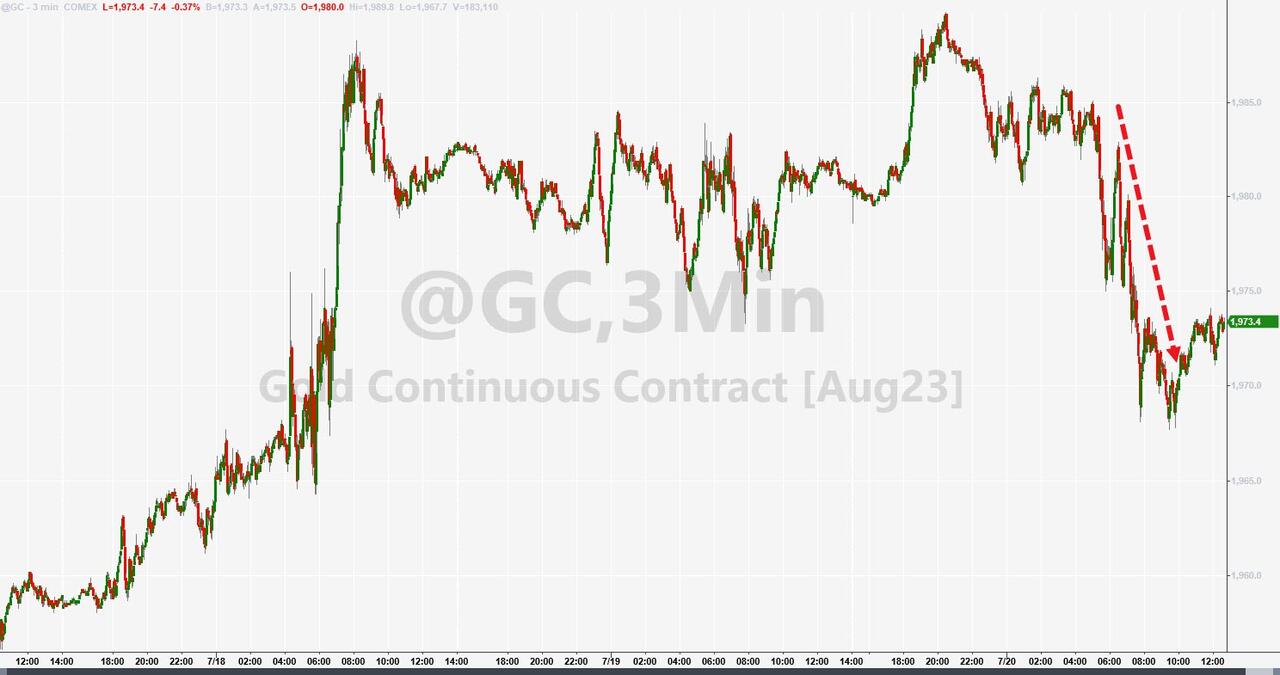
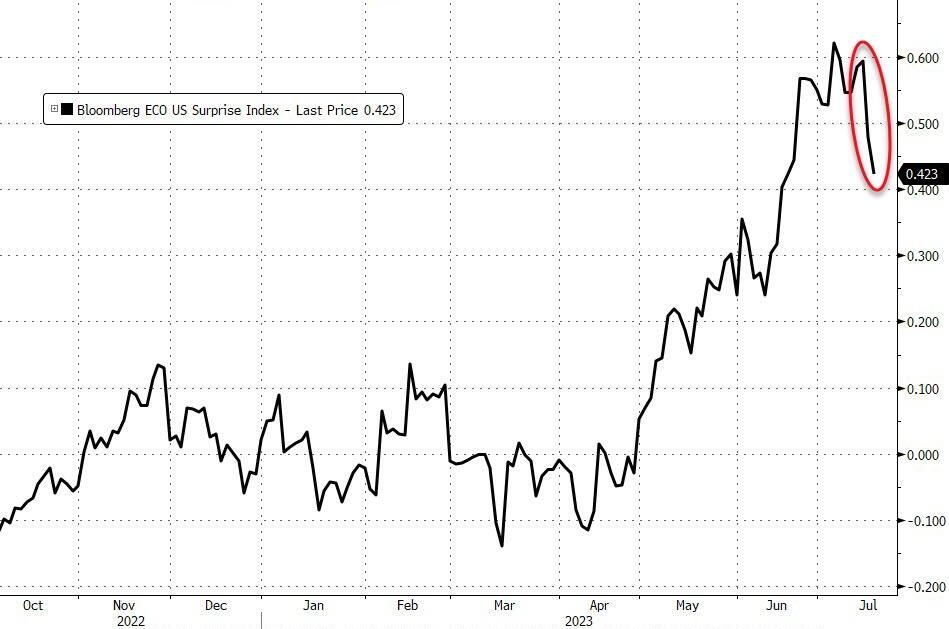
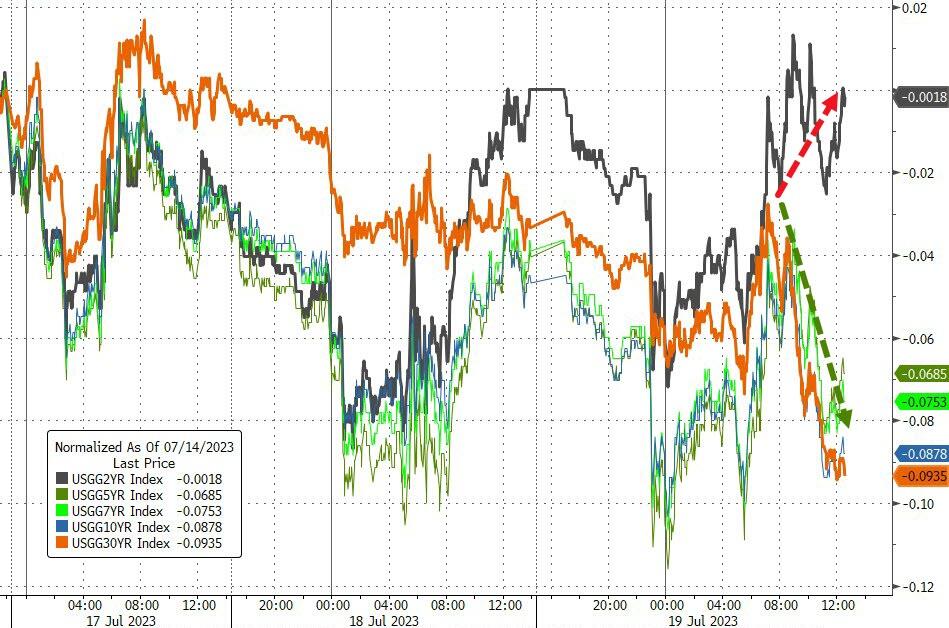
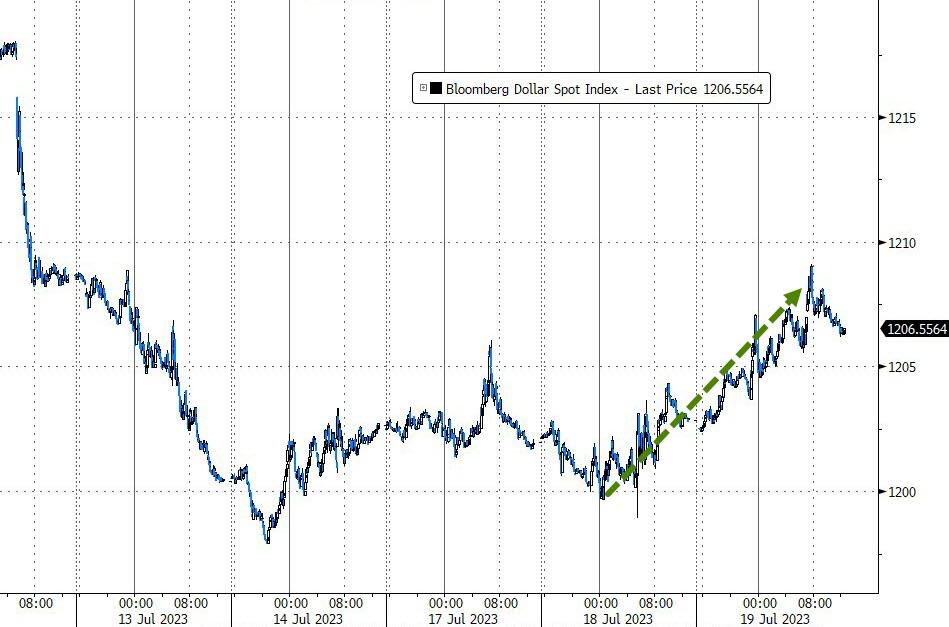
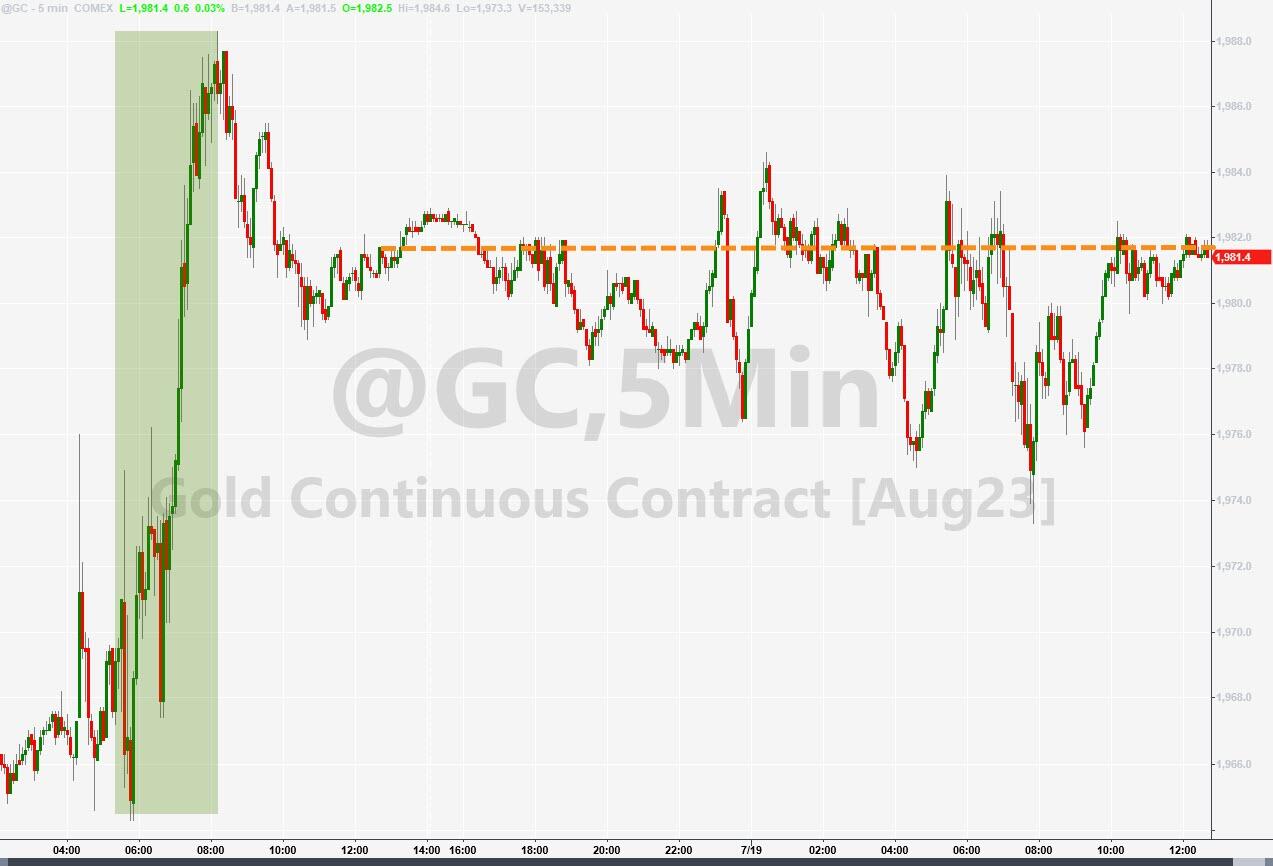
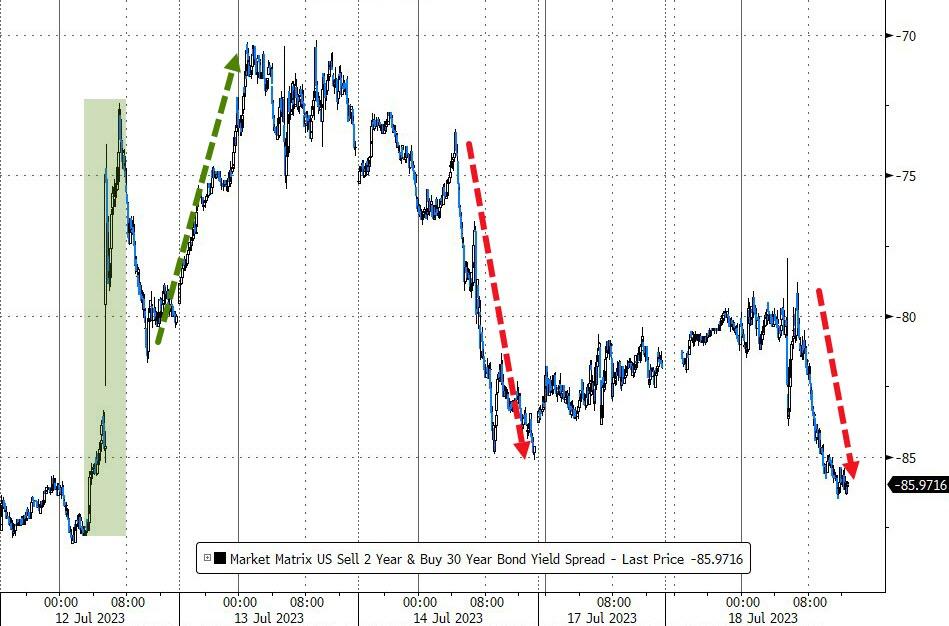
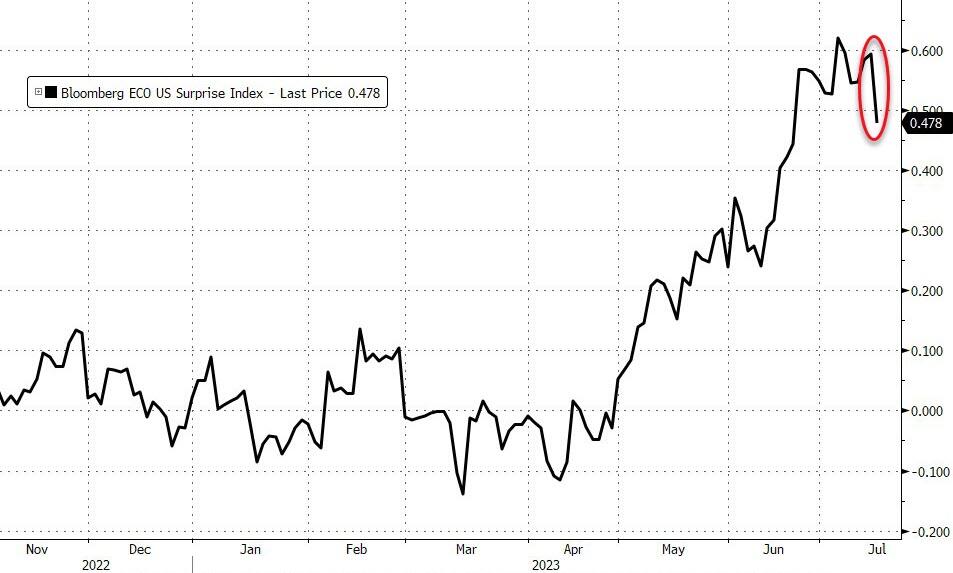
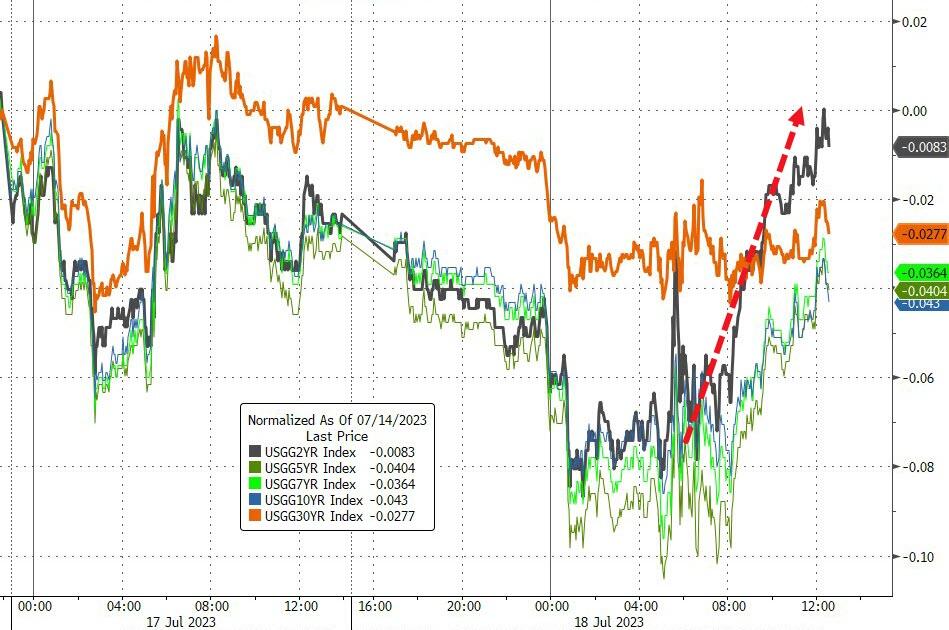
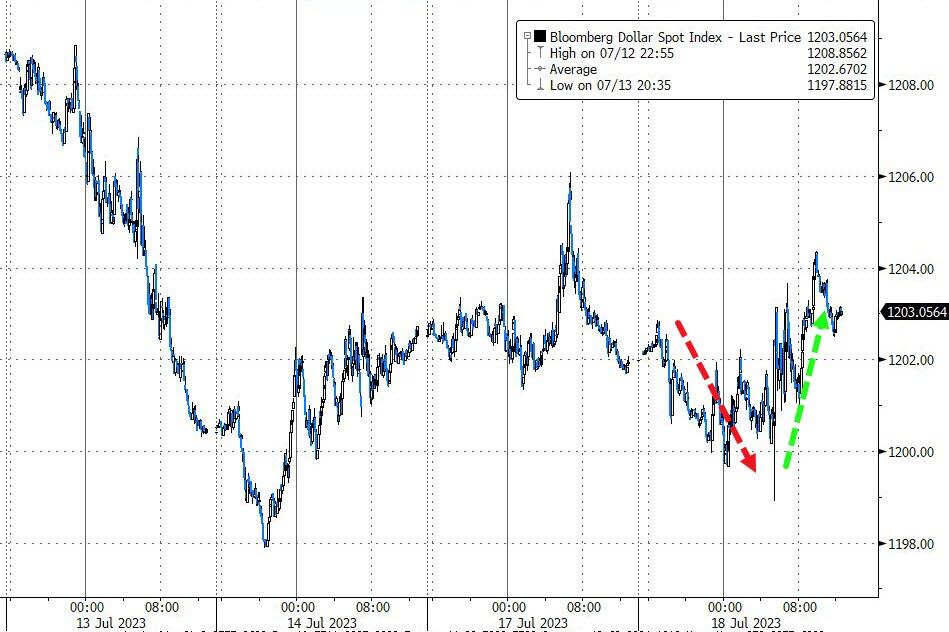
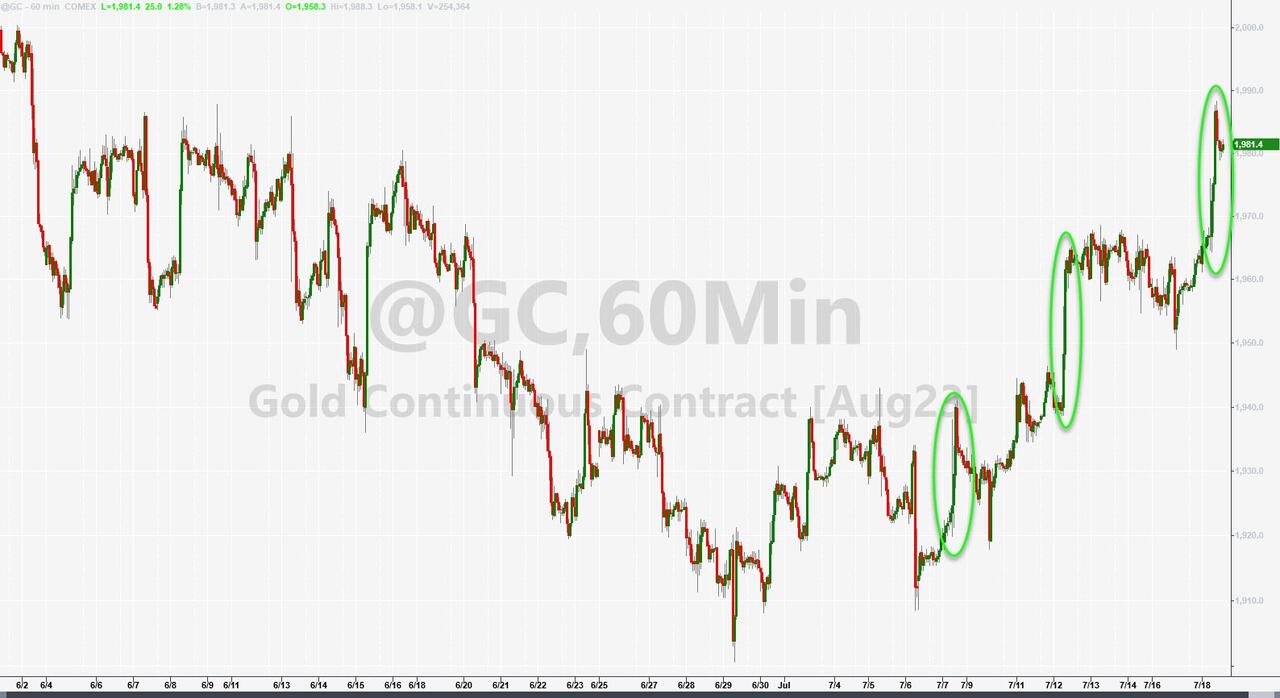
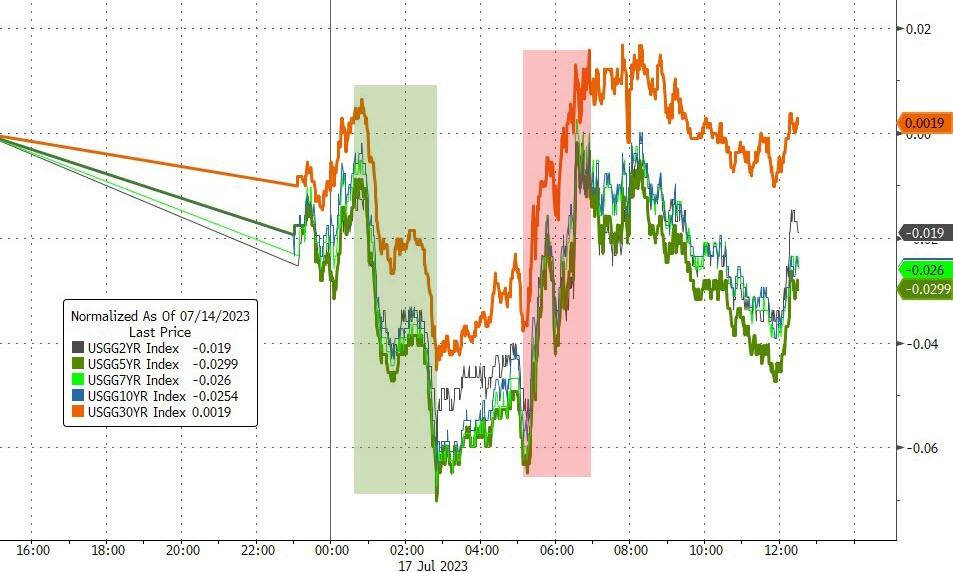
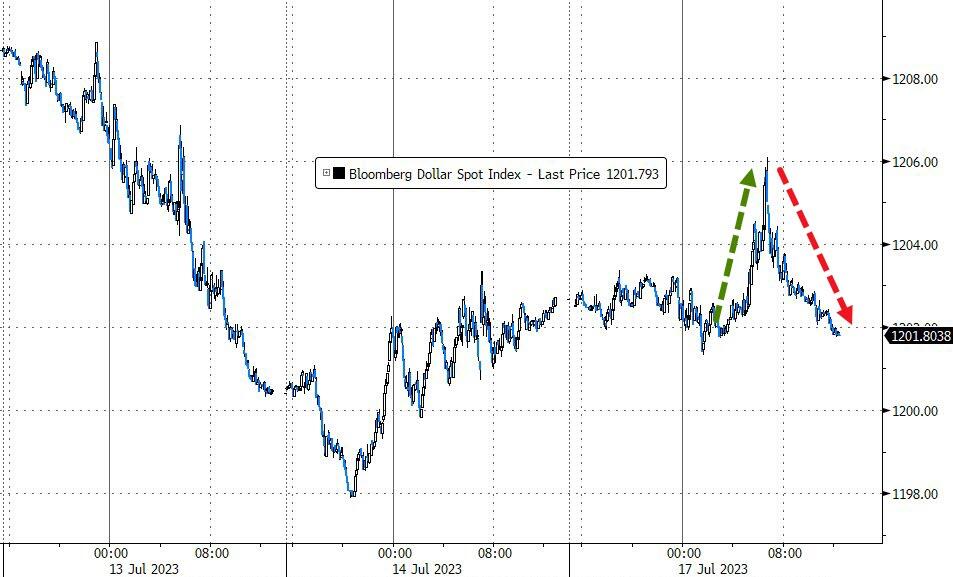
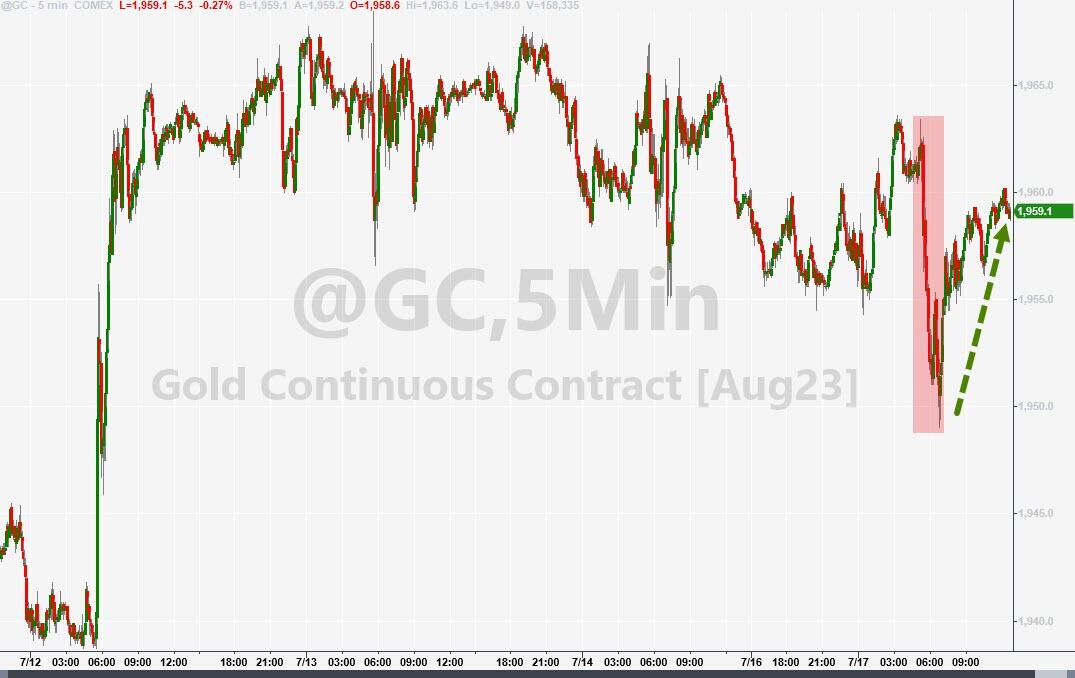
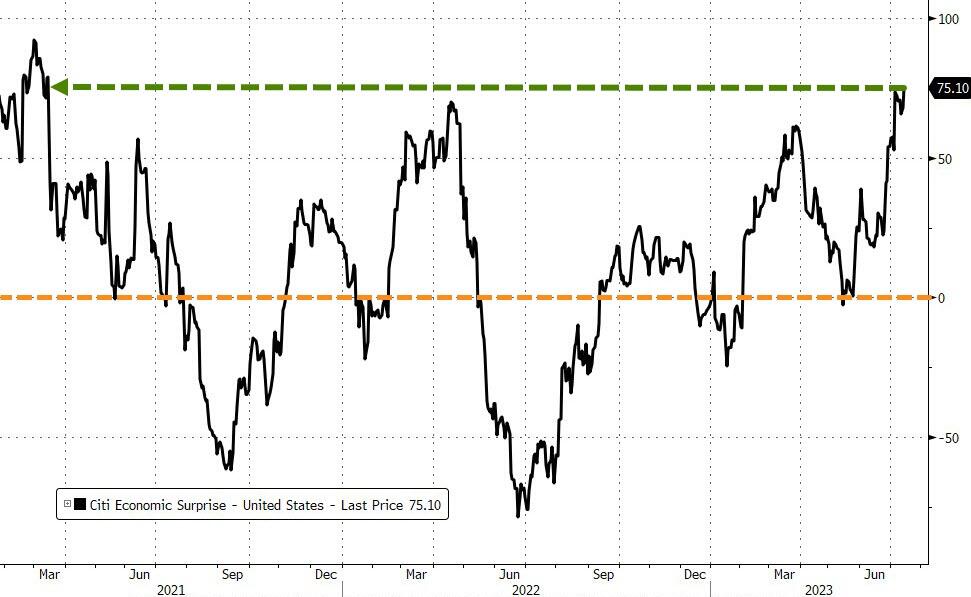
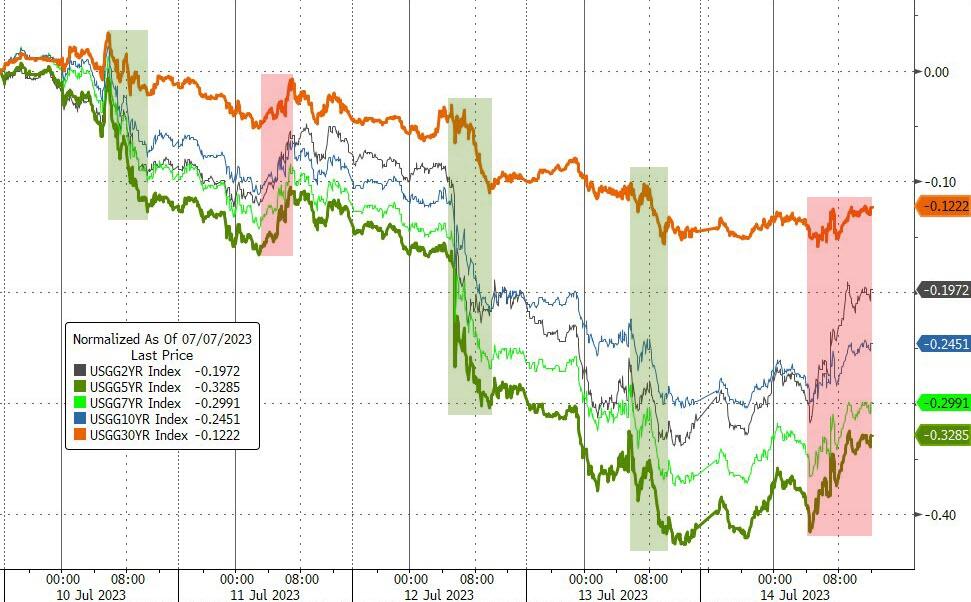
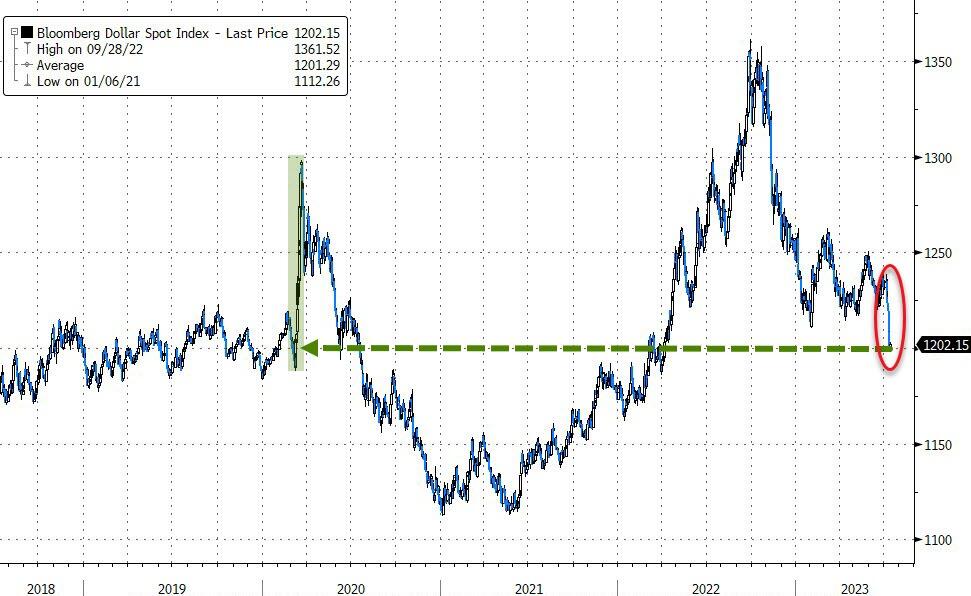
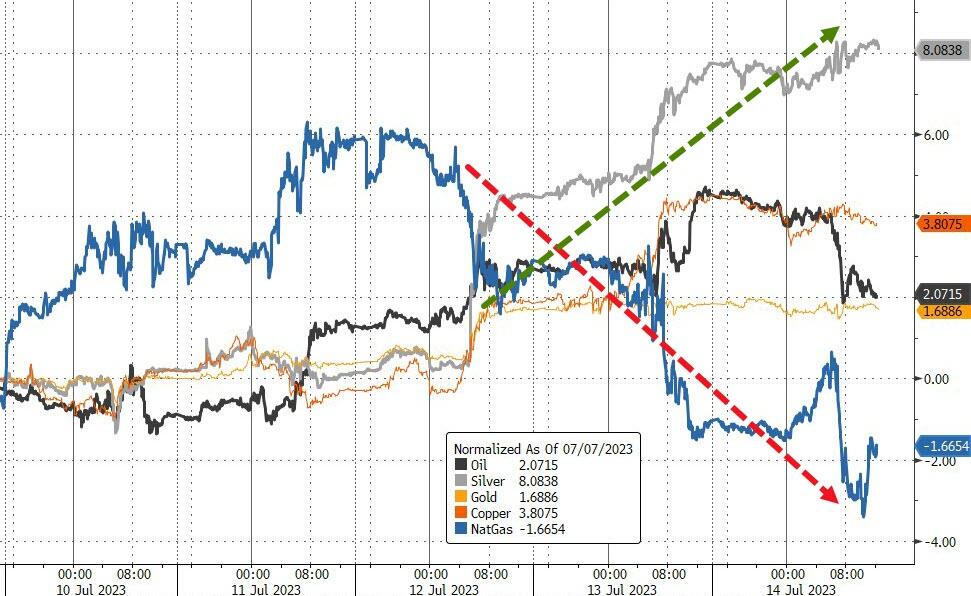
The Economic Surprise index fell again, while bond yields rose and lifted the dollar to a one-week high. Gold slipped but stayed above $1,970.
It seems like the market is ignoring the bad news and hoping for the best, but how long can this last?
Read More