

- Moving the markets
The market took a small but widespread dip today, as investors are facing a flood of earnings reports from 160 companies in the S&P 500. The mood was tense, but not hopeless, as most of the firms beat the low expectations that were set for them.
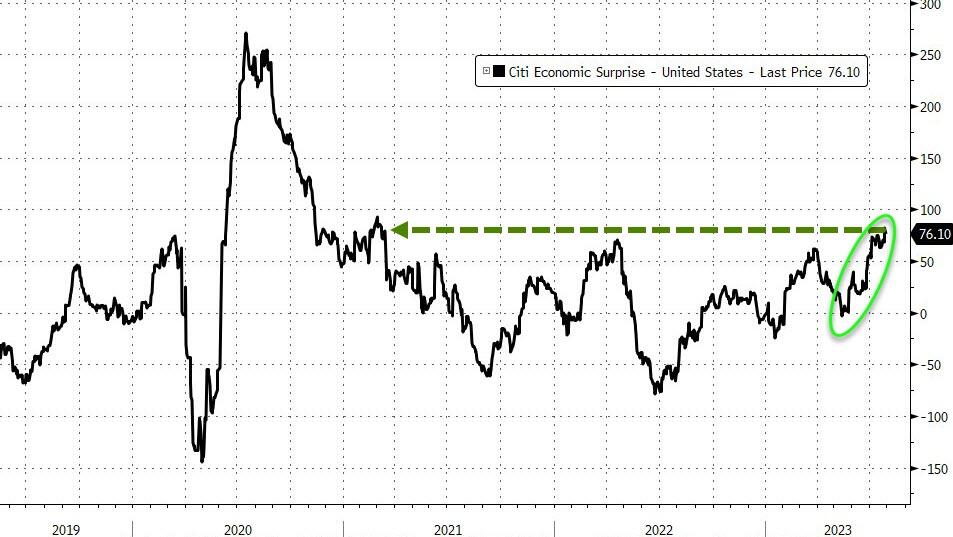
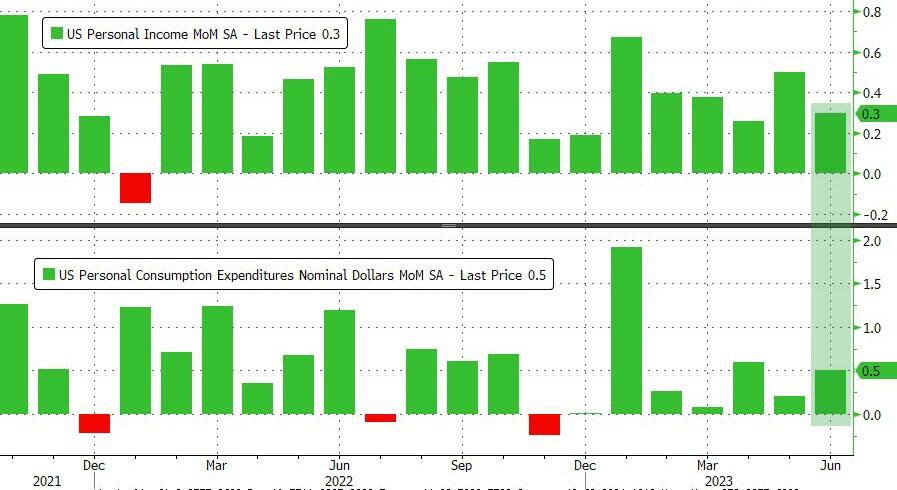
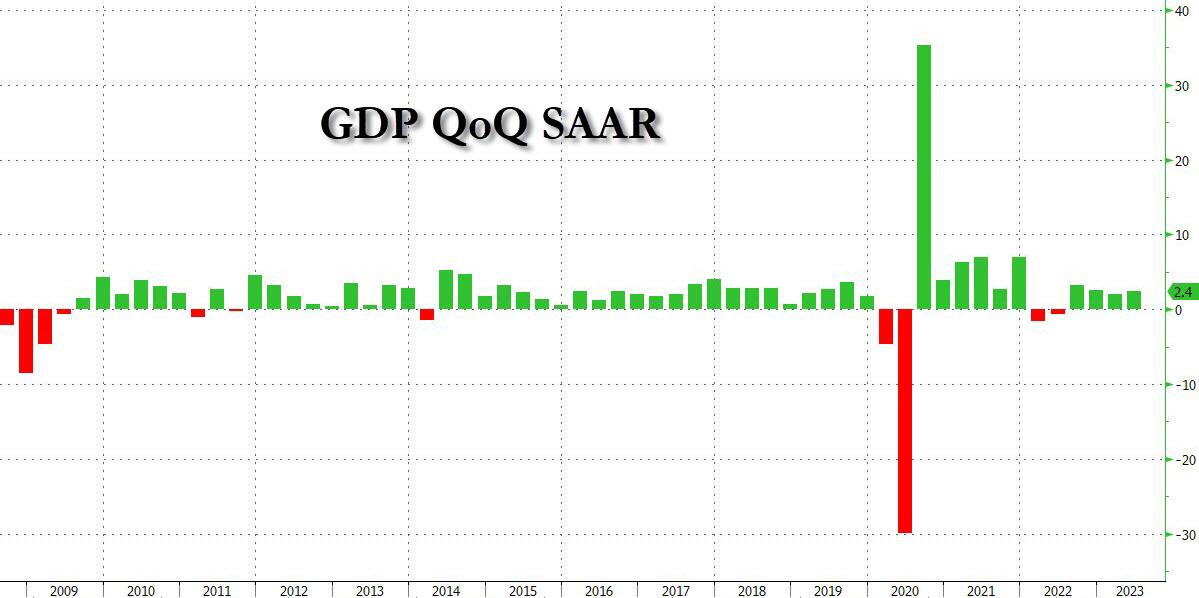
Some analysts think this means the economy can dodge a recession, even though they ignore the signs of inflation and uncertainty ahead.
According to FactSet, analysts still expect a 7.1% drop in earnings from a year ago, marking the third quarter in a row of shrinking profits. How does that square with the high stock prices we see today?
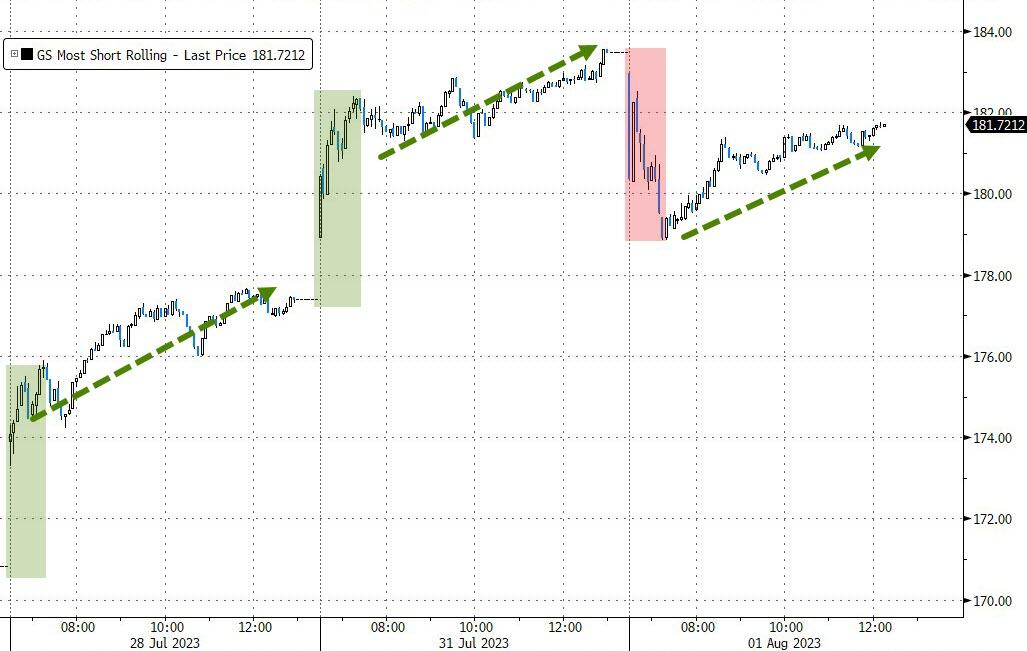
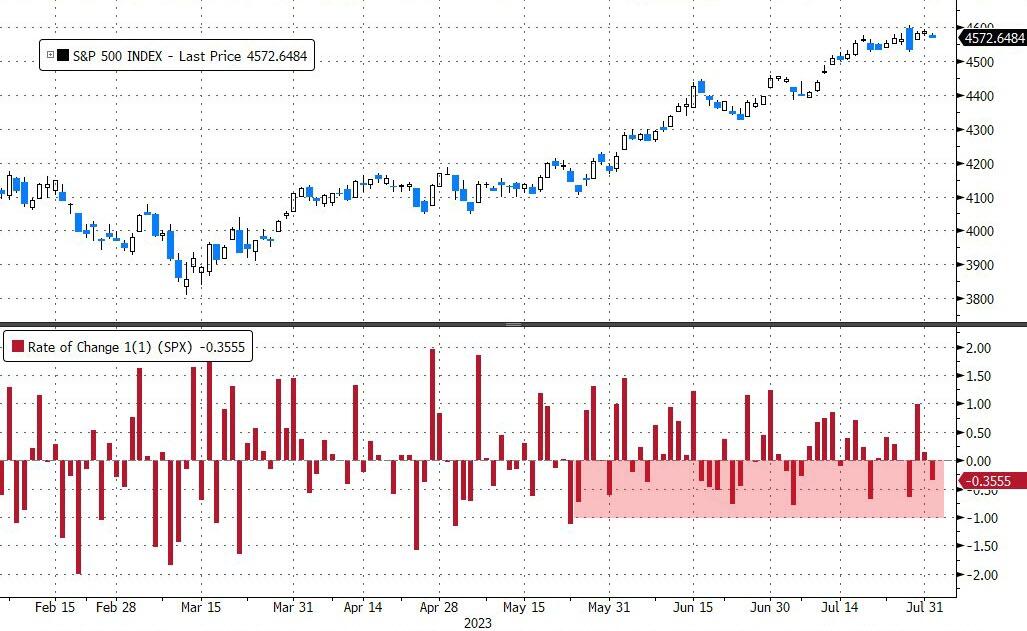
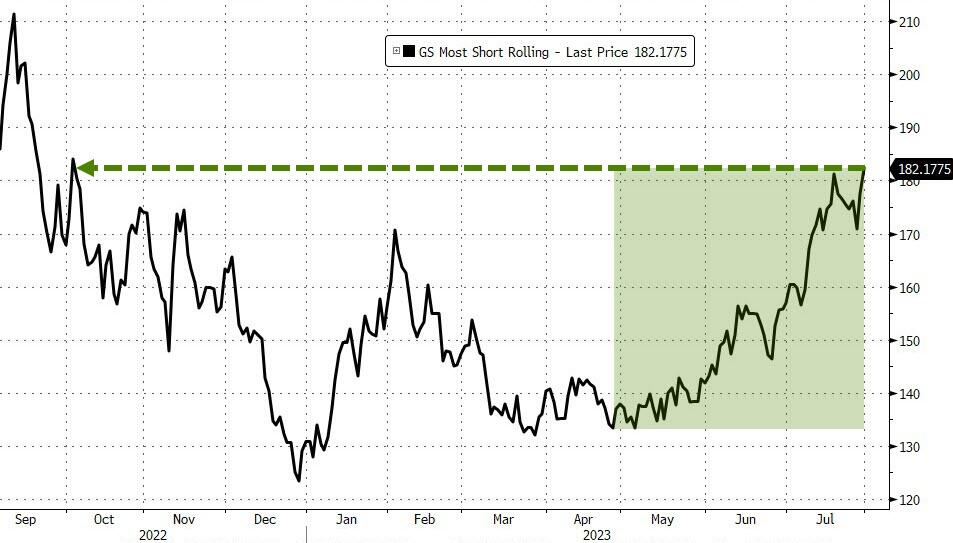
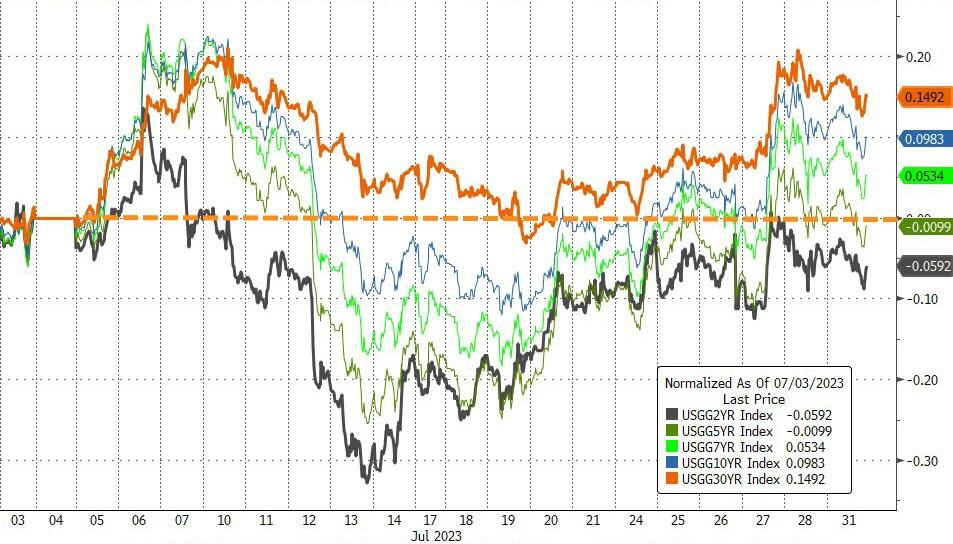
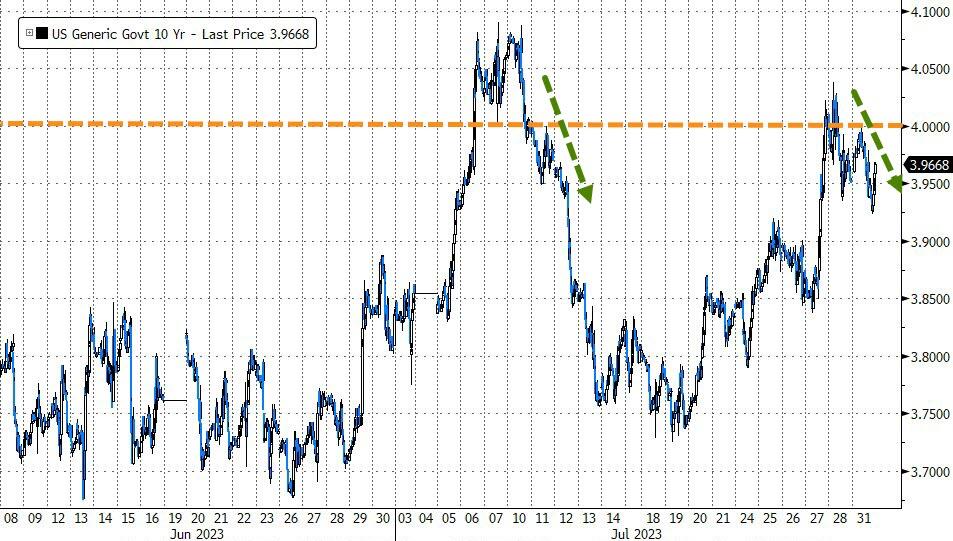
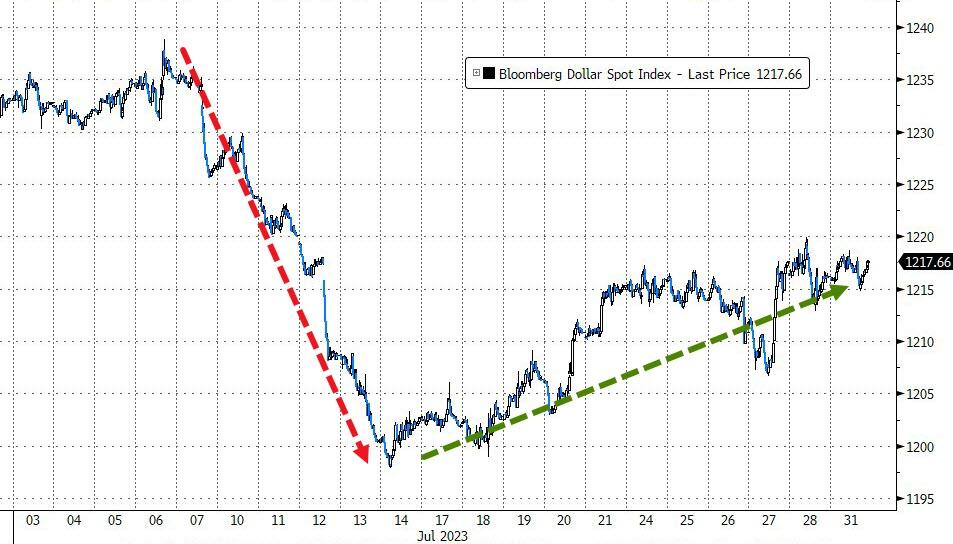
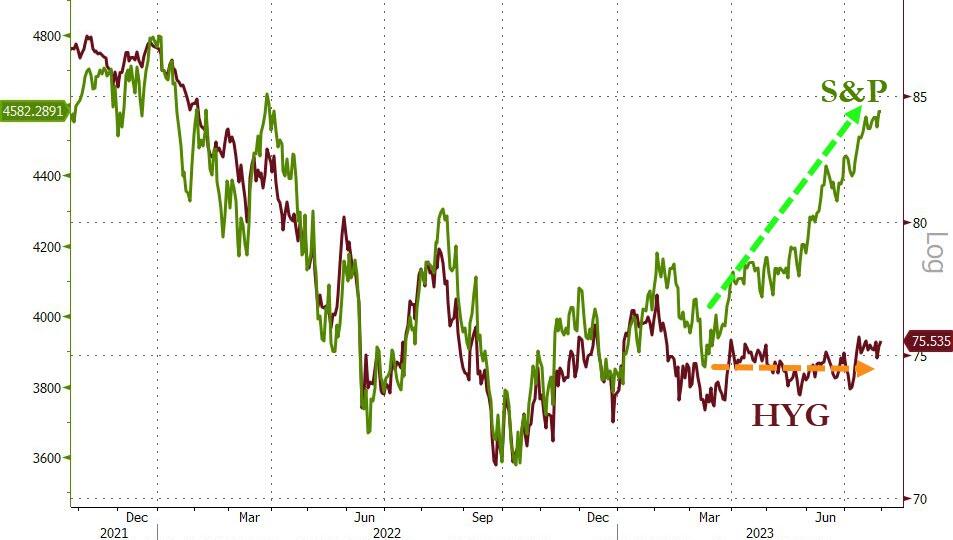
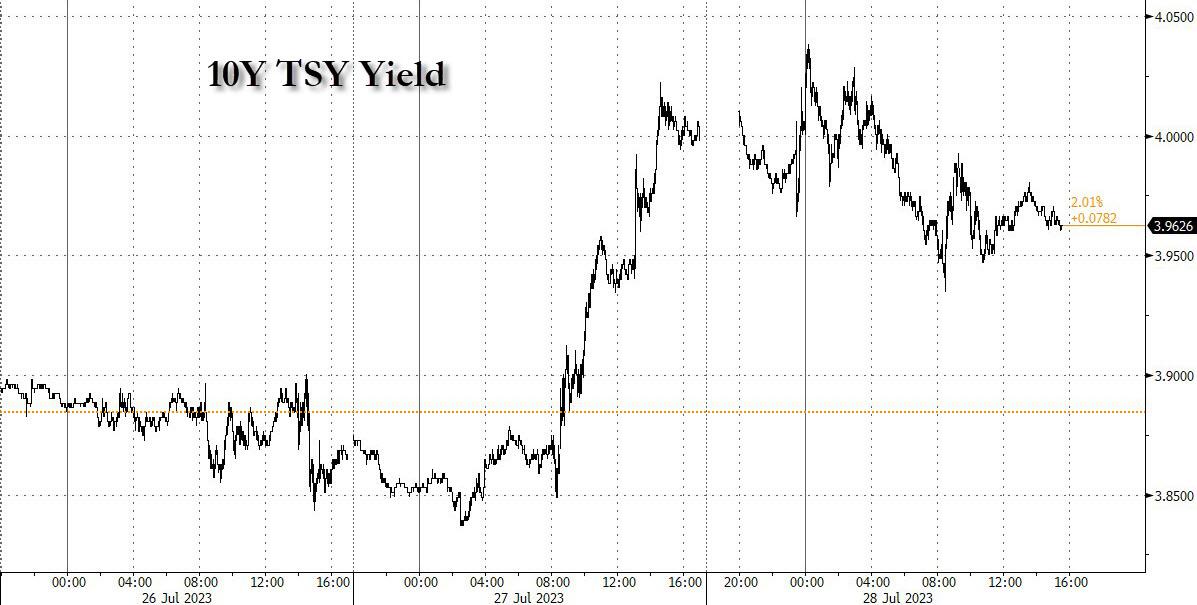
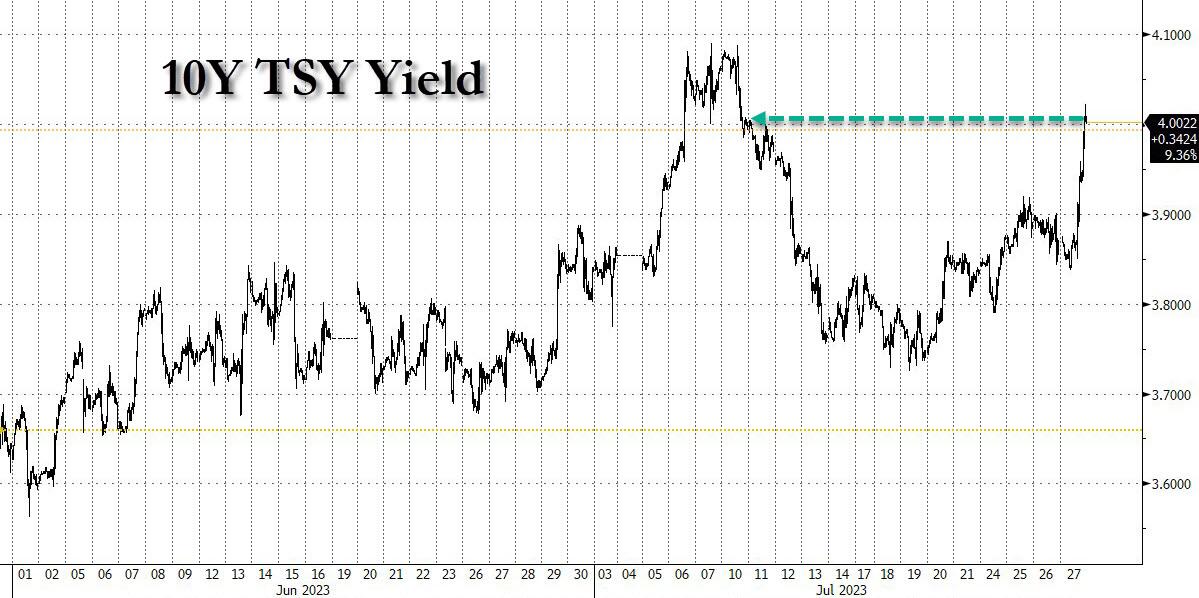
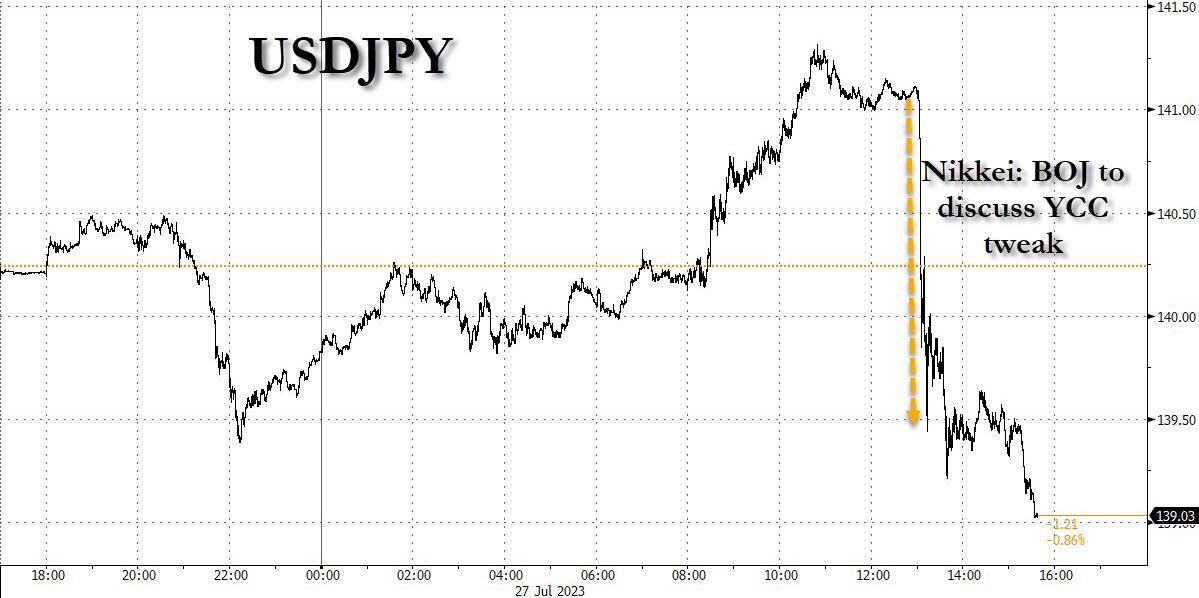
Bond yields jumped, despite weak economic data, and the dollar broke free from its recent range. The usual suspects – short sellers – prevented a bigger sell-off and kept the S&P 500 from losing more than 1% in 40 days.
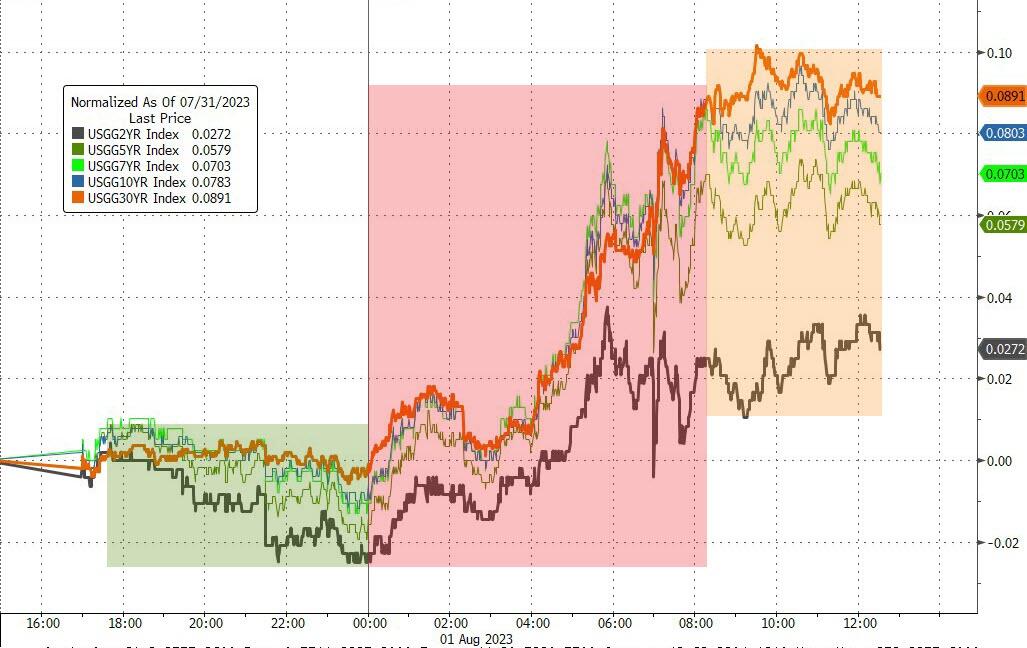
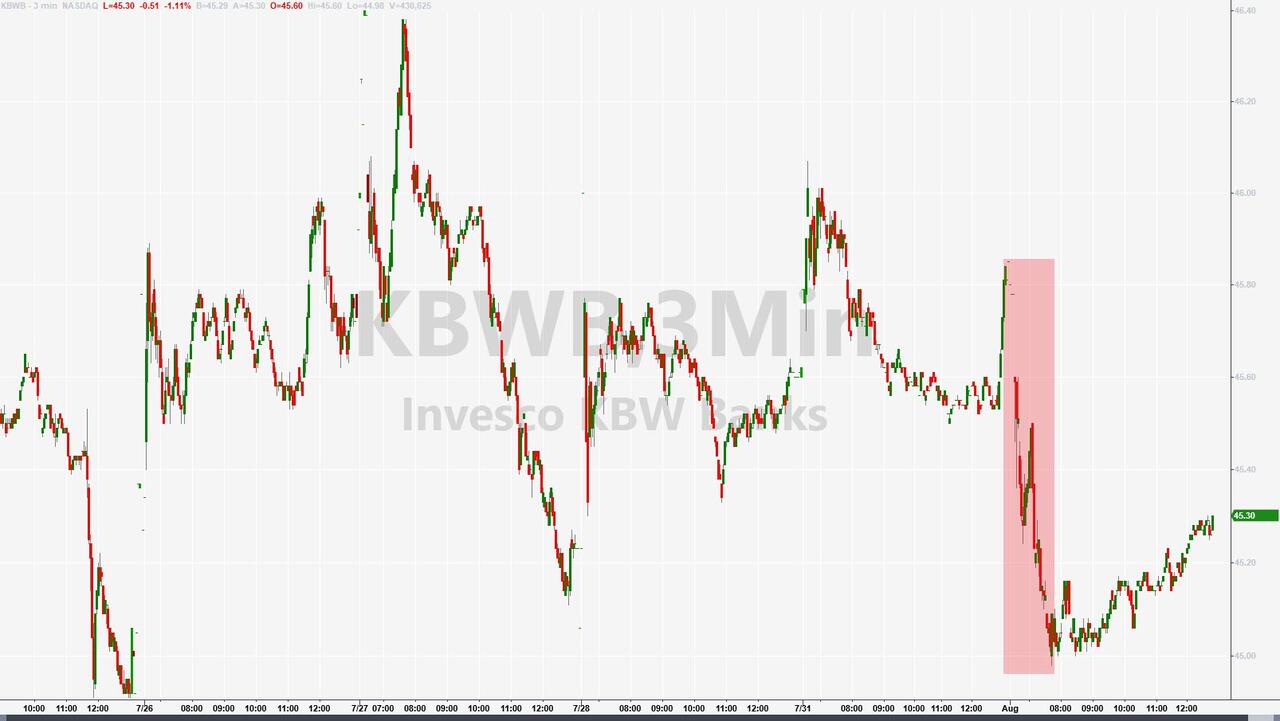
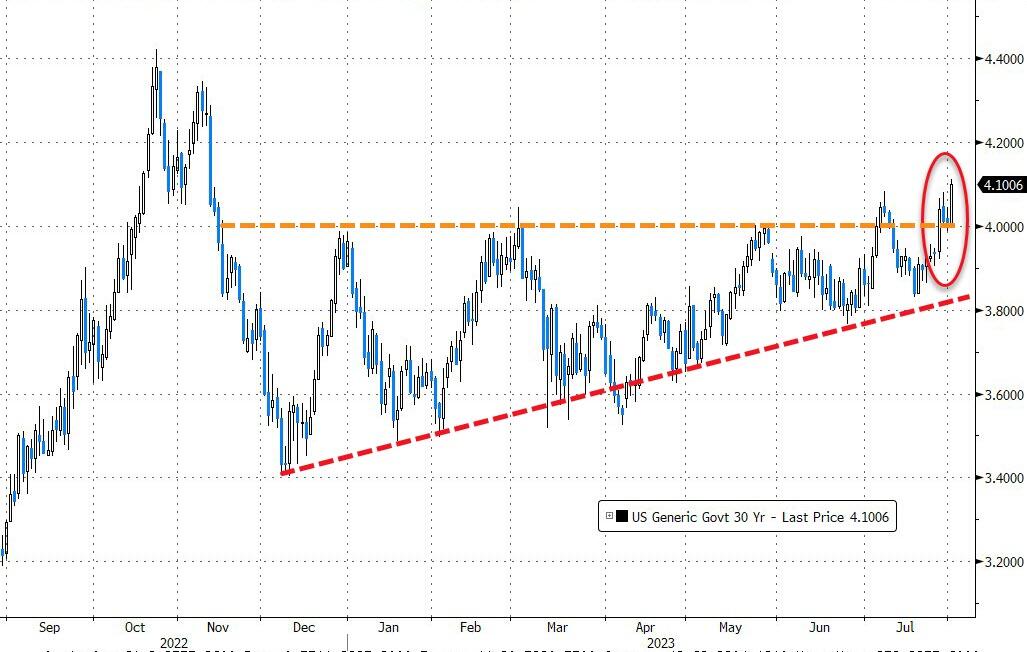
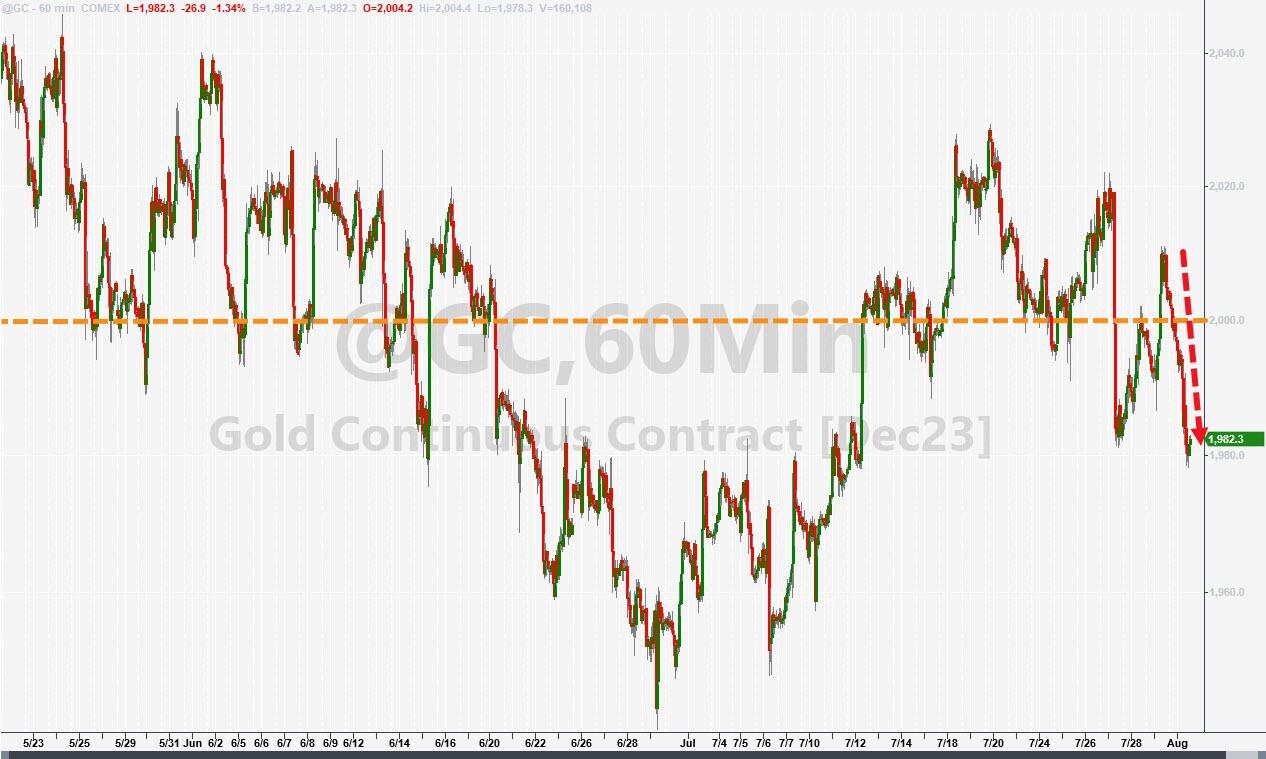
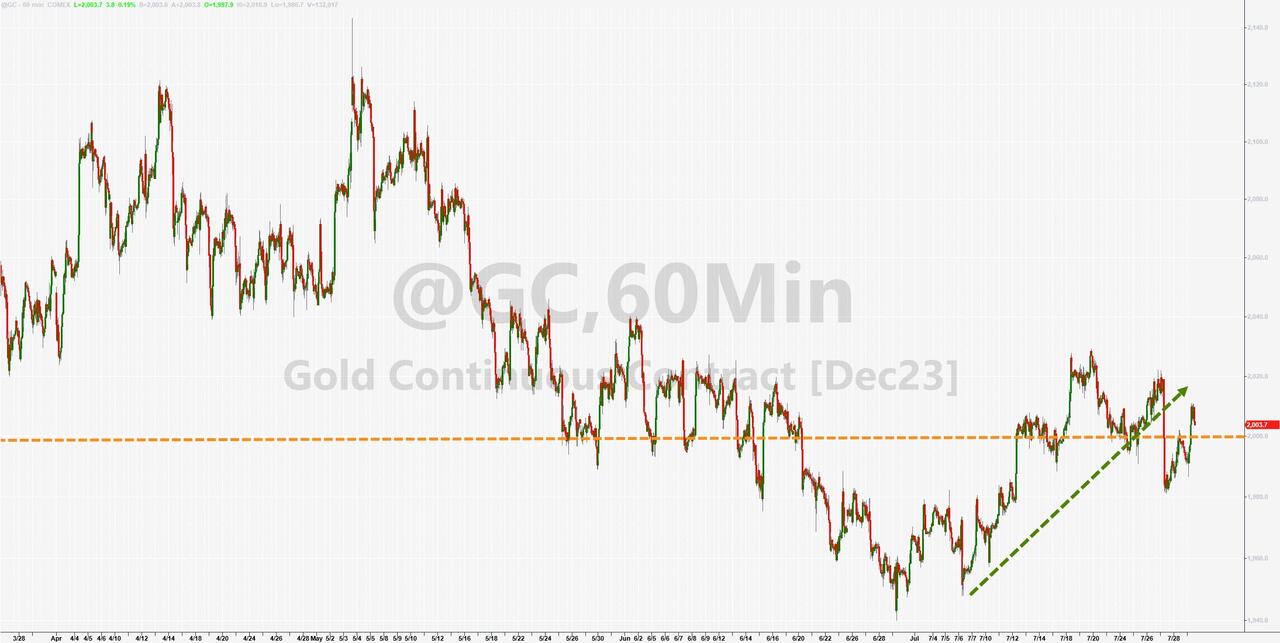
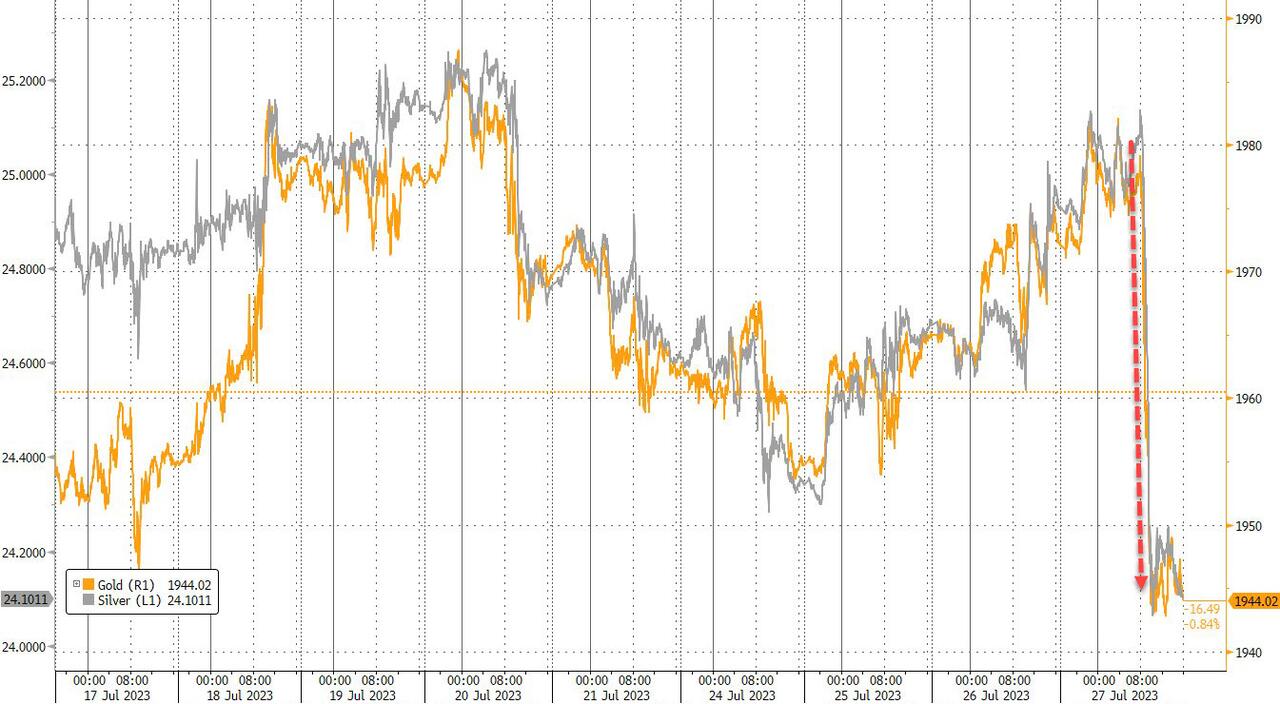
Banks took a hit, as the 10-year yield rose above 4% again, and the 30-year reached its highest level since last November. Gold didn’t shine either and fell below $2k again.
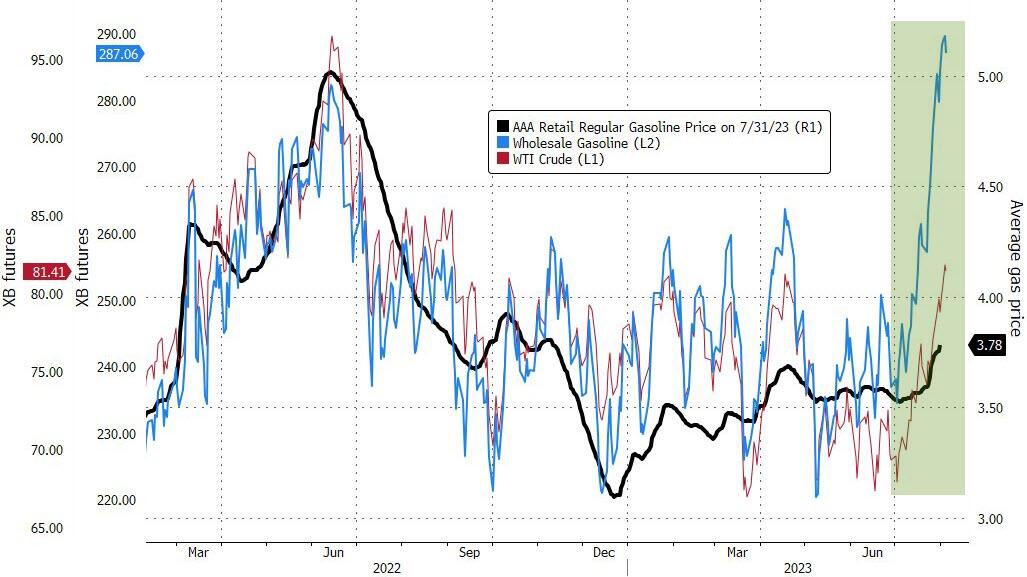
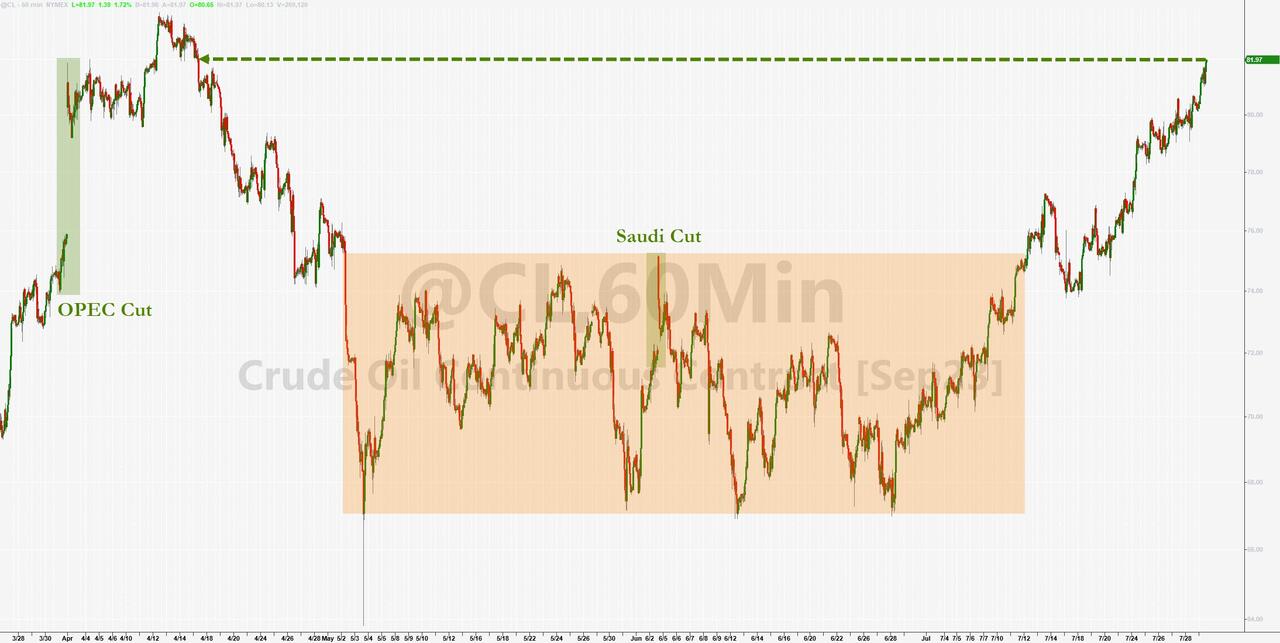
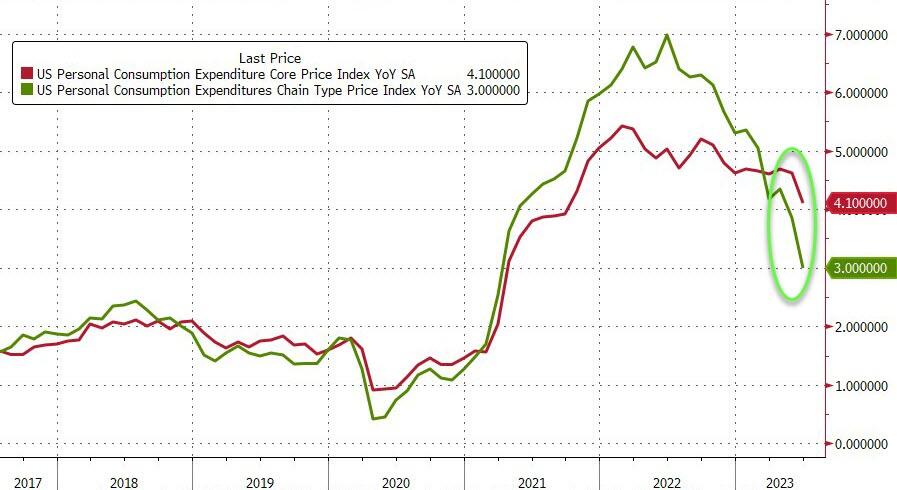
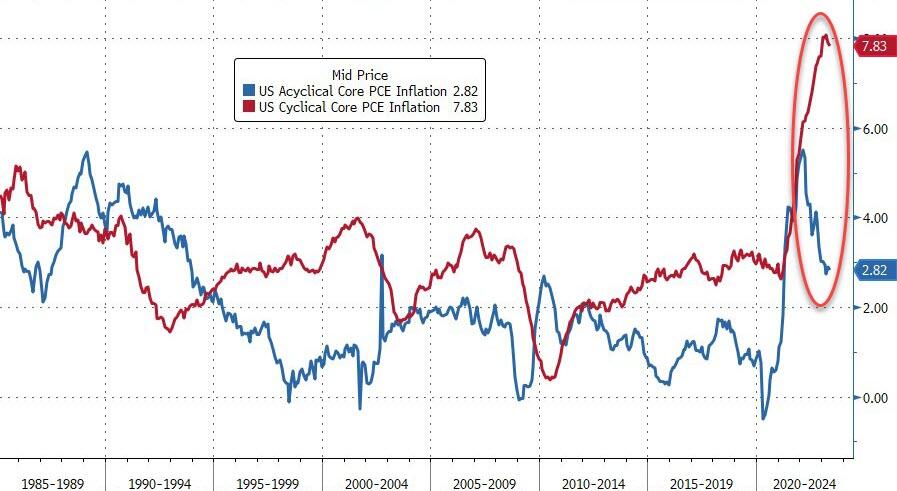
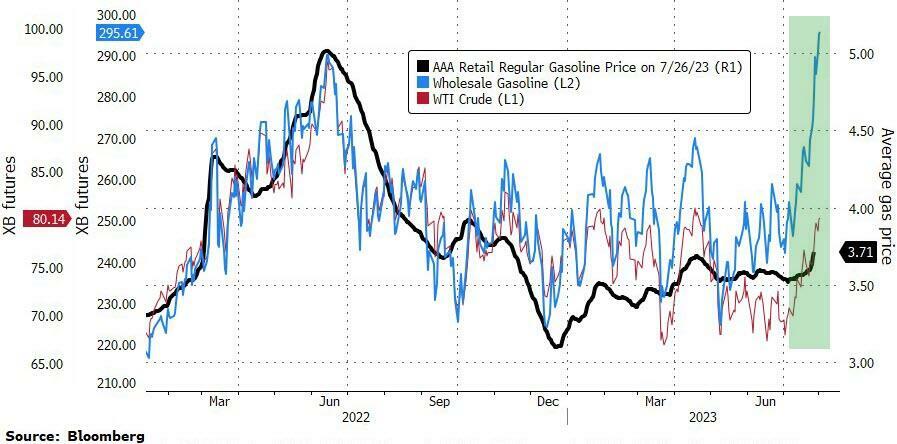
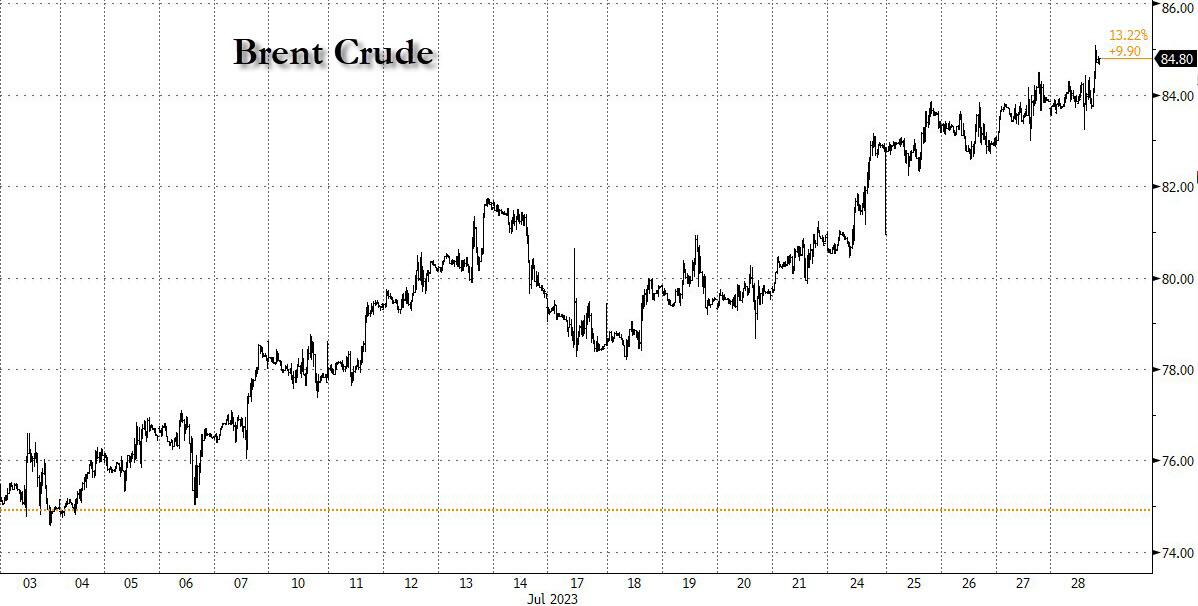
As for inflation, those who think it’s tamed may have to think again. Crude oil is climbing up from its lows, while wholesale gasoline is ready to burst. In short, it was a rough day for the bulls, but not a disaster. Yet.
Read More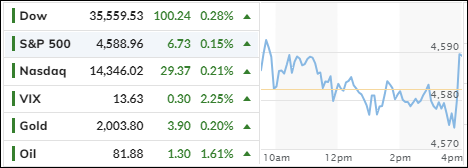
