Stocks Tumble, Fed Mumbles, Oil Rumbles, And Bonds Crumble

Ulli Market Commentary Contact

[Chart courtesy of MarketWatch.com]

  1. Moving the markets

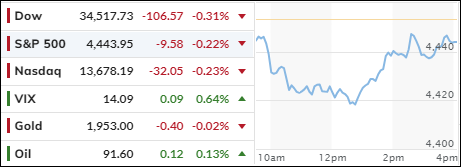
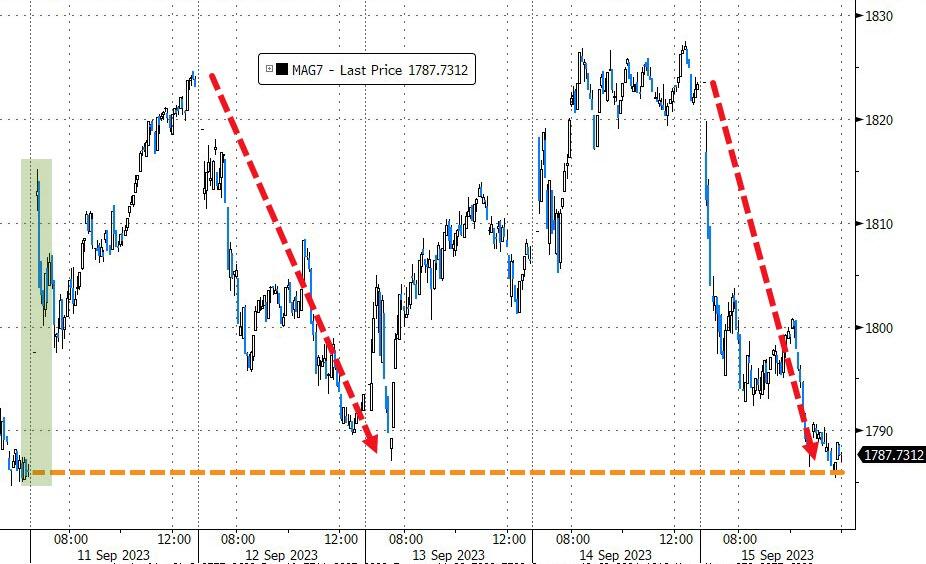
The markets had a bad hair day on Tuesday as they waited for the Federal Reserve to wake up and make a move. After plunging in the middle of the day, the major indexes clawed their way back up but still ended in the red.

The central bank’s two-day meeting started on Tuesday, but nobody expected any surprises. The Fed was likely to keep rates unchanged on Wednesday, with traders betting 99% that the bank would hit the snooze button. Traders were also skeptical that the Fed would hike rates in November, giving it only a 29% chance.

The Fed was also supposed to give some economic forecasts on Wednesday, but investors were more interested in what the bank would say about inflation and interest rates.

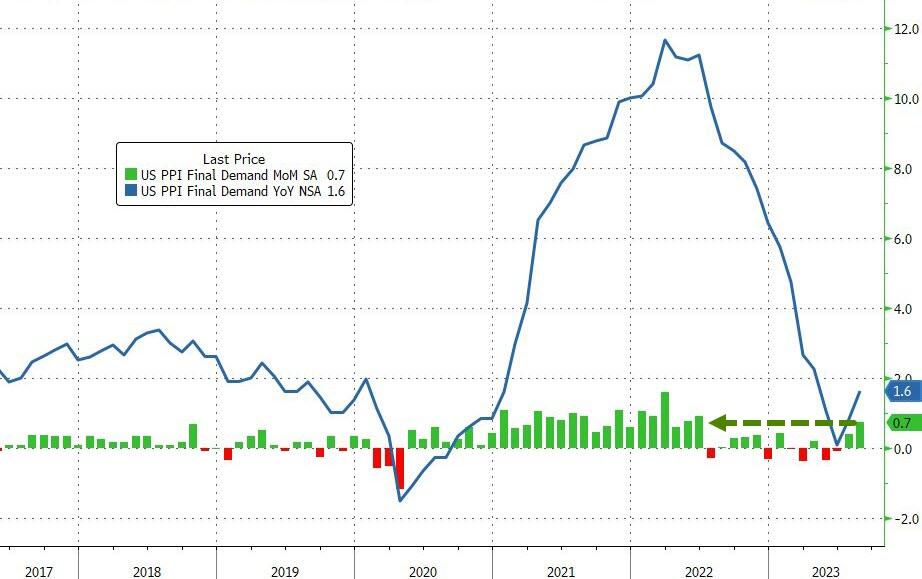
Would the Fed admit that prices were rising faster than expected? Would the Fed hint at when it would start tapering its bond-buying program? Would the Fed crack a joke to lighten the mood?

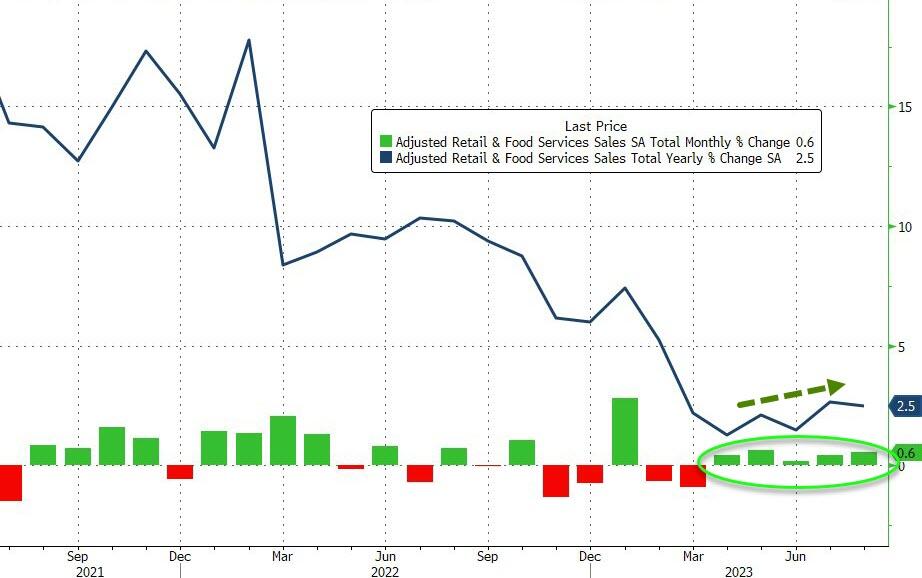
Analysts believed that the Fed was trying to land the economy softly, like a feather on a pillow. Consumer spending was strong in the summer, but economists predicted that it would slow down as people ran out of stimulus money. Plus, many young Americans had to start paying back their student loans, which meant less money for avocado toast and Netflix.

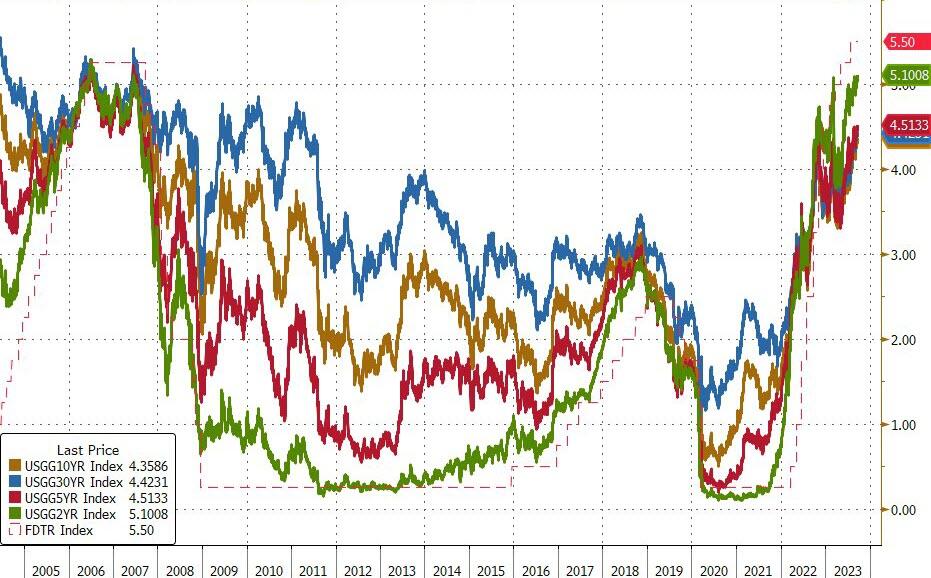
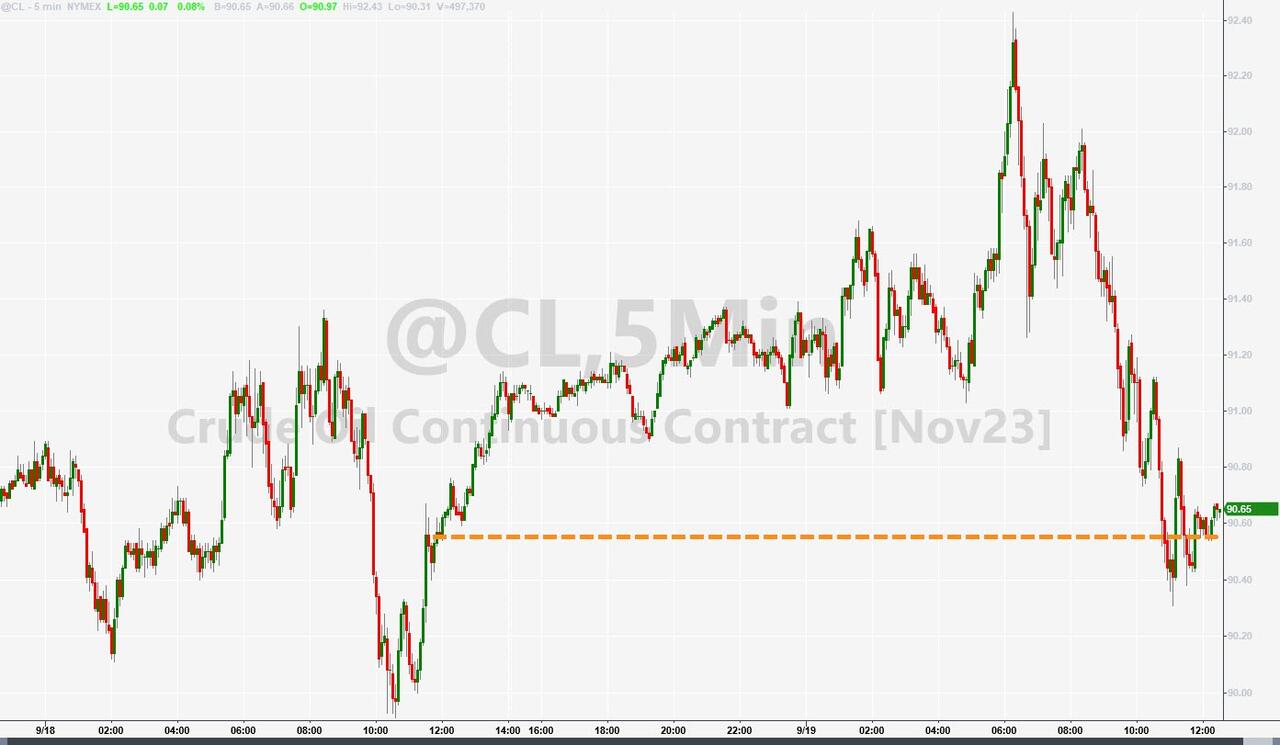
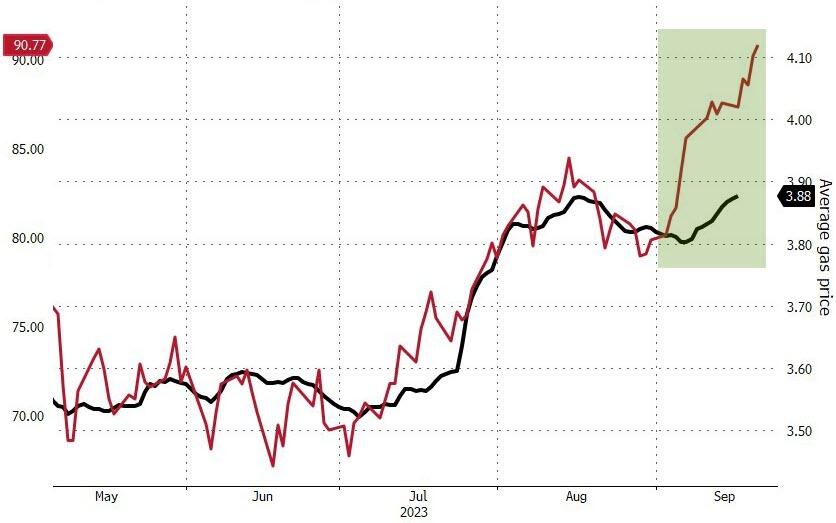
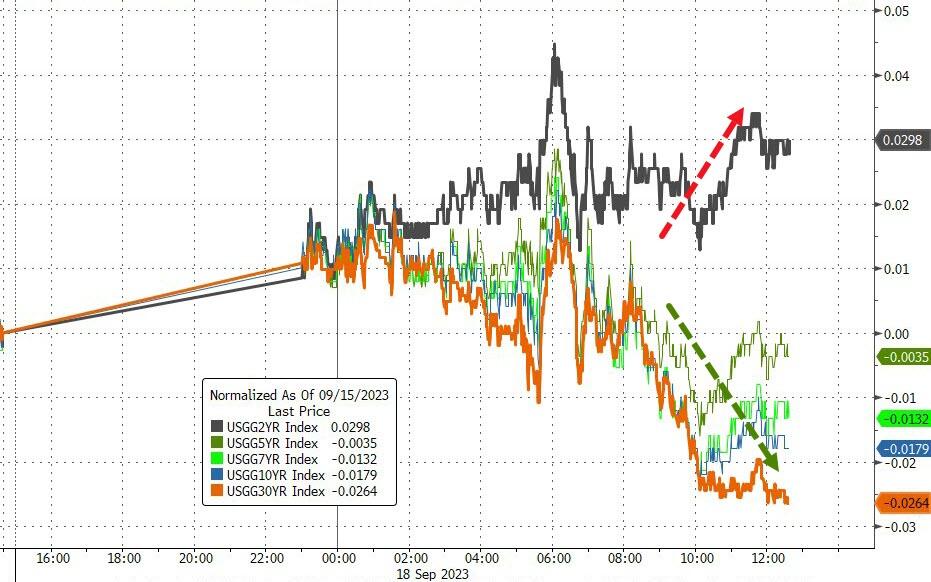
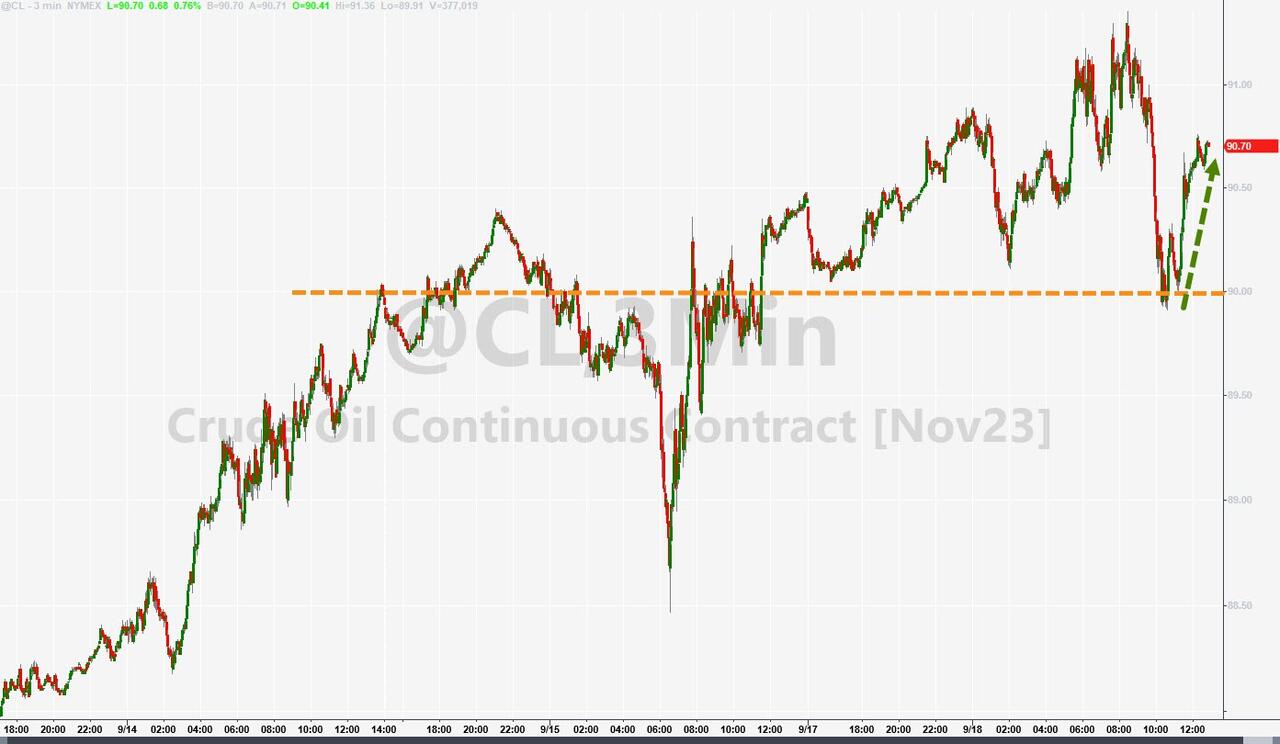
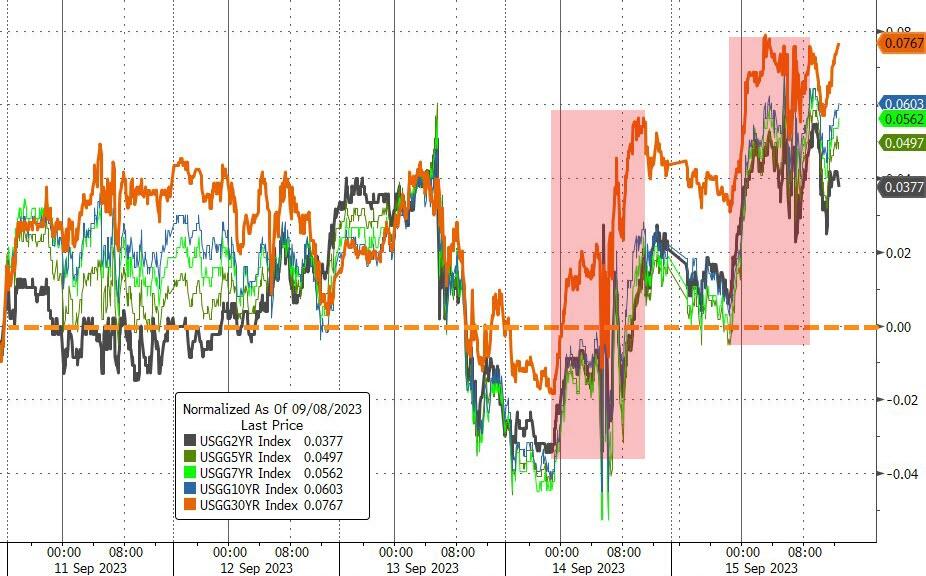
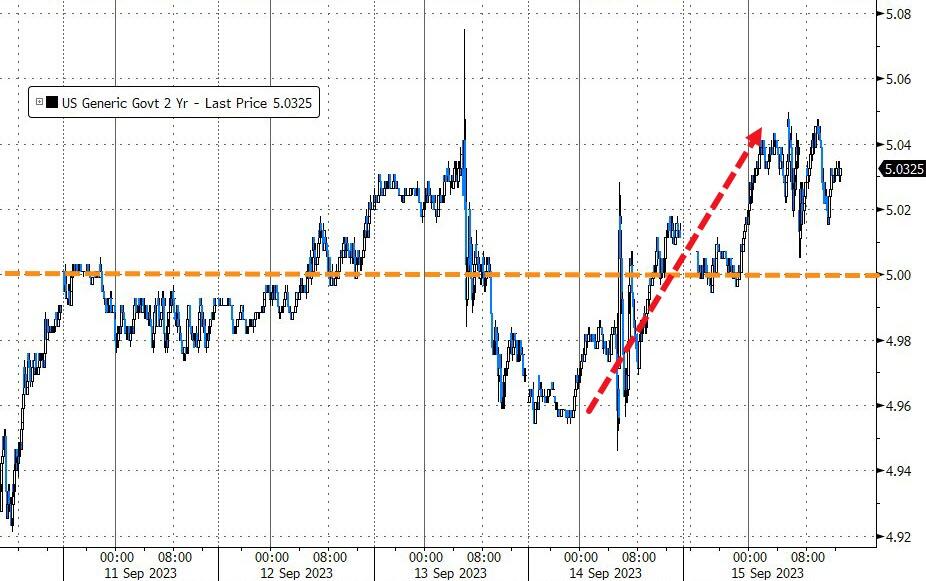
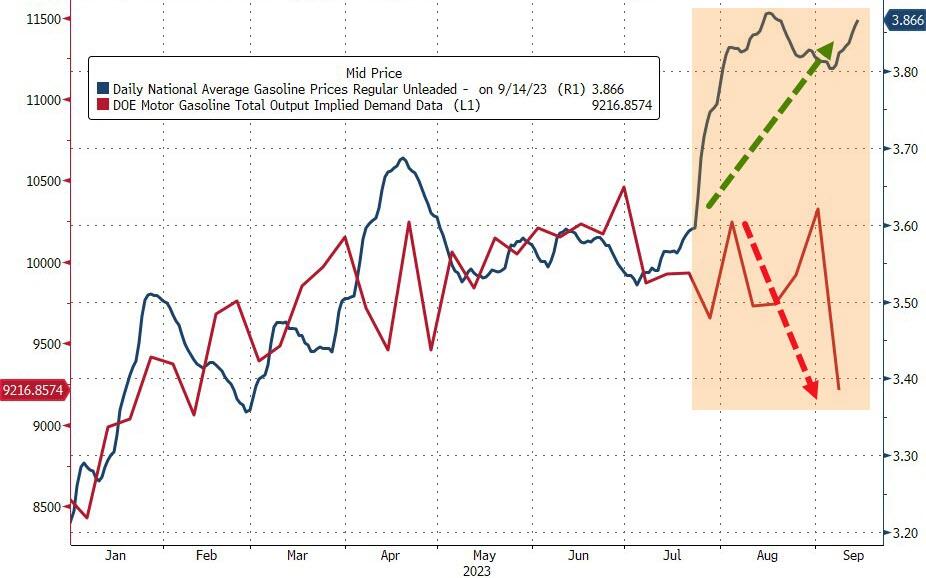
Oil prices soared on Tuesday, with Brent crossing the $95 mark. The surge in prices helped energy stocks within the S&P 500 reduce their losses in the index. Oil was having a blast, unlike bonds, which were having a blast from the past. Bond yields jumped to 16-year highs, which made their prices drop to their lowest level since October 2007.

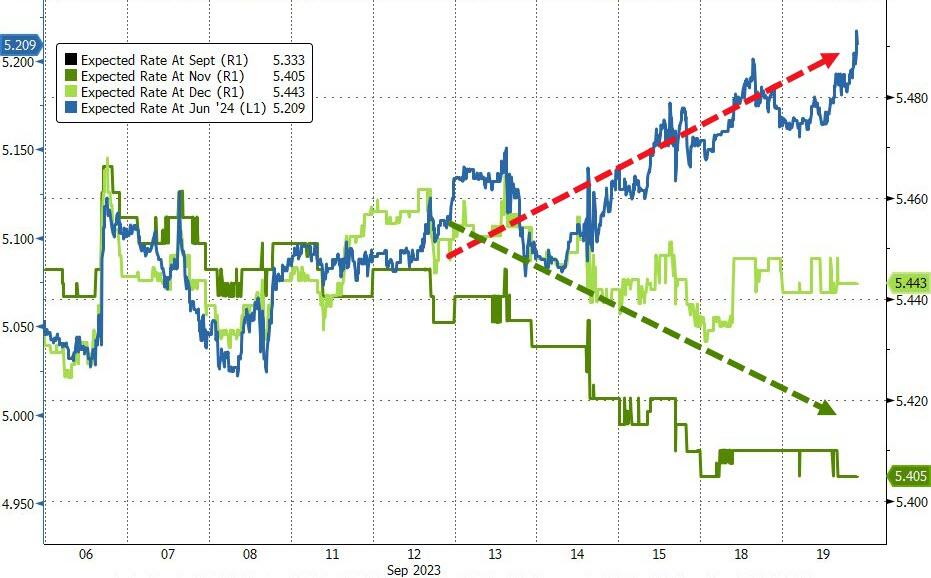
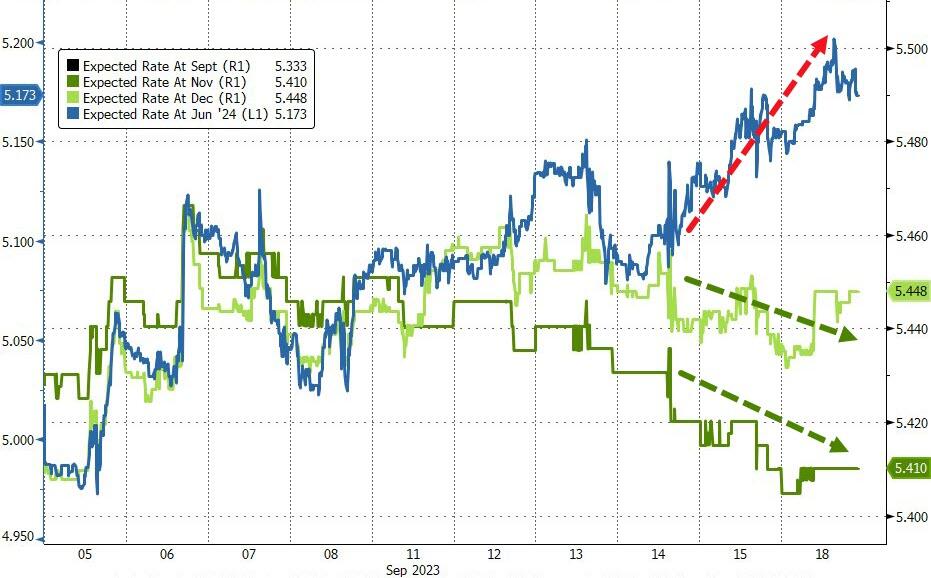
The markets realized that the Fed was not kidding when it said it would keep rates higher for longer. Next year’s rate hike expectations skyrocketed, which made bond investors cry.

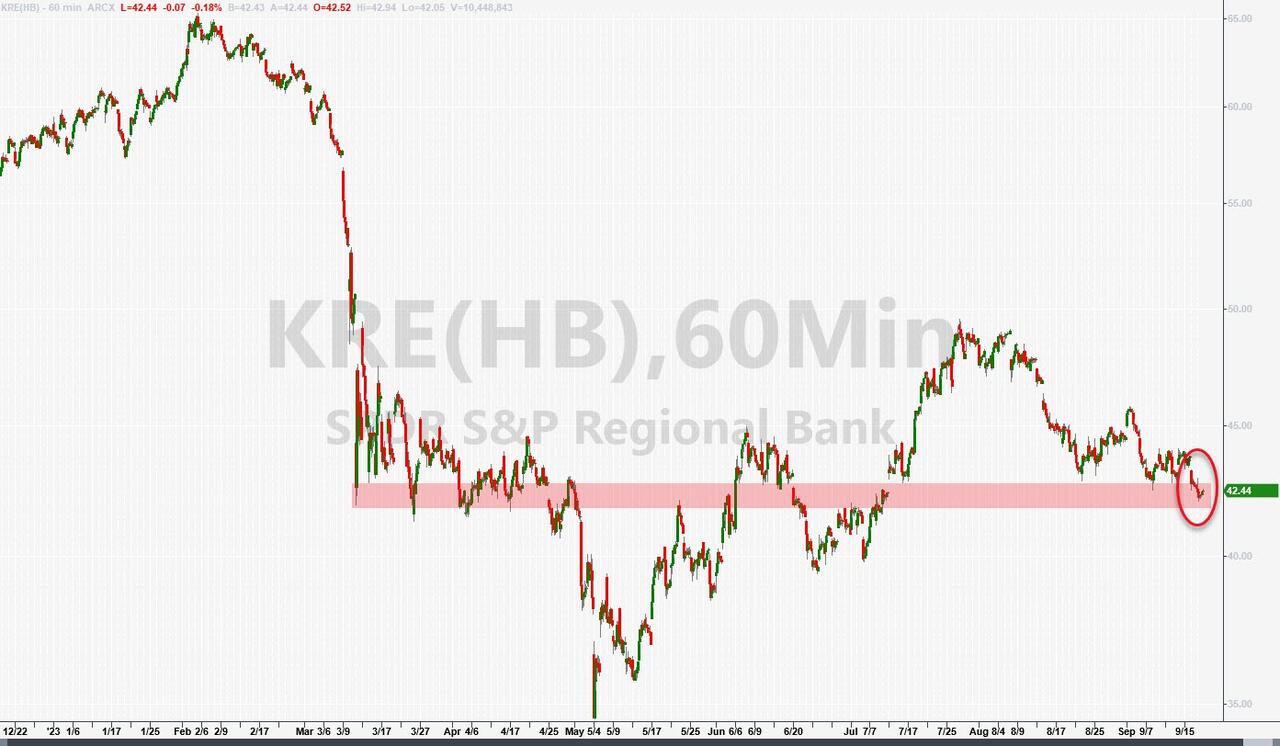
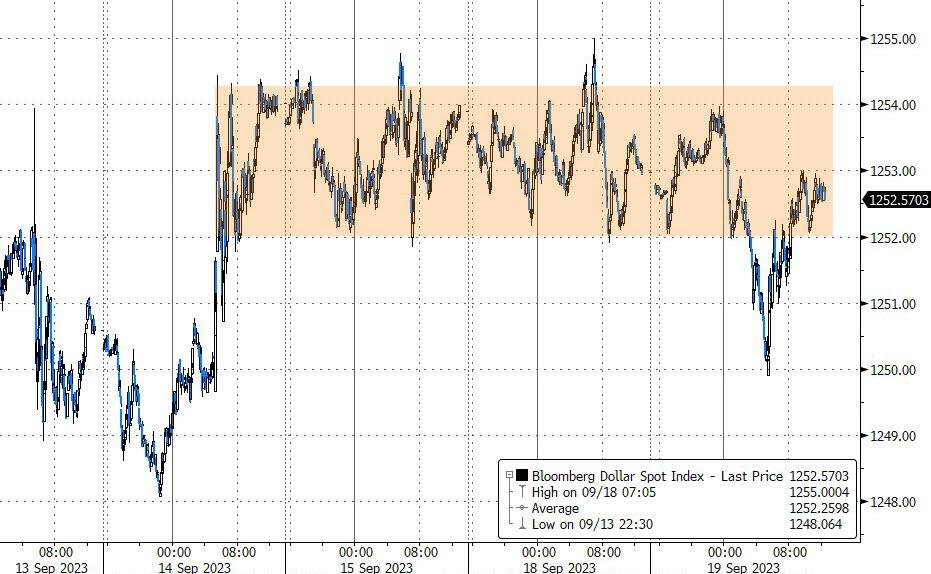
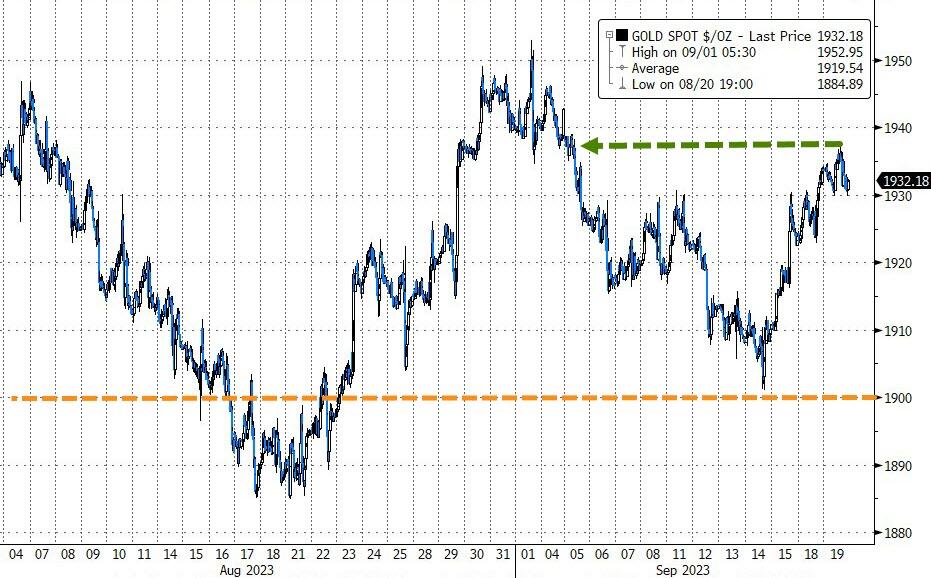
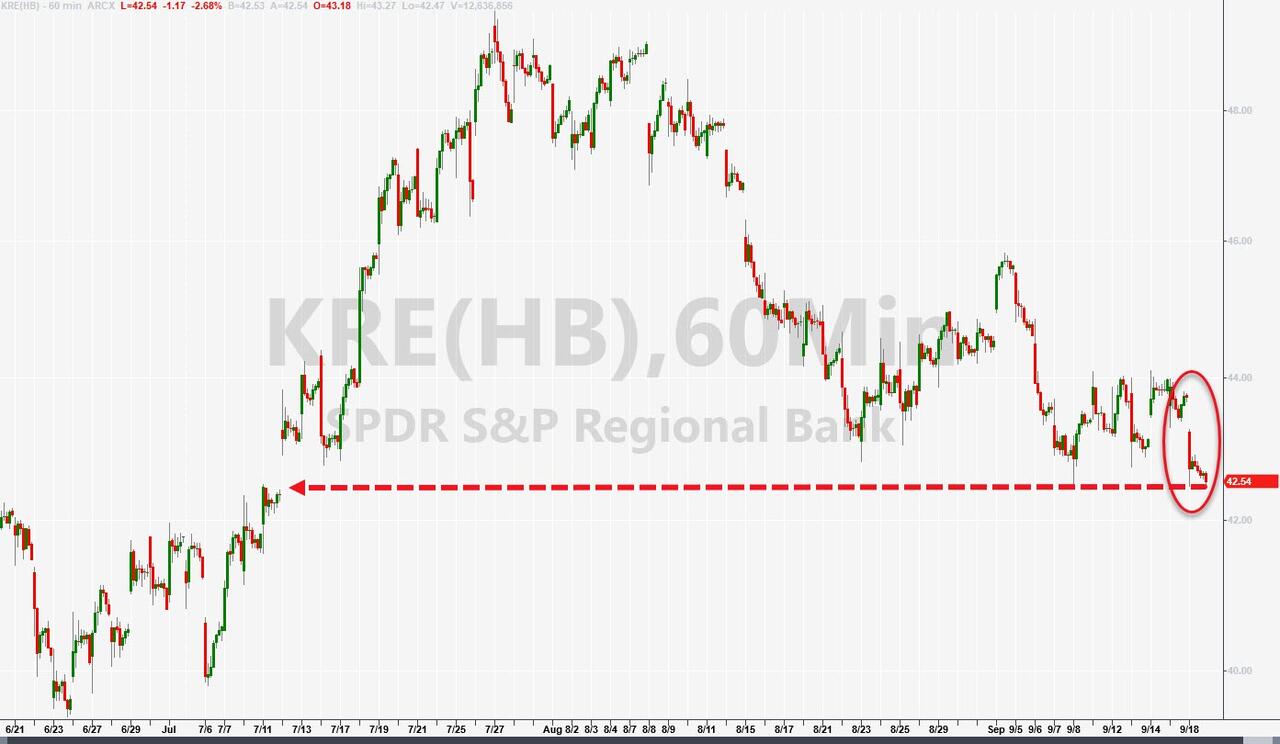
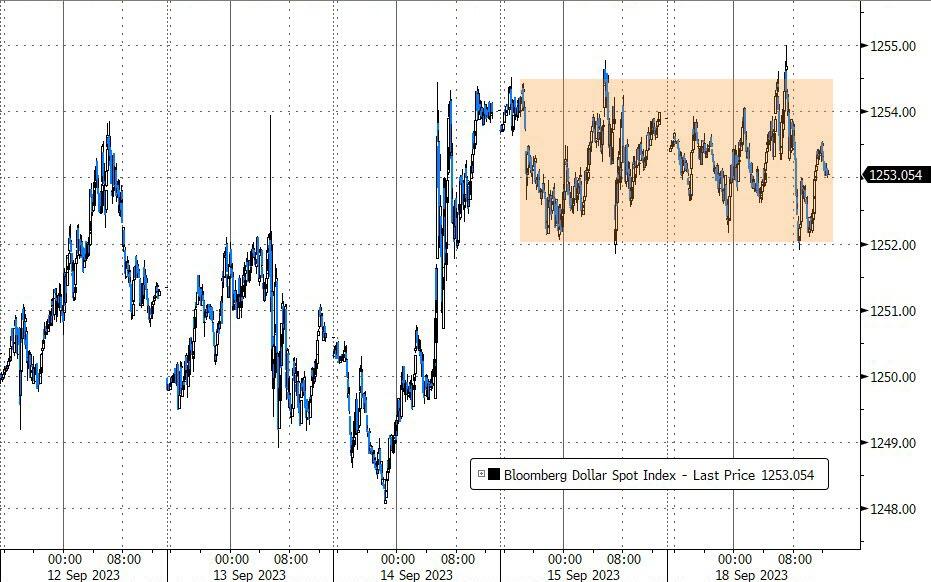
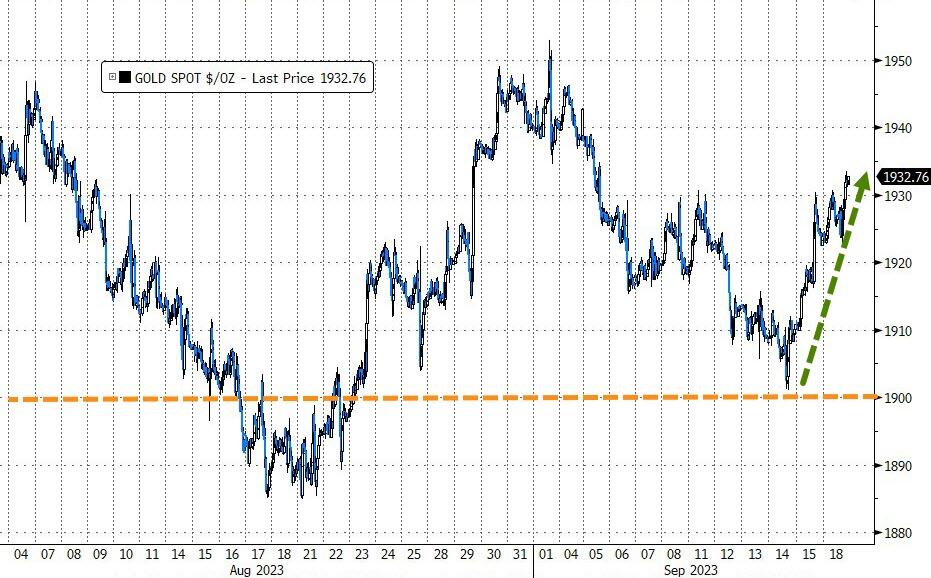
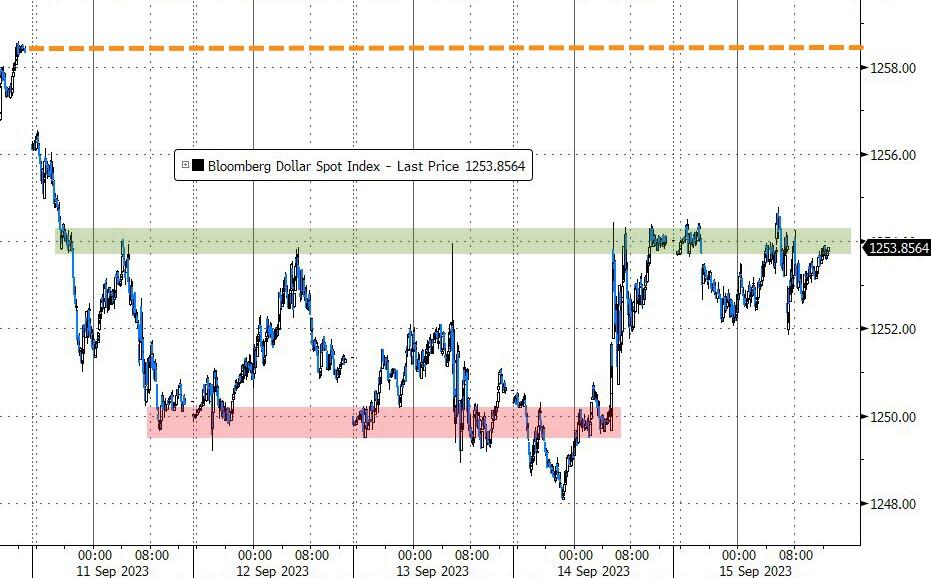
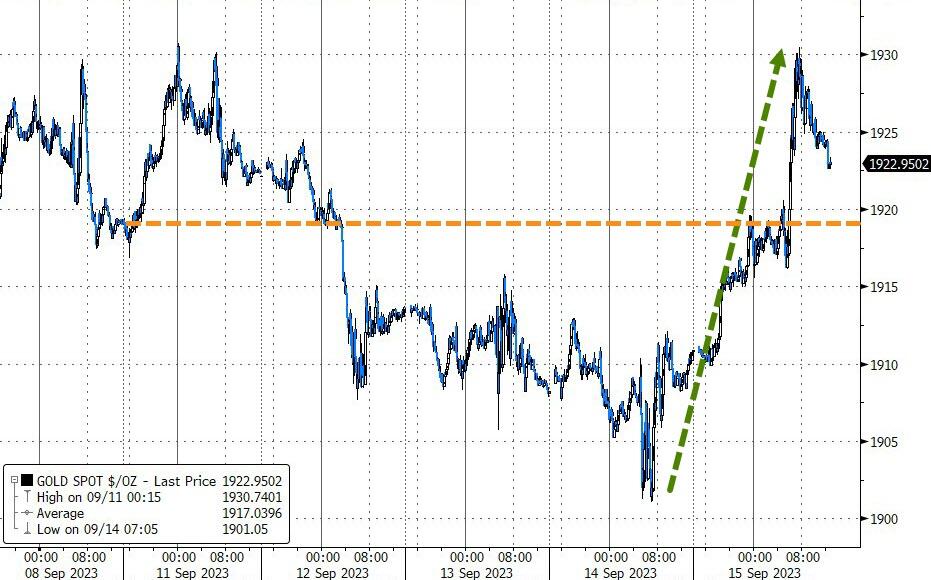
As a result, regional banks kept sinking, as they struggled to make money from lending. The dollar was also confused, as it moved up and down without direction. Gold tried to rally but gave up and closed flat. Oil prices had a wild ride, as they spiked and then dropped, with WTI finding support at $90.

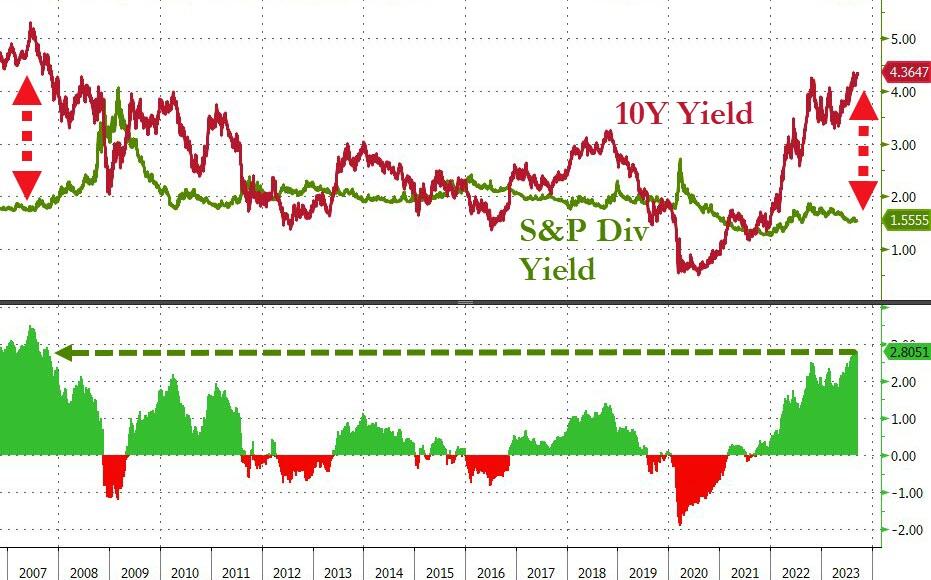
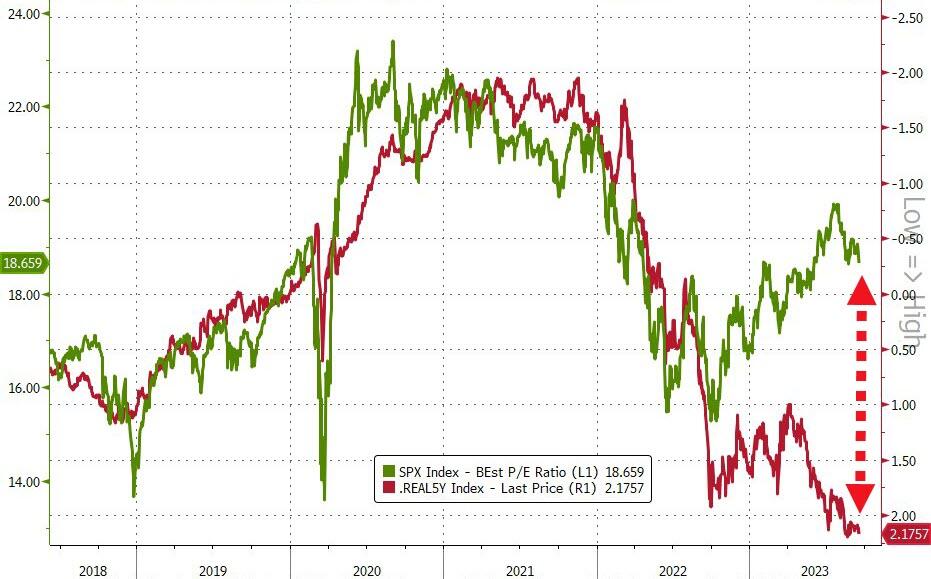
The gap between bonds and the S&P 500 was obvious and raised a question: “Which way will the alligator jaw snap shut?” Will bonds catch up with stocks or will stocks fall and catch up with bonds?

Or will they both get eaten by the alligator?

Read More

S&P 500 Snoozes As Investors Brace For Fed Surprise

Ulli Market Commentary Contact

[Chart courtesy of MarketWatch.com]

  1. Moving the markets

The S&P 500 was bored on Monday as investors waited for the Federal Reserve to make up its mind about the interest rates. The S&P 500 and the Nasdaq were both losers for the second week in a row, while the Dow managed to squeeze out a tiny win.

Oil prices soared to their highest levels since November, breaking the $91 barrier. WTI is on fire, rising almost 30% in the third quarter. And if you have filled up your tank lately, you have felt the pain in your wallet. But don’t worry, inflation is just a myth…

Traders are betting that the Fed will do nothing on Wednesday and only have a 31% chance of raising rates in November. Dream on, but I doubt the Fed will sit on its hands while inflation is running wild, no matter how they measure it.

On the economic front, we saw that homebuilders finally woke up from their fantasy as confidence crashed in September. More and more builders had to cut home prices to attract buyers. It will take a long time for homebuilder confidence to match homebuyer confidence, especially with 7% mortgage rates looming over them. Ouch indeed!

Regional banks kept sliding and hit 20-month lows. The most shorted stocks also took a hit as squeeze attempts failed miserably. Nvidia’s drop erased its gains for the last 3 months, while bond yields were mixed. The dollar was flat, but Gold shined a bit in this dull session and reclaimed its $1,950 level.


Oil prices stayed high despite a mid-day sell-off. Lastly, the rate expectations have changed lately. This year is still dovish (no more hikes), but next year is turning hawkish. That means fewer and fewer cuts, as the Fed’s “higher for longer” talk becomes reality.

How will the markets react to this unexpected twist?

Read More

ETFs On The Cutline – Updated Through 09/15/2023

Ulli ETFs on the Cutline Contact

Do you want to know which ETFs are hot and which ones are not? Then you need my High-Volume ETF Cutline report. It tells you how close or far each of the 311 ETFs I follow is from its long-term trend line (39-week SMA). These are the ETFs that trade more than $5 million a day, so they are not some obscure funds that nobody cares about.

The report is split into two parts: The winners that are above their trend line (%M/A), and the losers that are below it. The yellow line is the line of shame that separates them. You can see how many ETFs are in each group and how they have changed since the last report (138 vs. 156 current).

Take a peek:

The HV ETF Master Cutline Report

If you are confused by some of the terms we use, don’t panic. I have a helpful Glossary of Terms for you.

If you want to learn more about the Cutline method and how it can make you rich (or at least less poor), read my original post here.

ETF Tracker Newsletter For September 15, 2023

Ulli ETF Tracker Contact

ETF Tracker StatSheet          

You can view the latest version here.

TECH WRECK: MARKET PLUNGES AS INFLATION FEARS LOOM

[Chart courtesy of MarketWatch.com]

  1. Moving the markets

The market had a bad case of the Fridays, as tech stocks led the way down and erased most of the gains from earlier this week. Auto stocks were the exception, as Ford, GM and Stellantis managed to rev up despite a massive strike by the UAW that shut down half of US auto production.

The market was also hopeful about the end of the tech IPO drought, as ARM Holdings made a strong debut and traded 6% higher. But that optimism faded as investors looked at the latest economic data. The data was a mixed bag, to say the least.

On one hand, industrial production rose more than expected in August, showing some resilience in the manufacturing sector. On the other hand, inflation expectations dropped sharply in September, according to the UMich survey. That’s either good news or bad news, depending on how you look at it.

The market is now waiting for the Fed’s decision next week, hoping that they won’t raise rates again or taper their bond buying program. The Fed has been saying that inflation is transitory, but the data seems to suggest otherwise.

The tech sector was especially hit hard, as the ‘Magnificent 7’ (AAPL, AMZN, FB, GOOG, MSFT, NFLX and NVDA) lost their magic and gave up all their weekly gains. NFLX was the worst performer, dropping like a bad movie. NVDA also suffered, falling 13% from its record high after earnings.

The most shorted stocks also continued their downward trend, falling for the second week in a row. Bond yields rose slightly, with the 2-year breaking above 5%. The dollar weakened, while gold and oil prices rose with the latter reaching $91. Gas prices are also soaring, which might hurt consumer spending.

With all this uncertainty, some analysts are comparing the current situation to the AI/Covid/Crypto Boom/Bust.

Will history repeat itself? Or will the market find a way to bounce back? That’s the million-dollar question.

Read More

Weekly StatSheet For The ETF Tracker Newsletter – Updated Through 09/14/2023

Ulli ETF StatSheet Contact

ETF Data updated through Thursday, September 14, 2023

How to use this StatSheet:

  1. Out of the 1,800+ ETFs out there, I only pick the ones that trade over $5 million per day (HV ETFs), so you don’t get stuck with a lemon that nobody wants to buy or sell.
  1. Trend Tracking Indexes (TTIs)

These are the main indicators that tell you when to buy or sell Domestic and International ETFs (section 1 and 2). They do that by comparing their position to their long-term M/A (Moving Average). If they cross above, and stay there, it’s a green light to buy. If they fall below, and keep going, it’s a red light to sell. And to make sure you don’t lose your shirt if things go south, I also use a 12% trailing stop loss on all positions in these categories.

  1. All other investment areas don’t have a TTI and should be traded based on the position of each ETF relative to its own trend line (%M/A). That’s why I call them “Selective Buy.” In other words, if an ETF goes above its own trend line, you can buy it. But don’t forget to use a trailing sell stop of 12%, or less if you’re feeling nervous.

If some of these words sound like Greek to you, please check out the Glossary of Terms and new subscriber information in section 9.

  1. DOMESTIC EQUITY ETFs: BUY— since 12/01/2022

Click on chart to enlarge

This is our main compass, the Domestic Trend Tracking Index (TTI-green line in the above chart). It has now broken above its long-term trend line (red) by +2.11% and remains in “Buy” mode.

Read More

Inflation Who? Market Surges On Strong Retail Sales And Short Squeeze

Ulli Market Commentary Contact

[Chart courtesy of MarketWatch.com]

  1. Moving the markets

The market soared today as investors shrugged off inflation fears and snapped up stocks that were heavily shorted. This triggered a powerful short squeeze that boosted our domestic TTI deeper into the green zone. This means we can breathe a sigh of relief and postpone any potential “Sell” for now.

The market optimism was fueled by better-than-expected retail sales in August, which rose 0.6% against a 0.1% increase forecasted. This shows that consumers are still spending despite supply chain disruptions. Excluding autos, which are hard to find these days, retail sales also rose 0.6%, beating the 0.4% estimate.

On the other hand, inflation remained hot as the producer price index (PPI) jumped 0.7% in August, more than the 0.4% expected. This was the highest increase in 14 months. But who cares about food and energy prices, right? If we exclude those pesky items, core PPI only rose 0.2%, matching the estimate.

Meanwhile, across the pond, the European Central Bank (ECB) raised its key interest rate by a quarter percentage point, as expected. But the ECB also hinted that it might be done with hiking rates for now, as inflation is easing in Europe. Lucky them!

Back in the US, the Federal Reserve is likely to keep its rates unchanged at its September meeting next week, according to the latest pricing data. The odds of a rate hike in November are still low, but not zero. If the economy continues to surprise on the upside, the Fed might have to reconsider its stance and tighten its policy sooner than later.

One of the bright spots in today’s rally was Arm shares, which soared more than 15% on their first day of trading. The chip design company had the biggest tech IPO of the year and raised hopes for a revival of the tech IPO market. Arm’s IPO was priced at $51 a share, which seems like a bargain now.

In summary, today’s market action was a mix of good news and bad news, depending on your perspective. The good news is that the economy is strong and resilient. The bad news is that inflation is high and persistent. The market chose to focus on the good news today and ignore the bad news.

But will this last? How long can the market defy gravity and ignore inflation? And more importantly, how long can we ignore food and energy prices?

Read More