
- Moving the markets
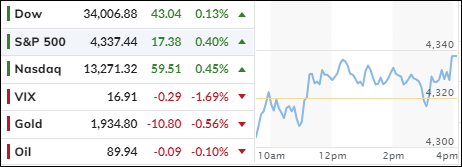
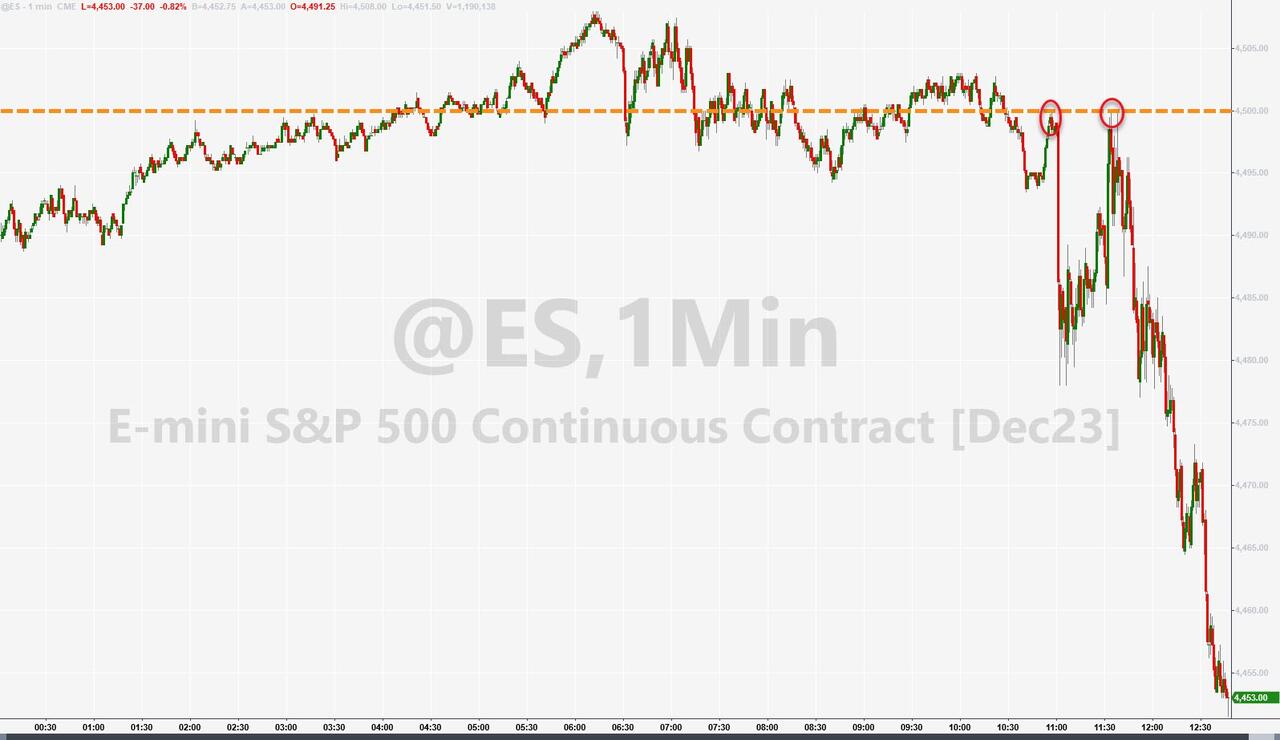
The S&P 500 barely budged Monday as the 10-year Treasury yield soared, and the market started the last week of September with a whimper. But hey, at least the index closed in the green.
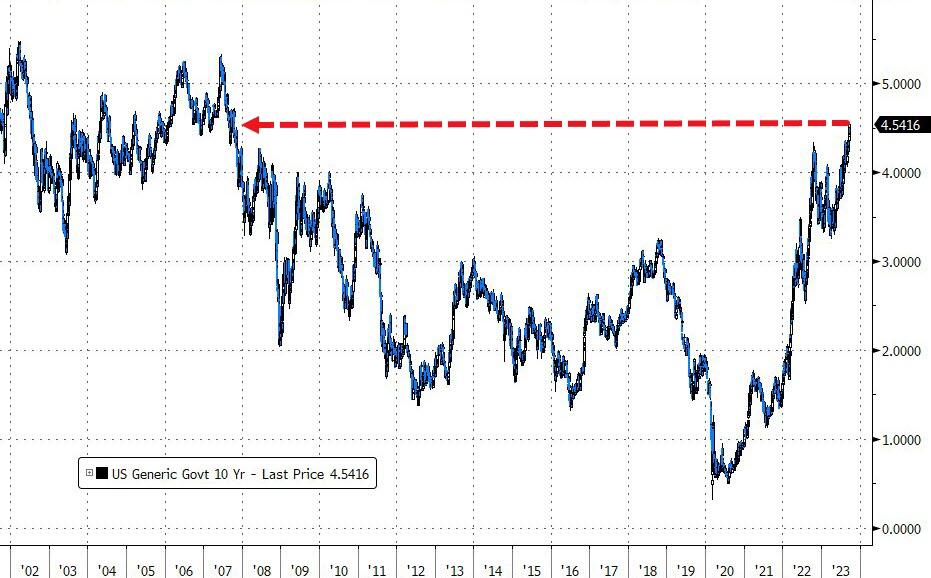
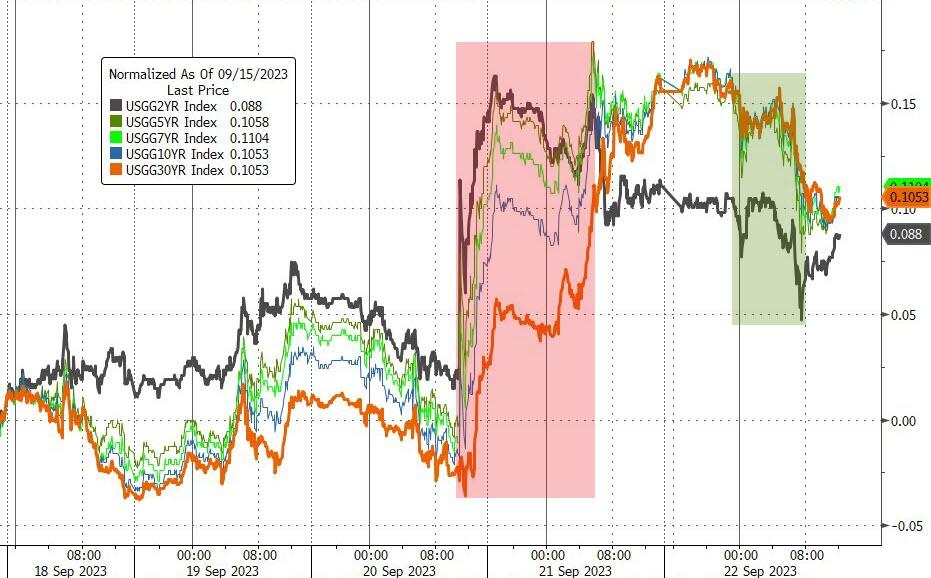
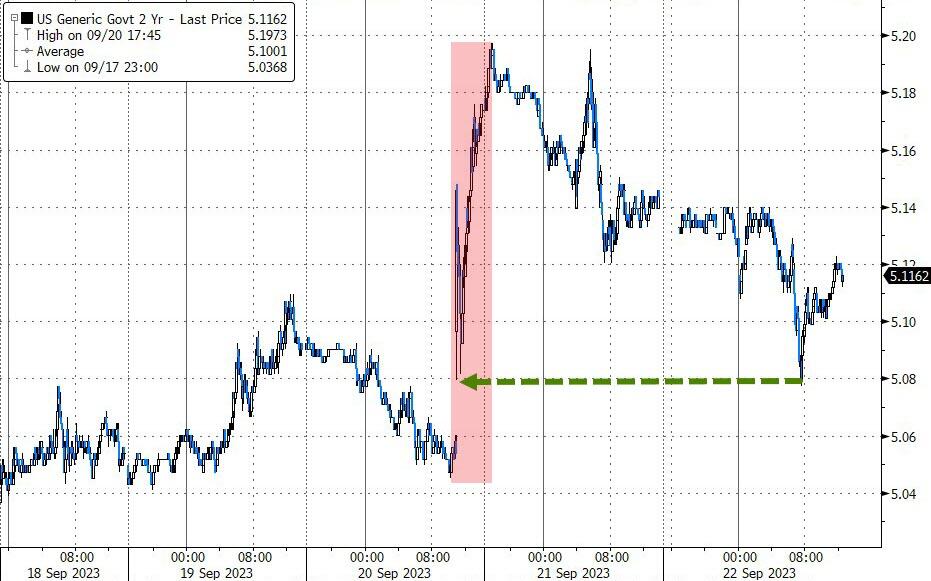
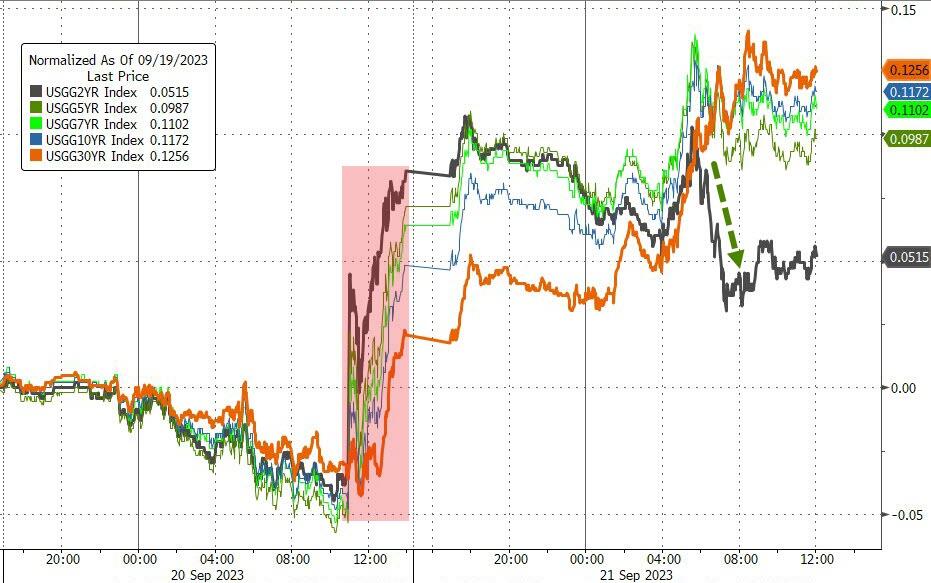
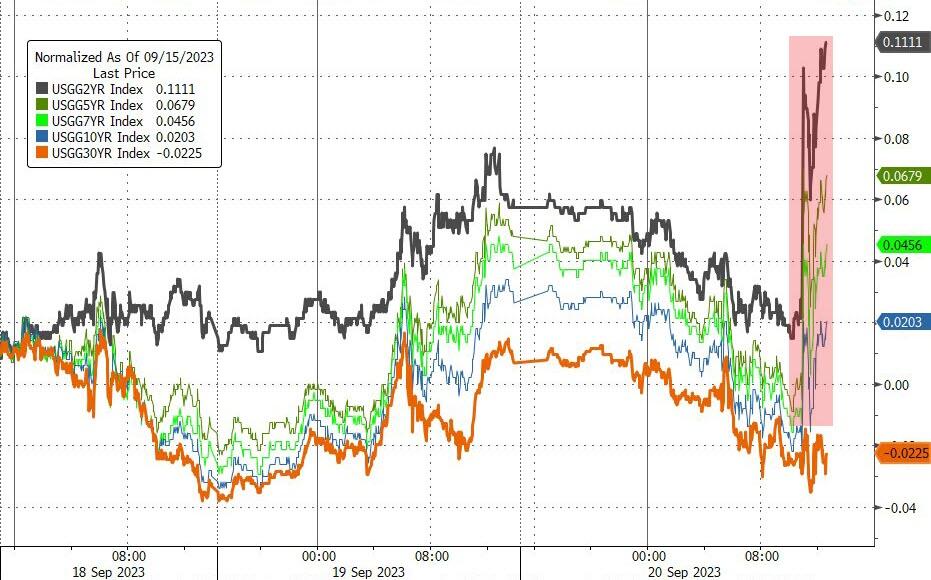
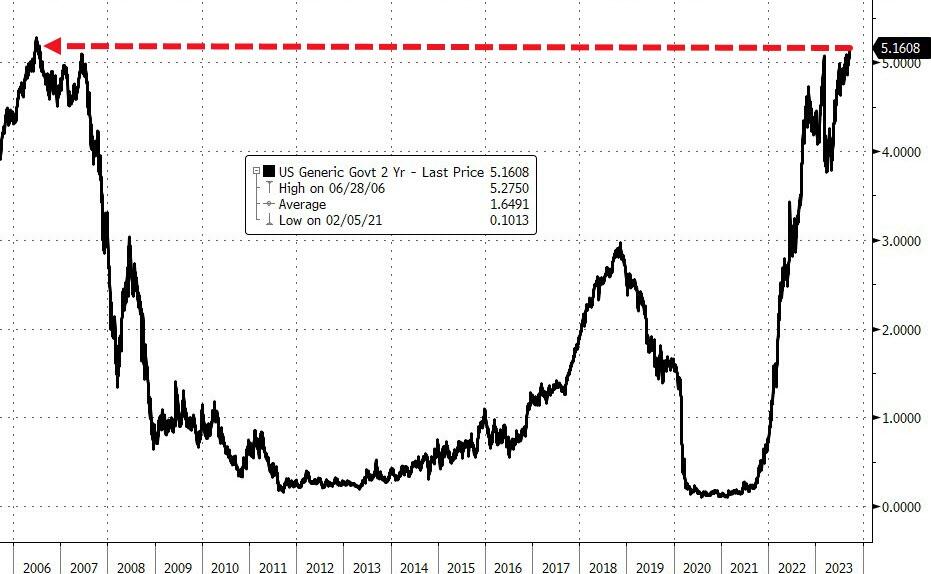
The 10-year Treasury yield reached 4.5%, hitting levels not seen since 2007 when it peaked at 4.57%. Remember 2007? Good times.
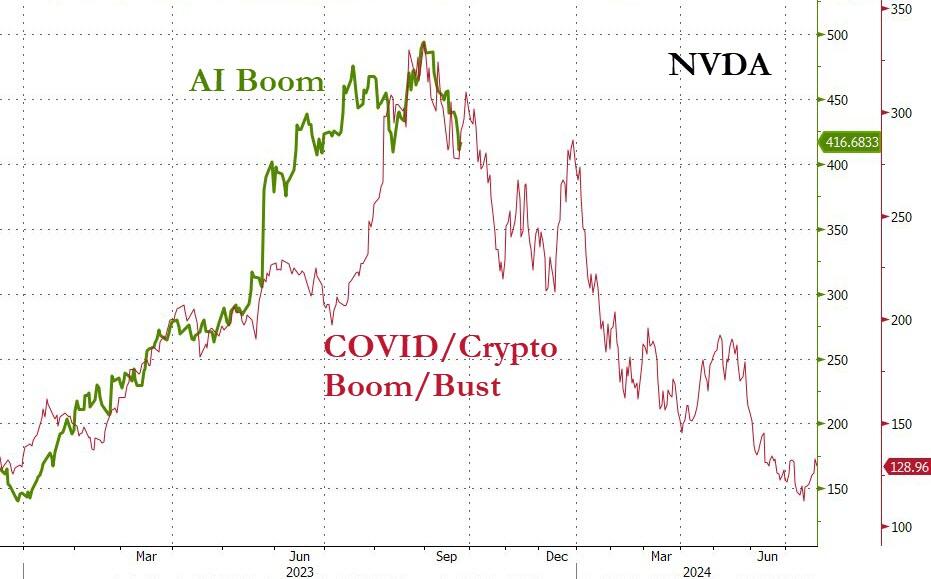
Meanwhile, Amazon shares climbed more than 1% after the online retail giant said Monday it will invest up to $4 billion in artificial intelligence firm Anthropic. Shares of Nvidia rose 1.5%. AI is hot, hot, hot, despite high interest rates. Go figure…
We are wrapping up a notoriously weak month for markets, as the Federal Reserve signaled higher interest rates for longer, sending bond yields higher. The benchmark 10-year Treasury yield has jumped more than 30 basis points this month to over 4.51%.
The market also dealt with a rally in crude oil and a winning streak in the dollar during the seasonally weak trading month. The S&P 500 has dropped more than 4% in September, on track for its second straight losing month and its worst month since December. The tech-heavy Nasdaq Composite is down 6% in September, as growth stocks took the brunt of the sell-off, also headed for its biggest monthly loss since December.
Traders are also closely watching progress on a budget resolution in Washington. Lawmakers over the weekend showed little signs of movement on a deal that would keep the U.S. government funded for the rest of the fiscal year.
The other risk that can affect the economy is the student loan-payment resumption, which in combination with the government shutdown, could trigger notable declines in GDP.
And, to add insult to injury, inflation threats are re-asserting themselves (via commodities) and hurting sentiment via soaring gasoline prices.
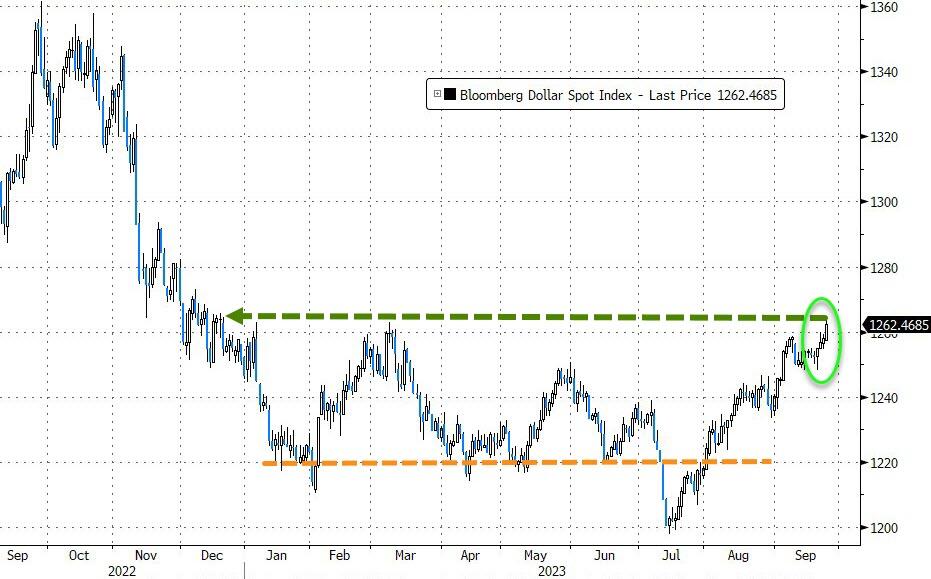
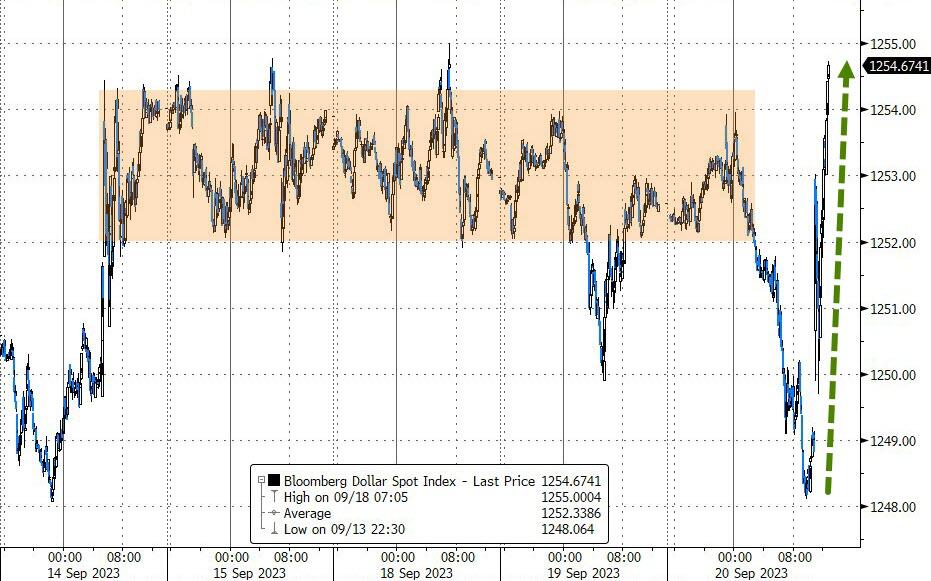
The US Dollar broke out of its trading range to its highest point since December 2022. That move was helped by surging bond yields, with the 10-year exploding higher and reaching October 2007 levels.
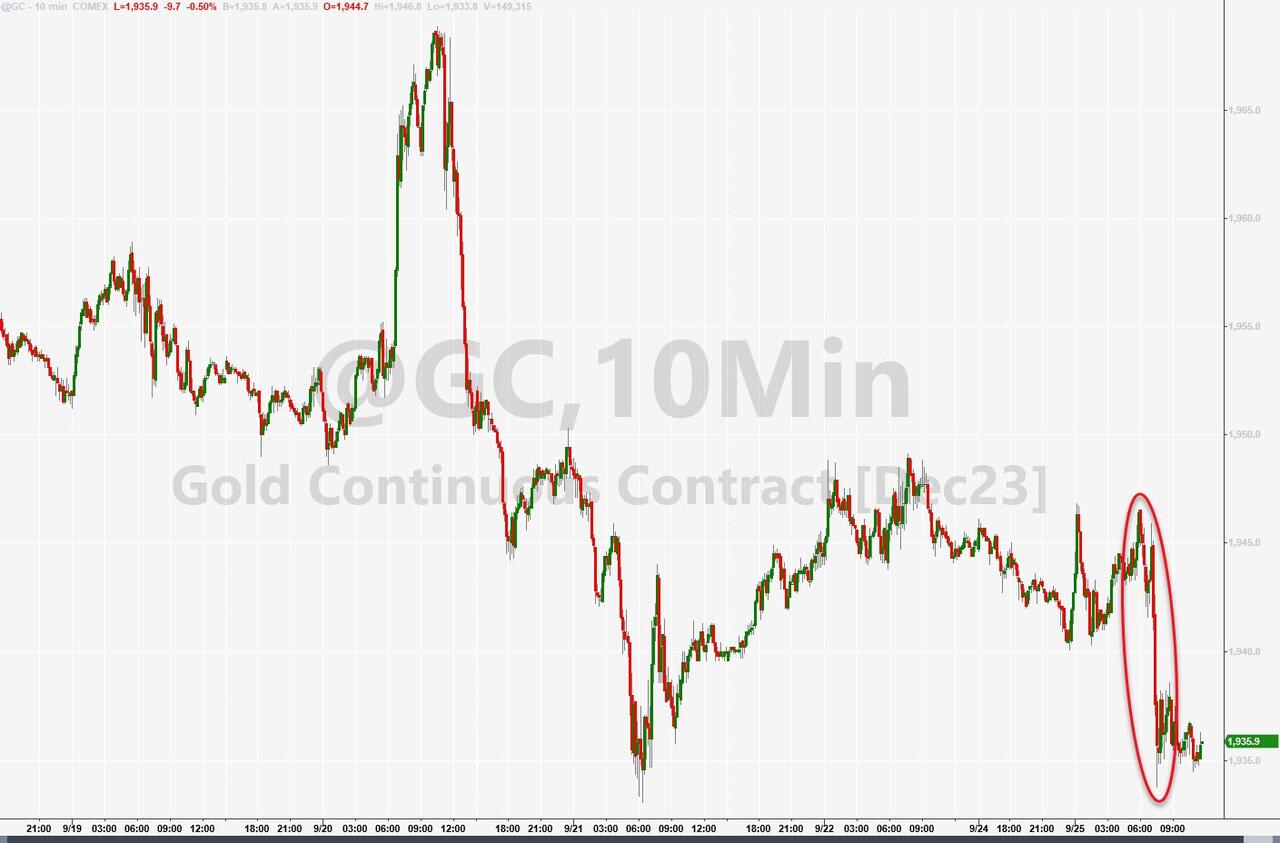
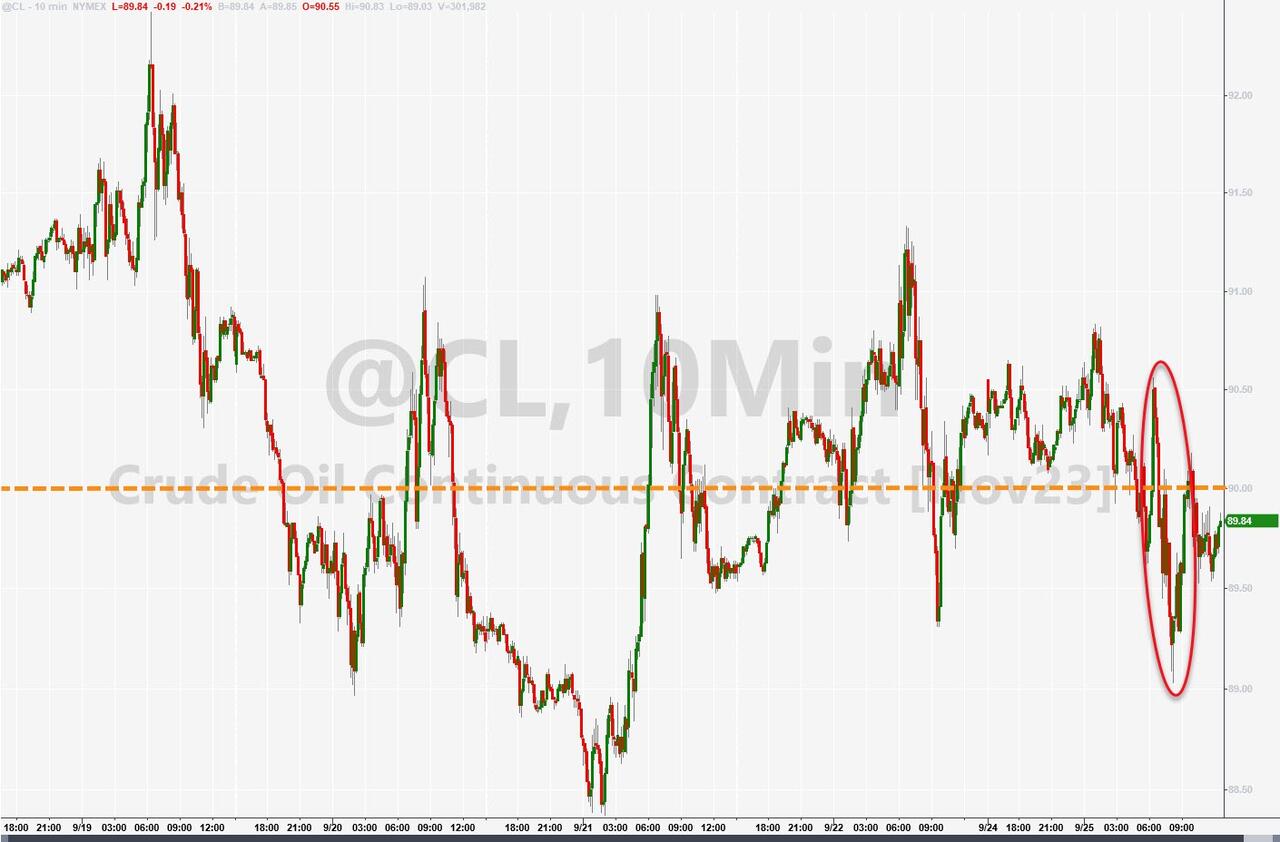
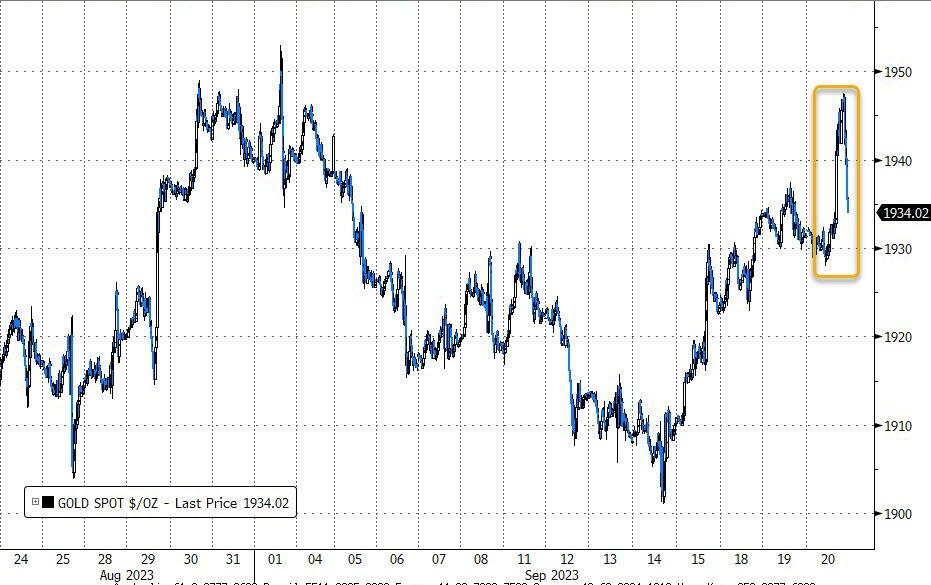
Of course, the dollar’s gains were gold’s losses, as the precious metal tumbled to last week’s lows. Oil prices lagged and ended the day unchanged.
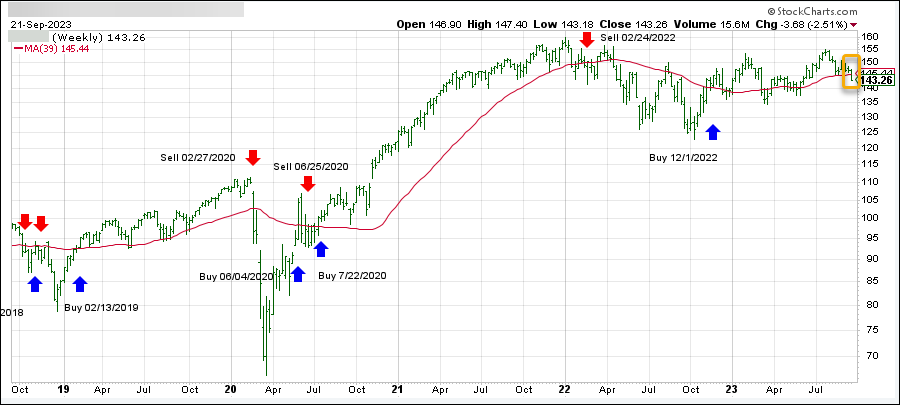
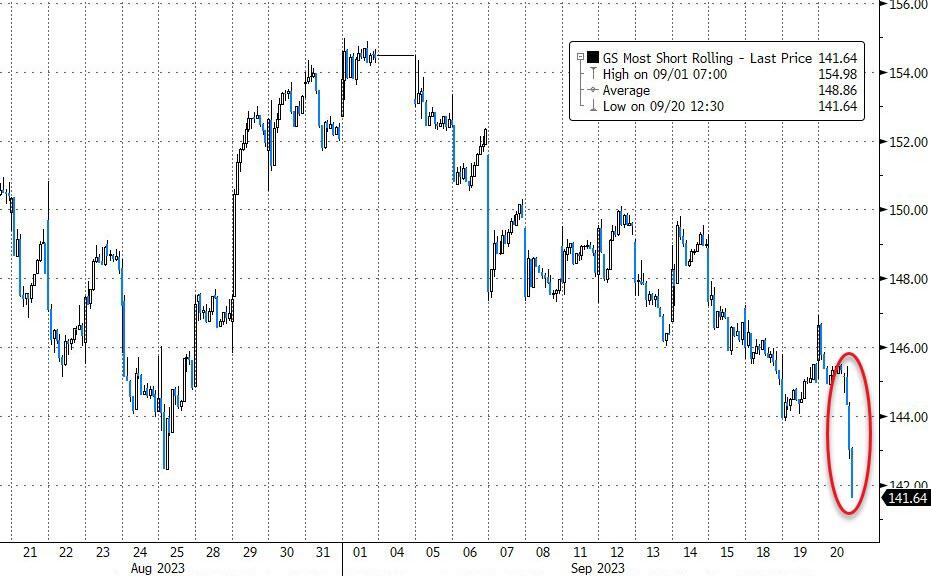
With real rates reaching new cycle highs, valuations on stocks are starting to close the alligator jaw, as this chart shows.
Will it snap shut all the way? Or will it just give us a friendly nibble?
Read More
