Weekly StatSheet For The ETF Tracker Newsletter – Updated Through 06/13/2024

Ulli ETF StatSheet Contact

ETF Data updated through Thursday, June 13, 2024
How to use this StatSheet:

  1. Out of the 1,800+ ETFs out there, I only pick the ones that trade over $5 million per day (HV ETFs), so you don’t get stuck with a lemon that nobody wants to buy or sell.
  1. Trend Tracking Indexes (TTIs)

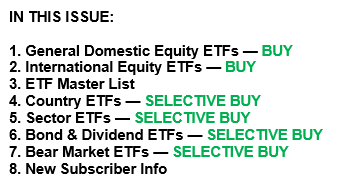
These are the main indicators that tell you when to buy or sell Domestic and International ETFs (section 1 and 2). They do that by comparing their position to their long-term M/A (Moving Average). If they cross above, and stay there, it’s a green light to buy. If they fall below, and keep going, it’s a red light to sell. And to make sure you don’t lose your shirt if things go south, I also use a 12% trailing stop loss on all positions in these categories.

  1. All other investment areas don’t have a TTI and should be traded based on the position of each ETF relative to its own trend line (%M/A). That’s why I call them “Selective Buy.” In other words, if an ETF goes above its own trend line, you can buy it. But don’t forget to use a trailing sell stop of 12%, or less if you’re feeling nervous.

If some of these words sound like Greek to you, please check out the Glossary of Terms and new subscriber information in section 9.

  1. DOMESTIC EQUITY ETFs: BUY— since 11/21/2023
Click on chart to enlarge

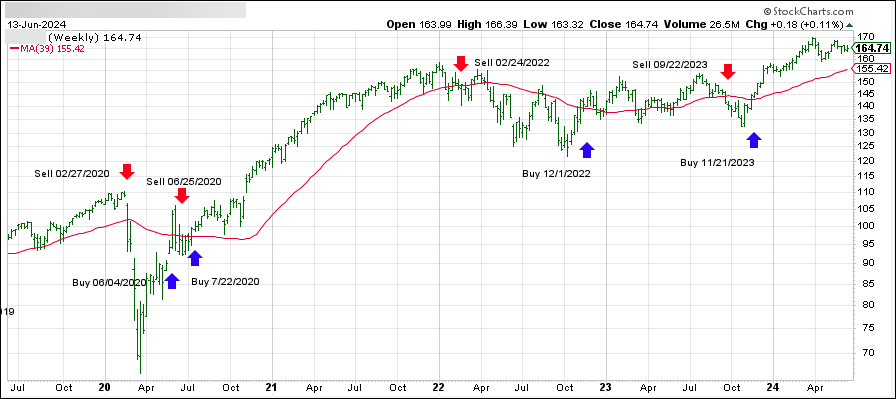
This is our main compass, the Domestic Trend Tracking Index (TTI-green line in the above chart). It has broken above its long-term trend line (red) by +6.32% and is in “Buy” mode as posted.

Read More
Inflation Eases, Equities Rally: Dow Recovers While Jobless Claims Hit 10-Month Peak

Ulli Market Commentary Contact

[Chart courtesy of MarketWatch.com]

  1. Moving the markets

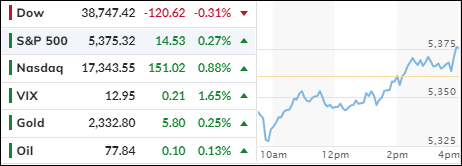
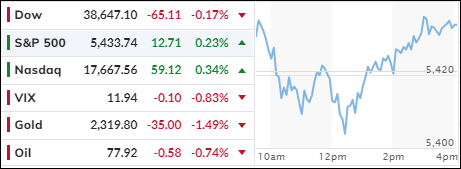
The major indexes wavered with the Dow being the weakling of the day, despite more inflation data showing better-than-expected results.

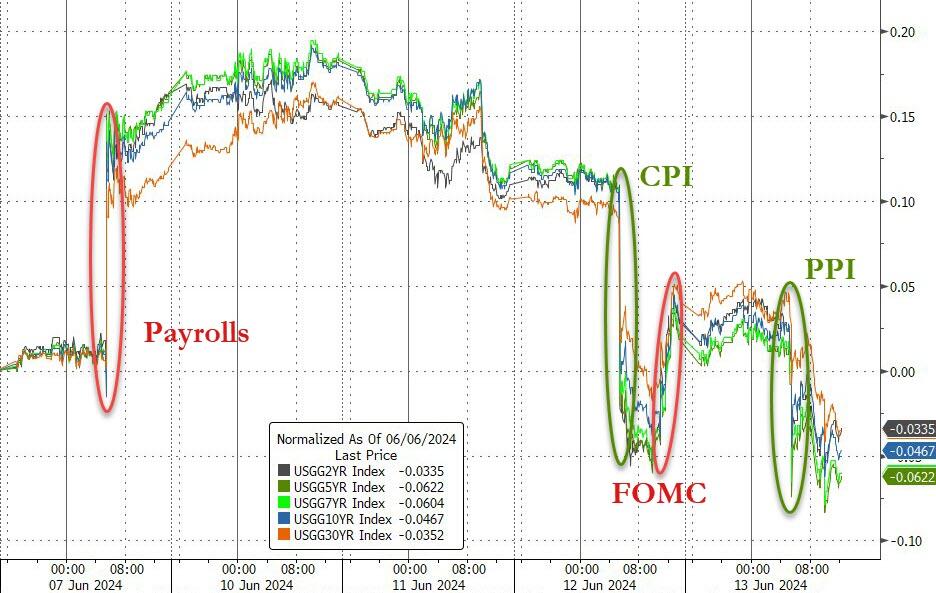
May’s Producer Price Index (PPI), which was anticipated to rise 0.1%, came in lower by 0.2% from the month of April. That sort of confirms the Fed’s view yesterday that “progress has been made on the inflation front.”

Traders are now convinced that the CPI and the PPI have eliminated the always-present possibility of an interest hike, at least for the time being. That should help equities to grind higher and create the summer rally.

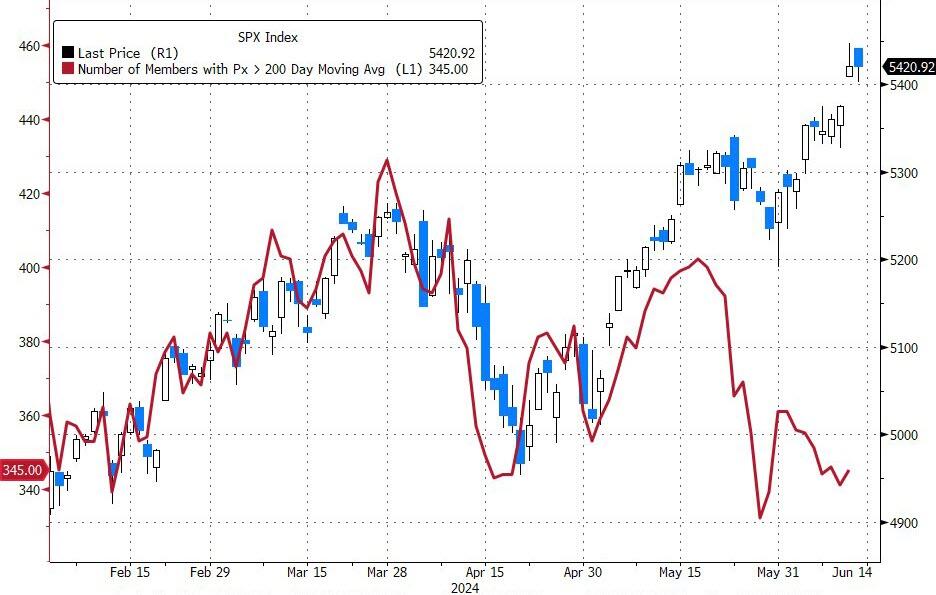
The Dow managed to wipe out most of its early morning losses, while the S&P 500 and Nasdaq knee-jerked and then rebounded to close at new record highs. However, breadth was deplorable and diverged from price action.

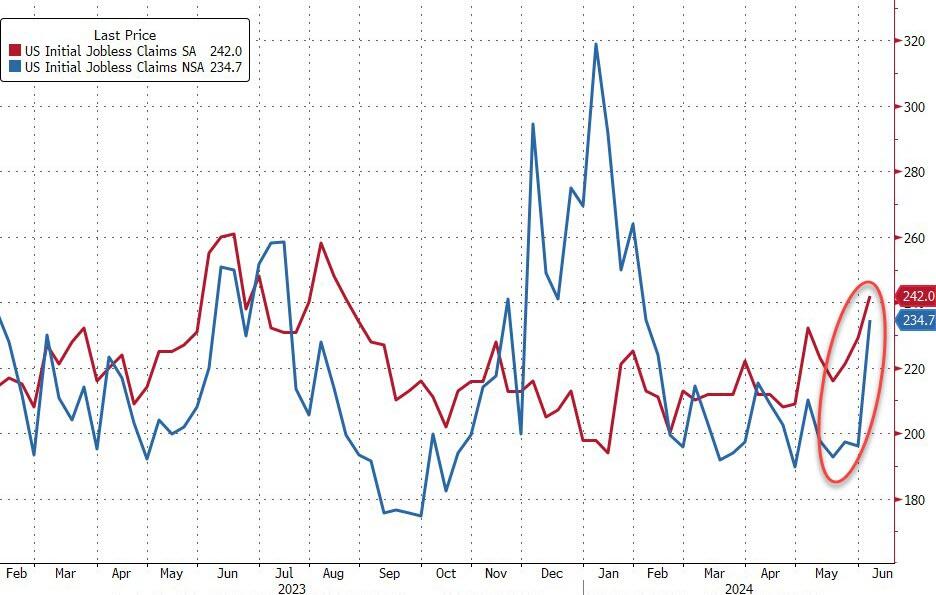
Initial jobless claims surged to 10-month highs, as joblessness soared with California leading the pack. First time applications rose to 242k, much above expectations of 225k and higher from last week’s 229k reading. Continuing claims also headed back above 1.8 million Americans, which was the highest level since January.

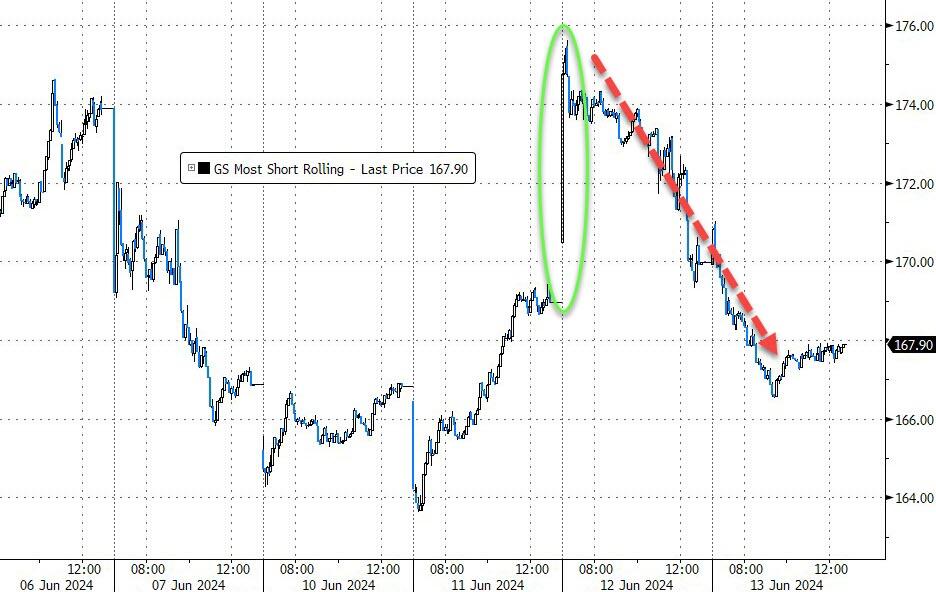
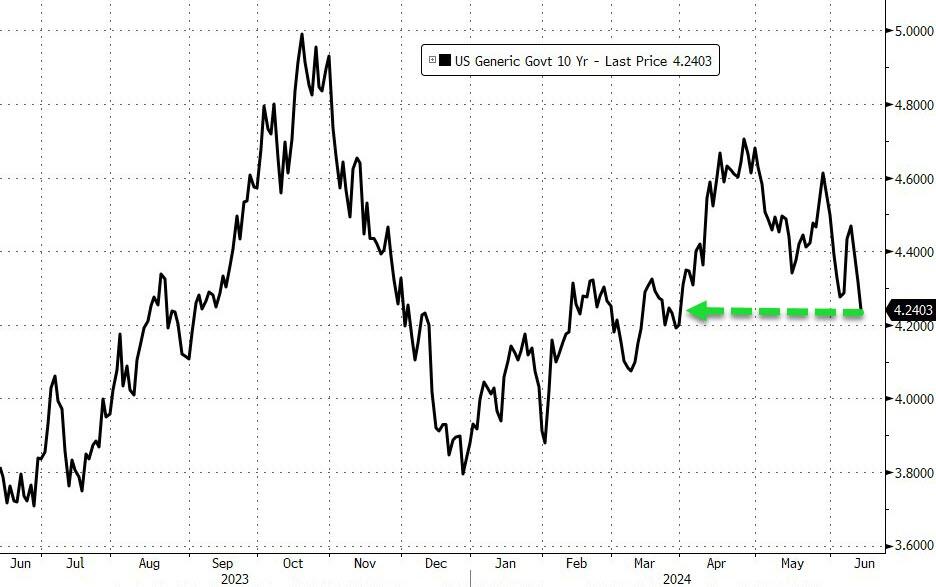
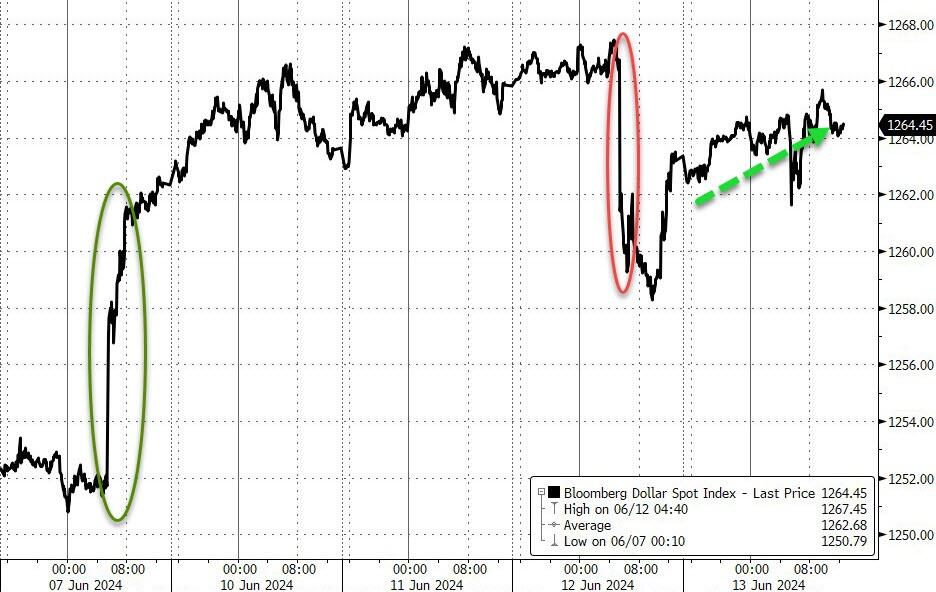
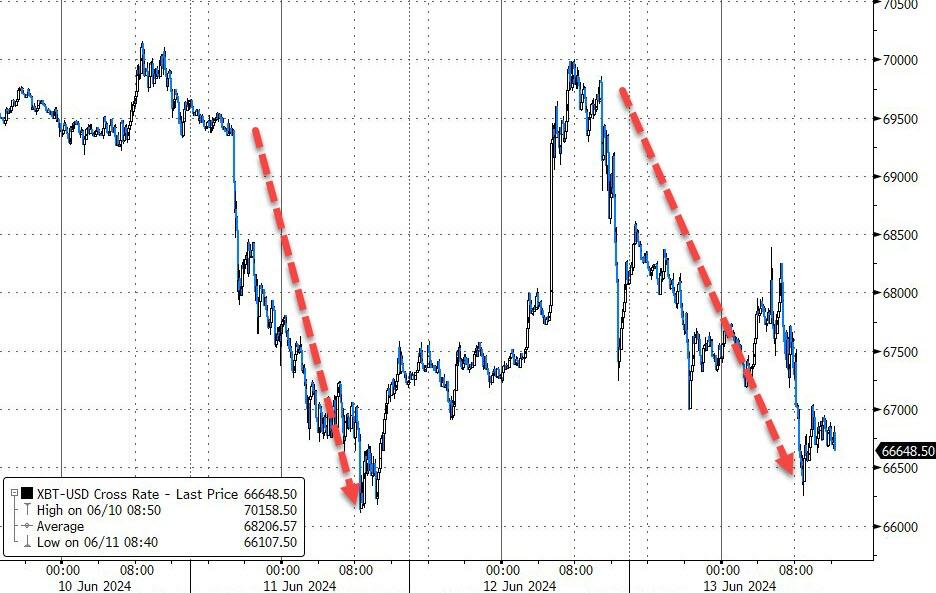
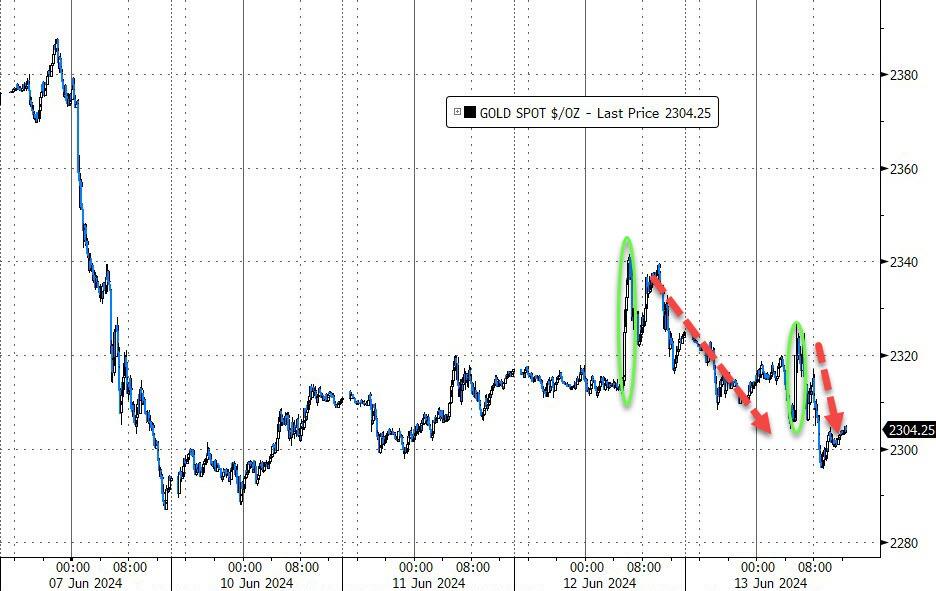
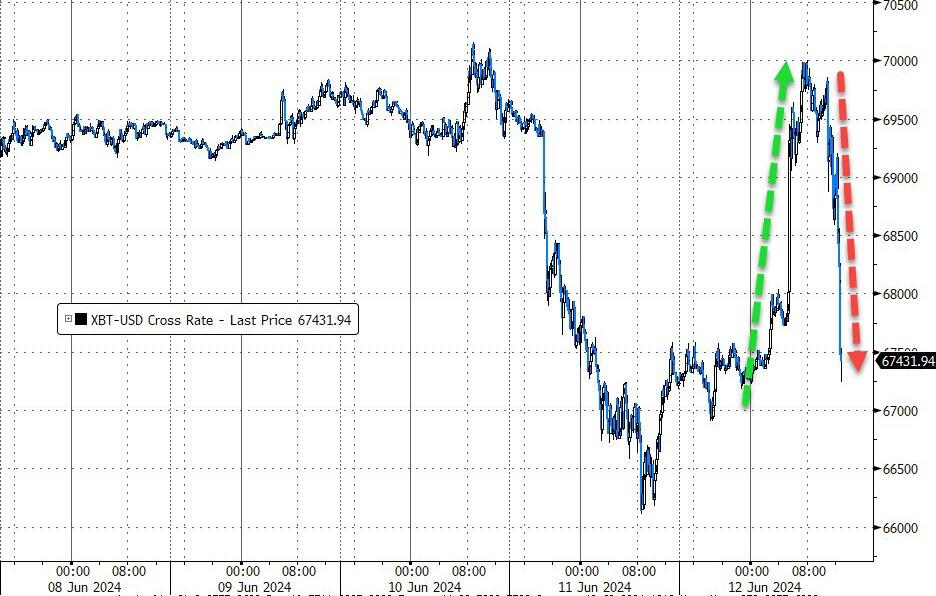
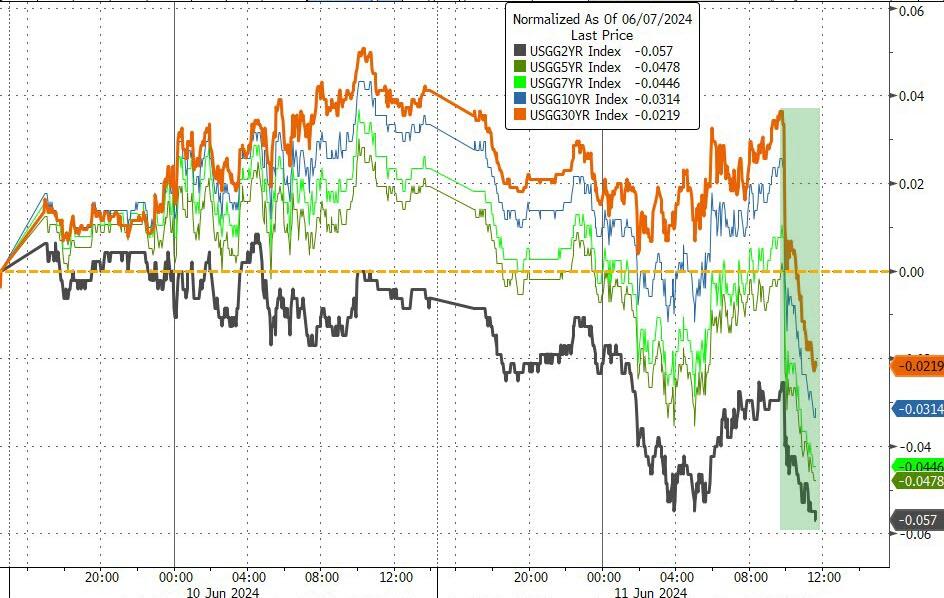
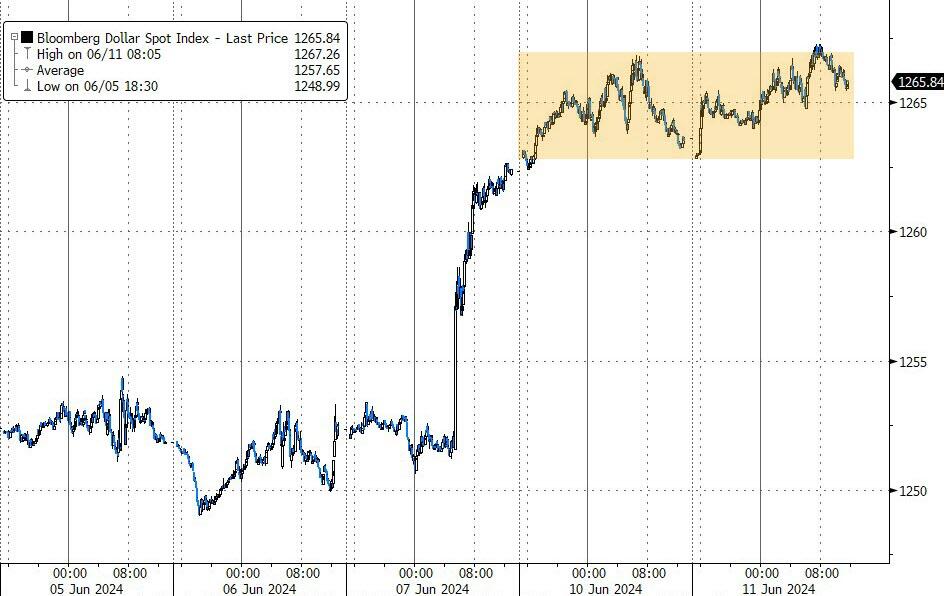
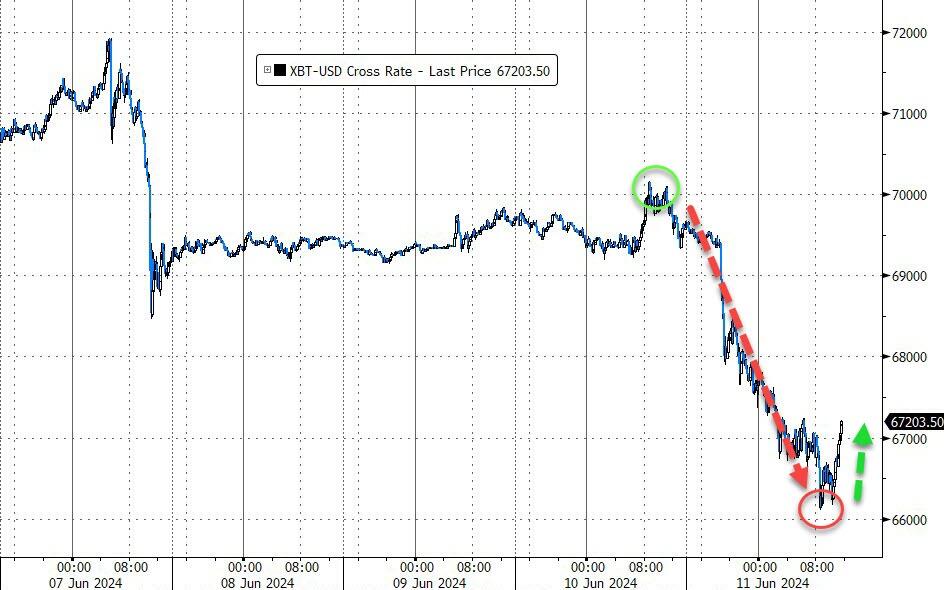
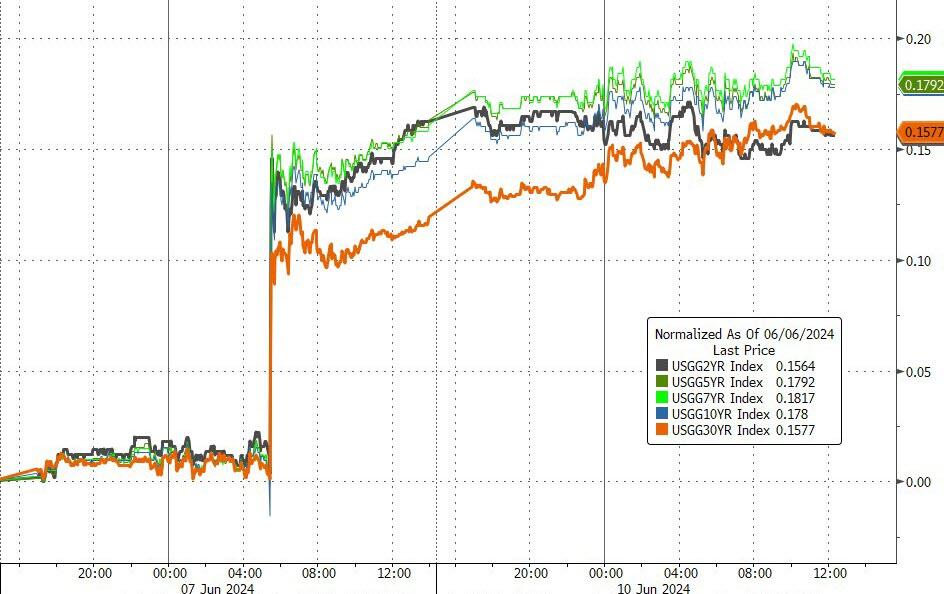
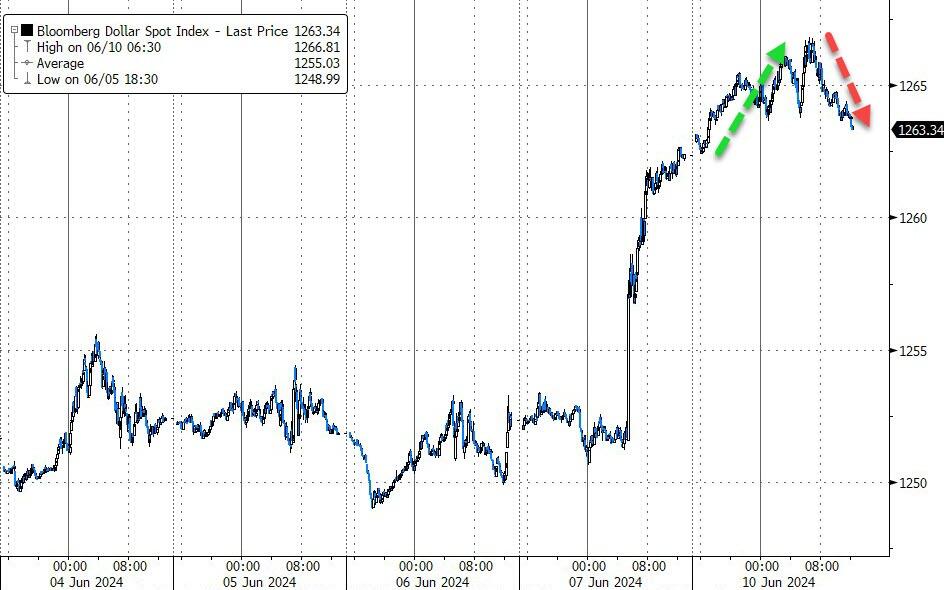
The most shorted stocks continued their decline, bond yields dipped, and the 10-year closed at three-months lows, as ZH pointed out. The dollar edged higher, while Bitcoin retraced yesterday’s gains.  

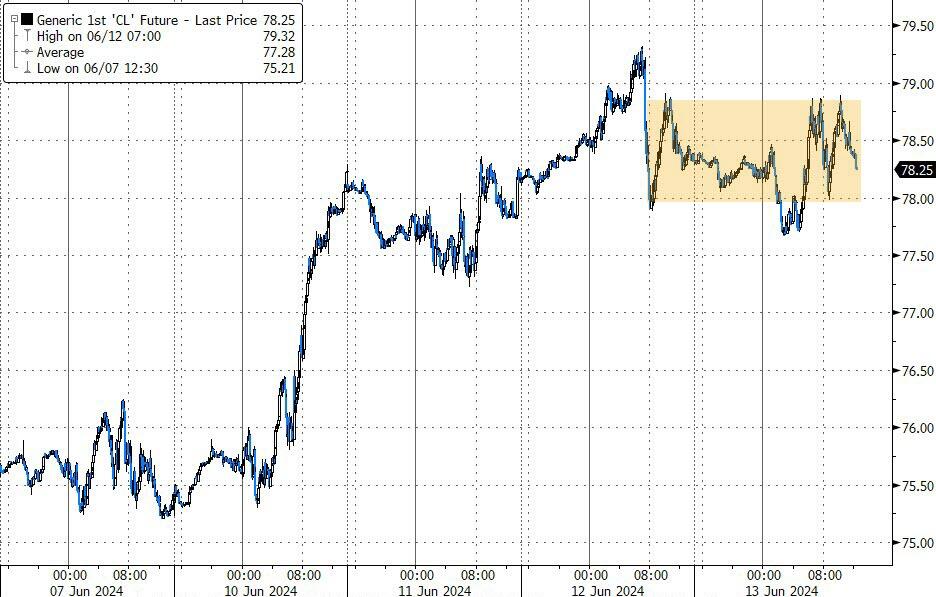
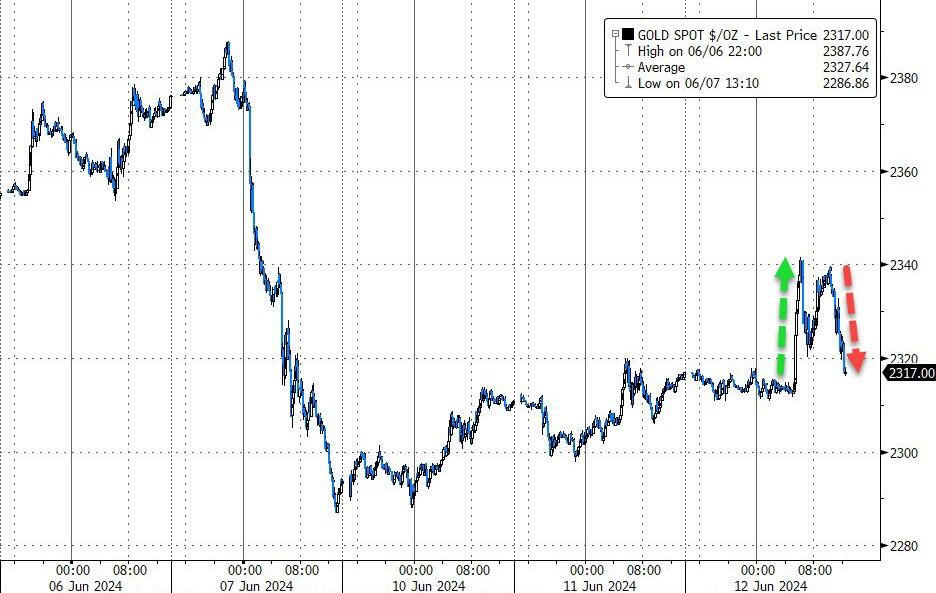
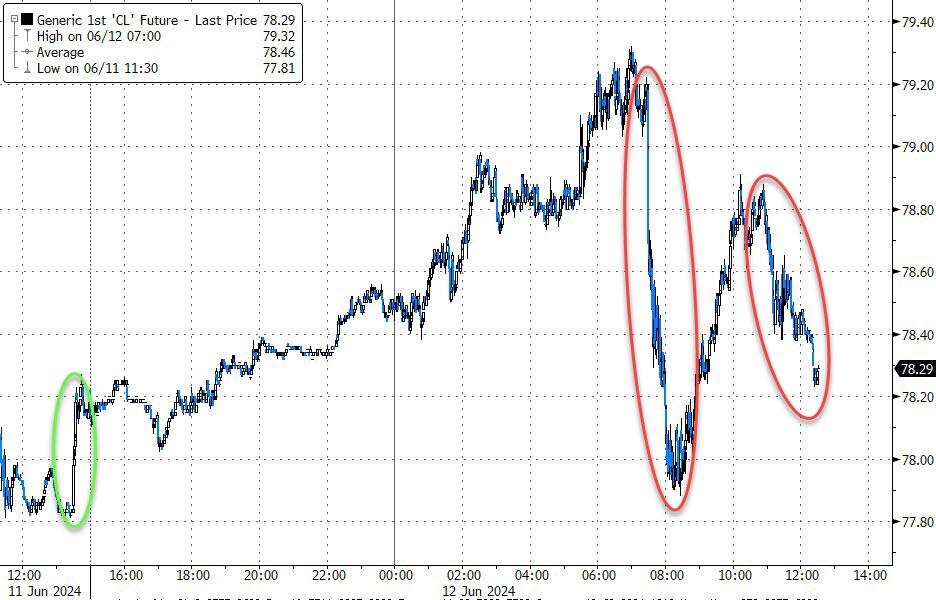
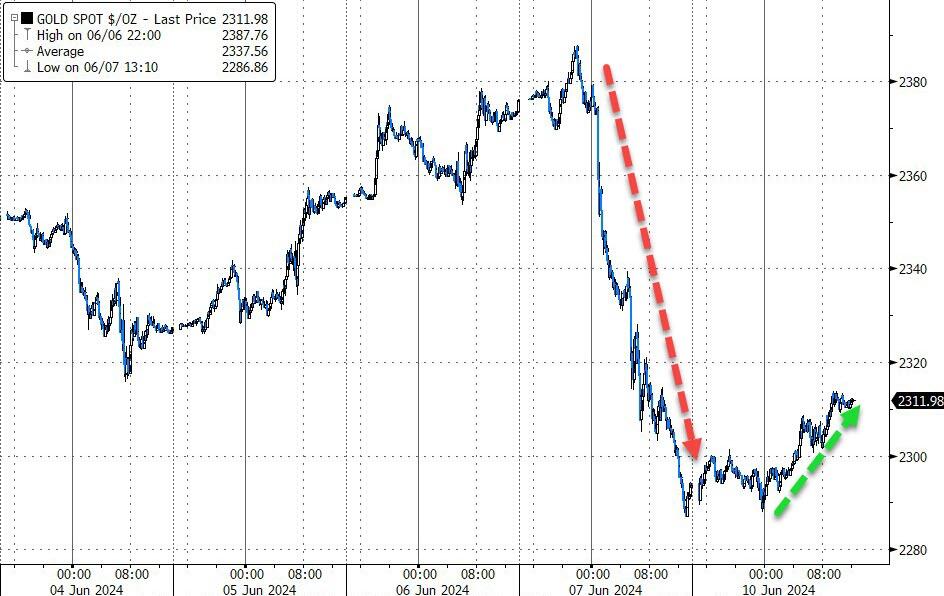
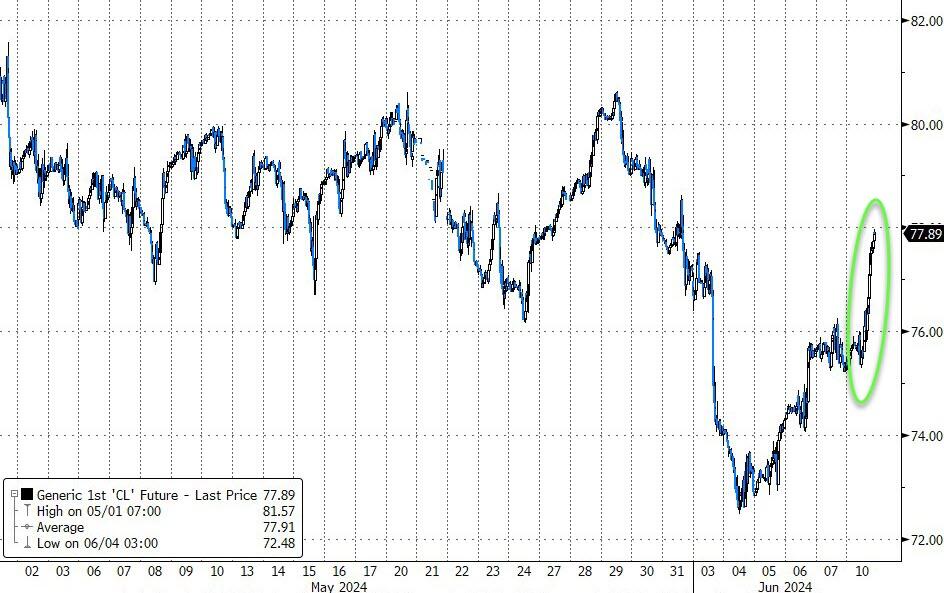
Oil prices zig-zagged but were not able to recapture their $78 level, as gold followed Bitcoins path by giving up yesterday’s advance.

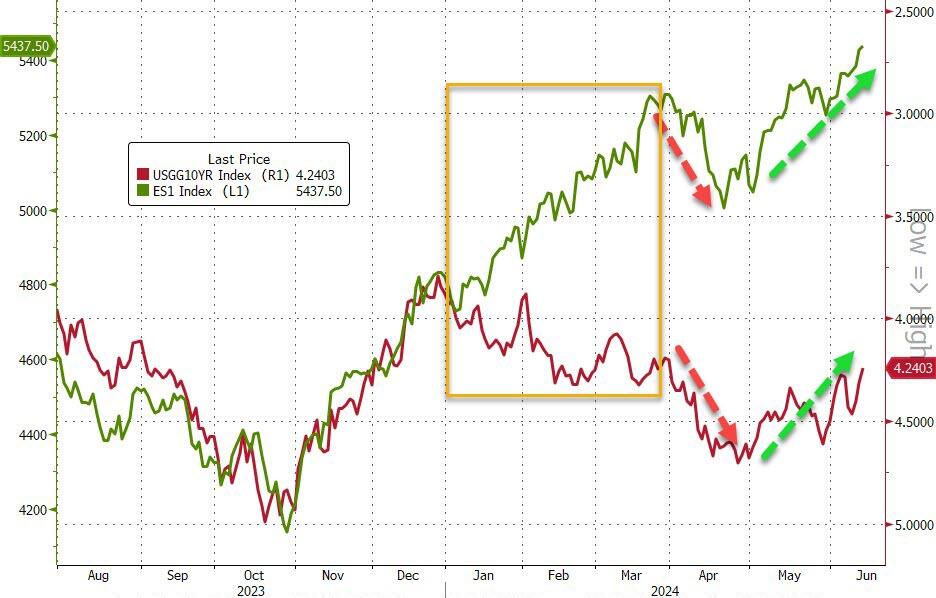
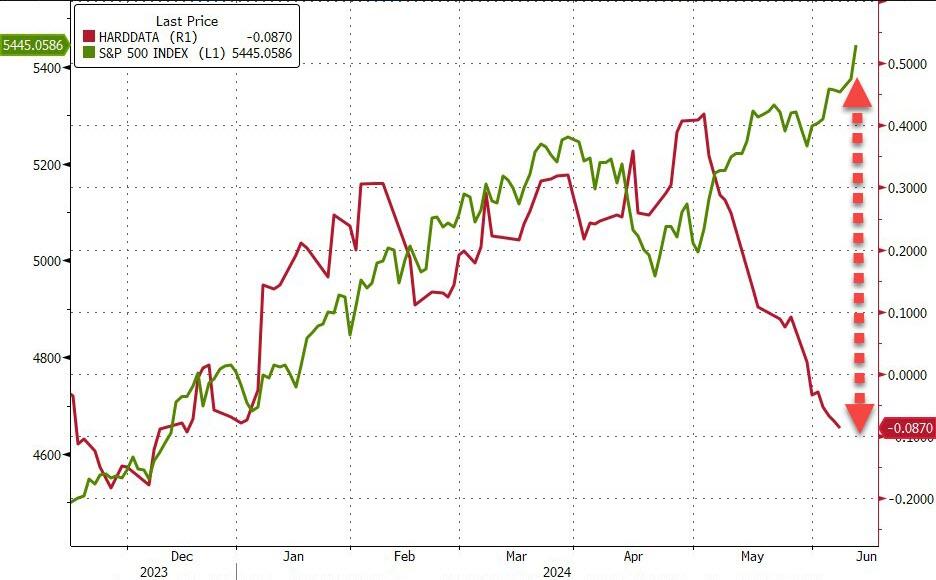
That leaves us with another alligator snout, which prompted ZH to ask:

Which trades first—S&P down to 5,000 or the 10-year yield down to 3.5%?

Read More
Market Roller Coaster: CPI Stability Spurs Rally, Powell’s Caution Curbs Rate-Cut Fever

Ulli Market Commentary Contact

[Chart courtesy of MarketWatch.com]

  1. Moving the markets

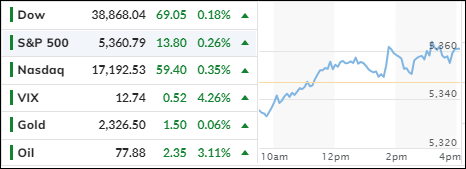
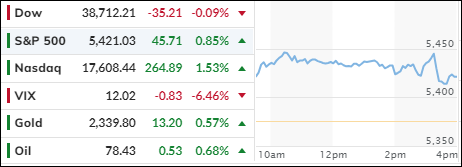
The latest CPI report sent stocks higher and bond yields lower, as the index was unchanged for May vs. an expected 0.1% monthly rise. Year-over-year, the increase was 3.3%, which was also lower than the anticipated 3.4%.

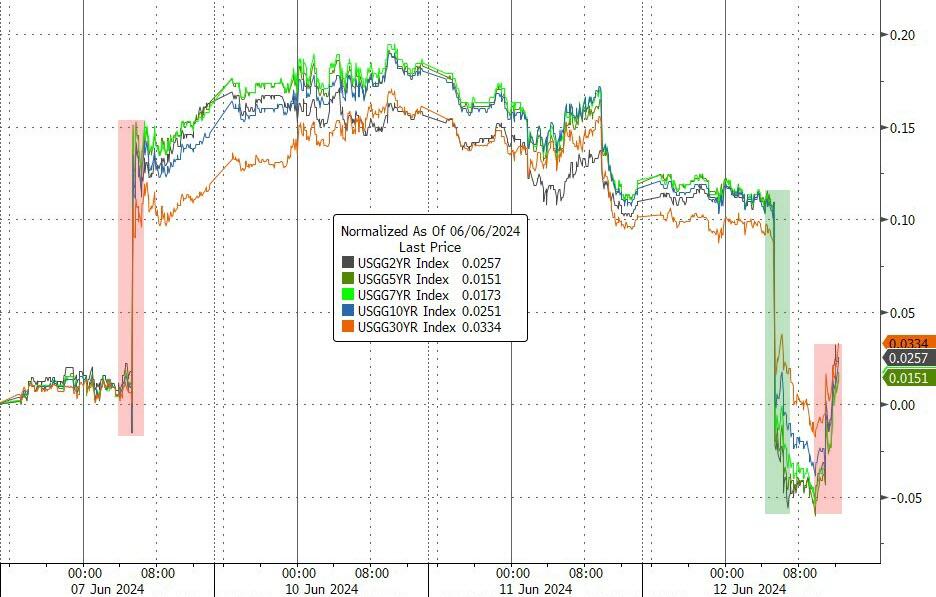
Even the Fed’s favorite gauge, the core CPI, which excludes volatile components like energy and food, was in line with expectations. As a result, the 10-year yield dove some 14 bps to below 4.3% but gave some of it back late in the session.

As projected, the Fed kept interest rates unchanged, while indicating an improvement on the inflation front:

“In recent months, there has been modest further progress toward the Committee’s 2 percent inflation objective.”

However, these encouraging words were offset by remarks that the central bank only sees one rate cut taking place this year, which is quite a turnaround from the expected three at the beginning of 2024.

Here are some other clarifying comments, courtesy of ZH:

  • POWELL: FED PROJECTIONS AREN’T A PLAN, THEY CAN ADJUST
  • POWELL: WE ARE PRACTICING A SLIGHT ELEMENT OF CONSERVATISM ON OUR INFLATION OUTLOOK
  • POWELL: WE’RE ASSUMING GOOD BUT NOT GREAT INFLATION NUMBERS
  • POWELL: WE WELCOME TODAY’S INFLATION READING, HOPE FOR MORE

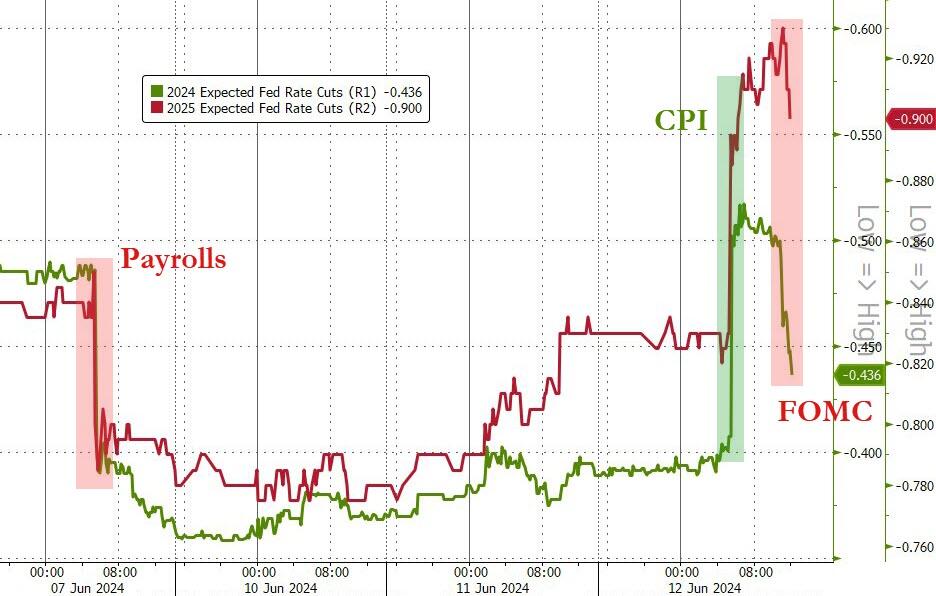
Rate-cut expectations soared after the CPI release, but Powell’s commentary pulled them back down to reality.

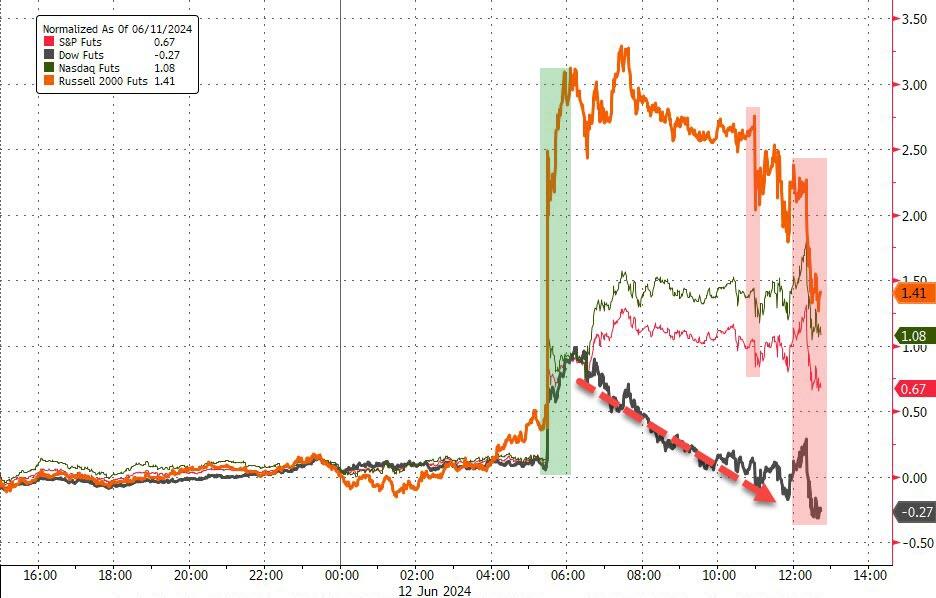
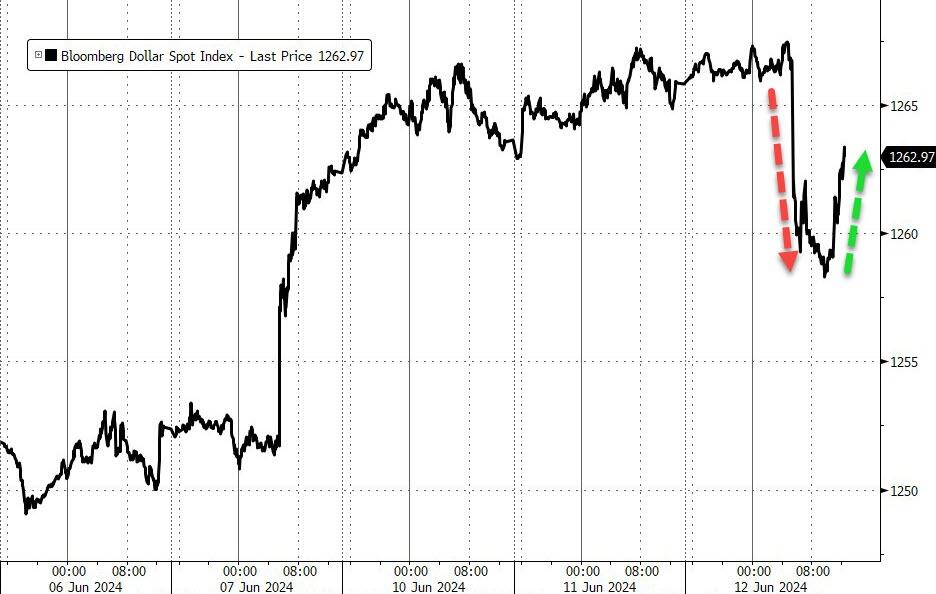
The major indexes followed a similar pattern, with the Dow not being able to maintain its upward momentum, as bond yields dropped sharply at first but rebounded into the close. The dollar ended the day lower but managed to cut its early losses late in the session.

Bitcoin rode the roller coaster and surrendered most of its early advances, with gold following suit but ending with modest gains. Crude oil pumped, dumped, and pumped again to assure a green close.

Hard data points are diverging from the S&P’s relentless move higher. Which way will this alligator snout snap shut?   

Read More
Investors Eye CPI Reading And Fed’s Rate Verdict Amidst Tech Stock Surge

Ulli Market Commentary Contact

[Chart courtesy of MarketWatch.com]

  1. Moving the markets

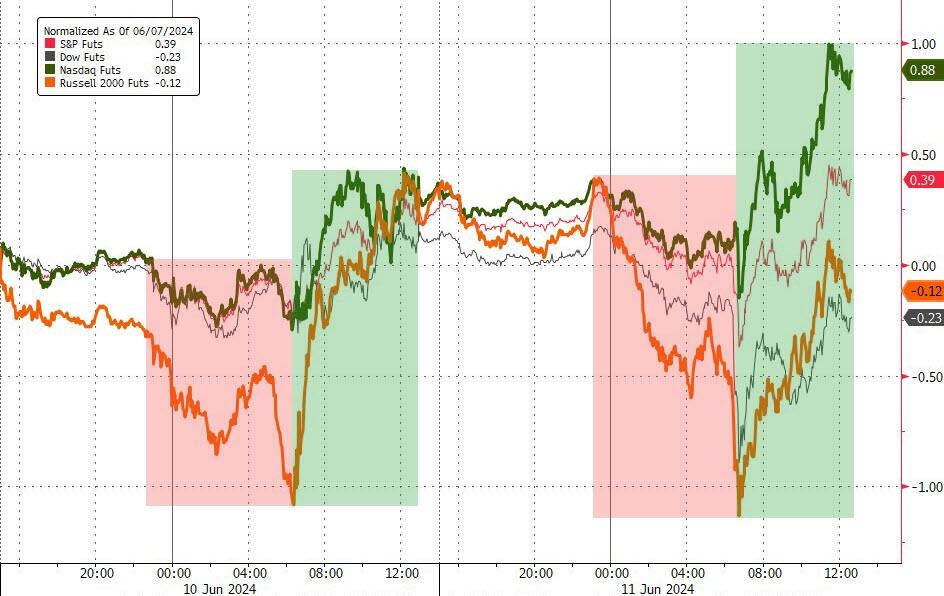
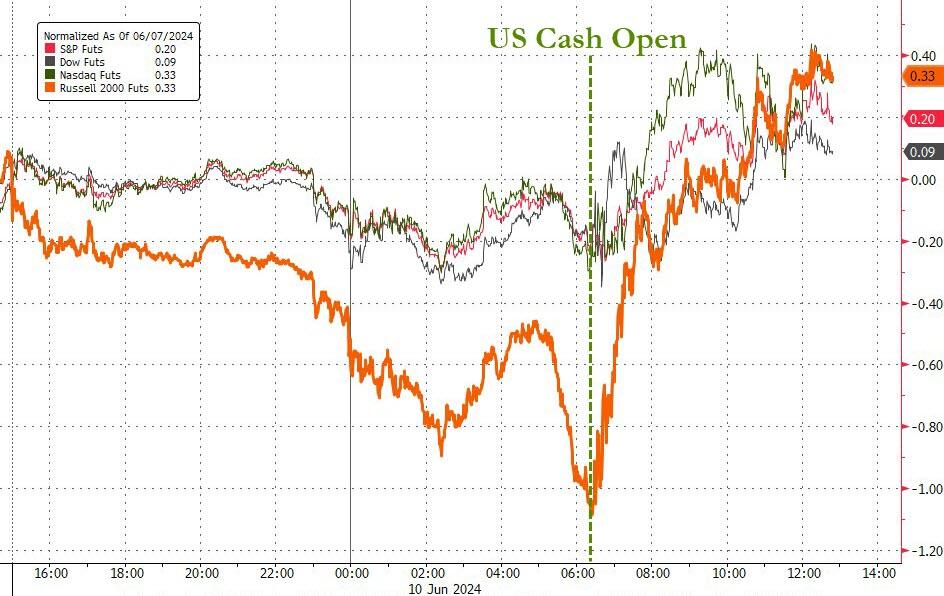
The major indexes started the session in the red, with only the S&P and Nasdaq being able to climb out of that early hole and close in the green, as buying picked up late in the session.

The Fed started its 2-day meeting on interest rates today with the verdict being announced Wednesday after 11 am PST. Traders are concerned that any rate reductions may not occur, but they will analyze every word of Powell’s press conference to find something positive to prop up bullish sentiment and keep the rally going.

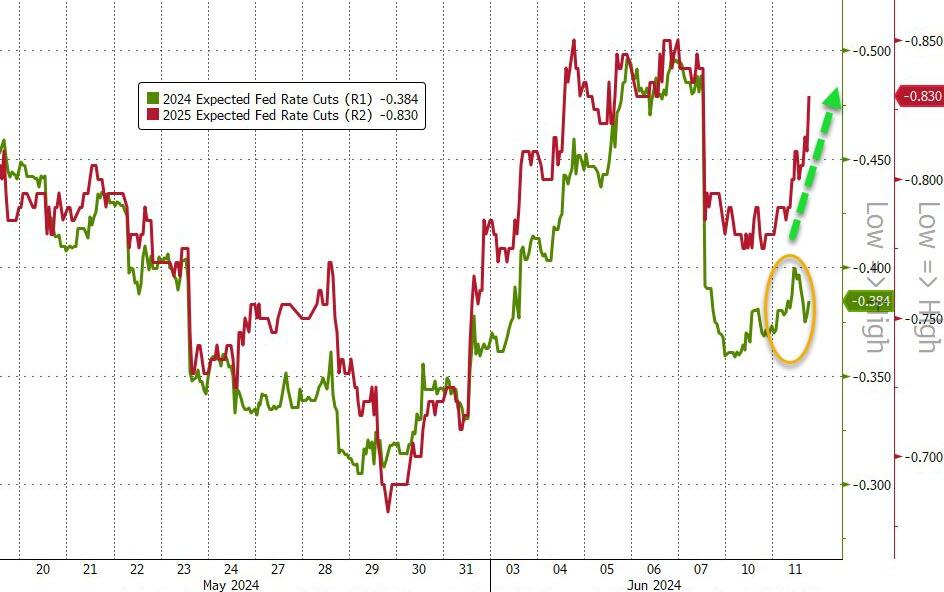
Last week’s strong jobs numbers decreased the chances of an imminent rate cut, and traders now are expecting or hoping for the first cut in November. To me, it looks that the Fed will continue its “higher for longer” theme and not cave to the market’s wishes. That caused a jump in 2025 rate-cut expectations but not much change in 2024.

Adding more uncertainty will be May’s CPI reading, scheduled for release prior to the Fed’s announcement.  

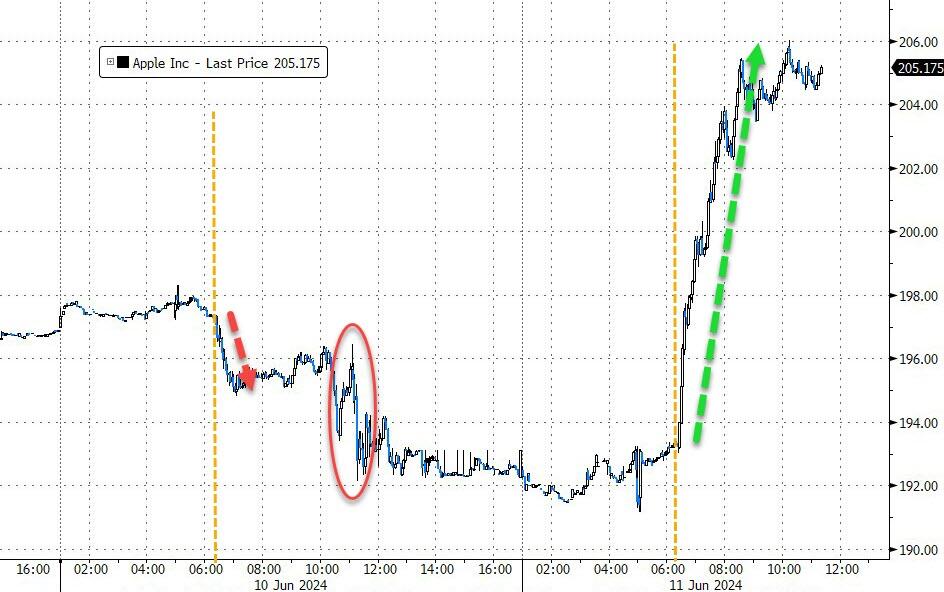
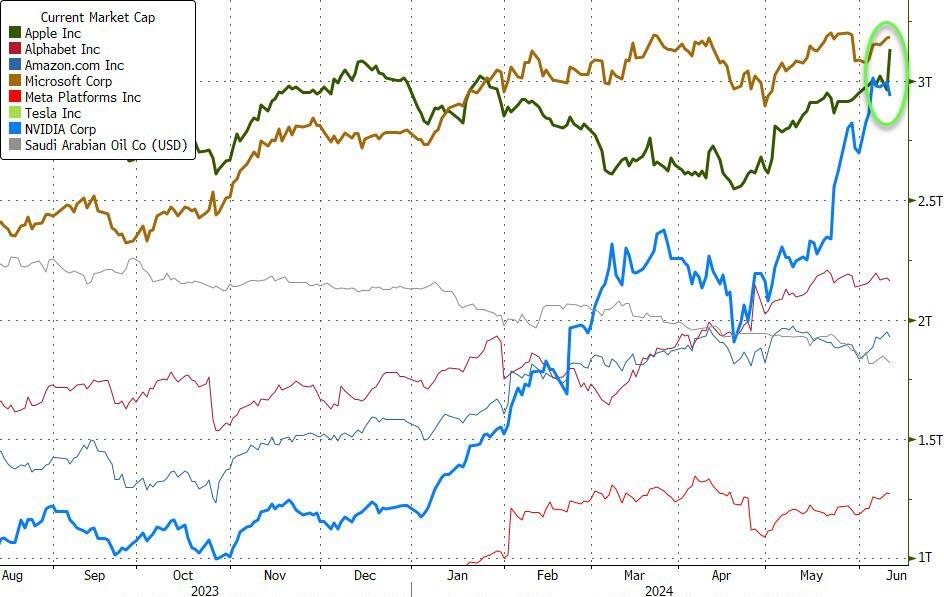
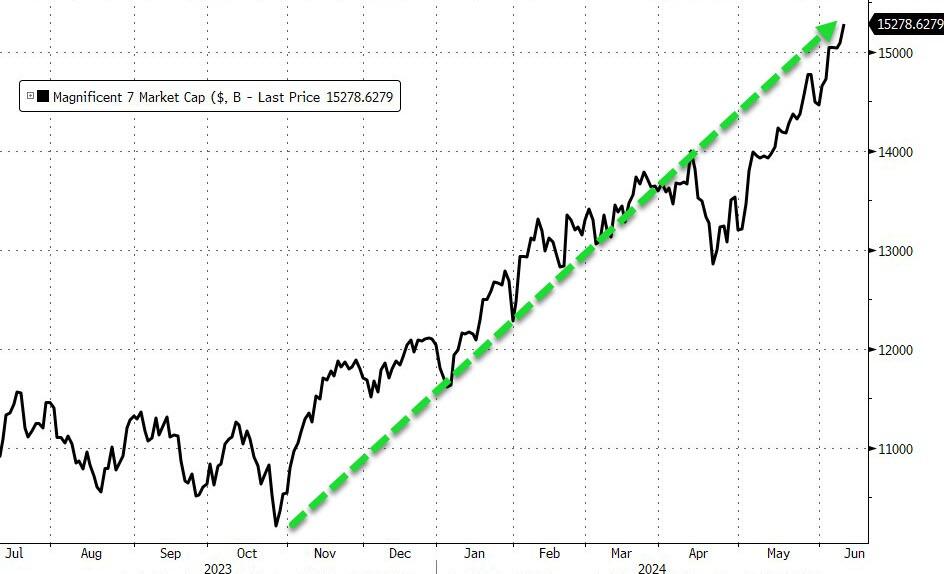
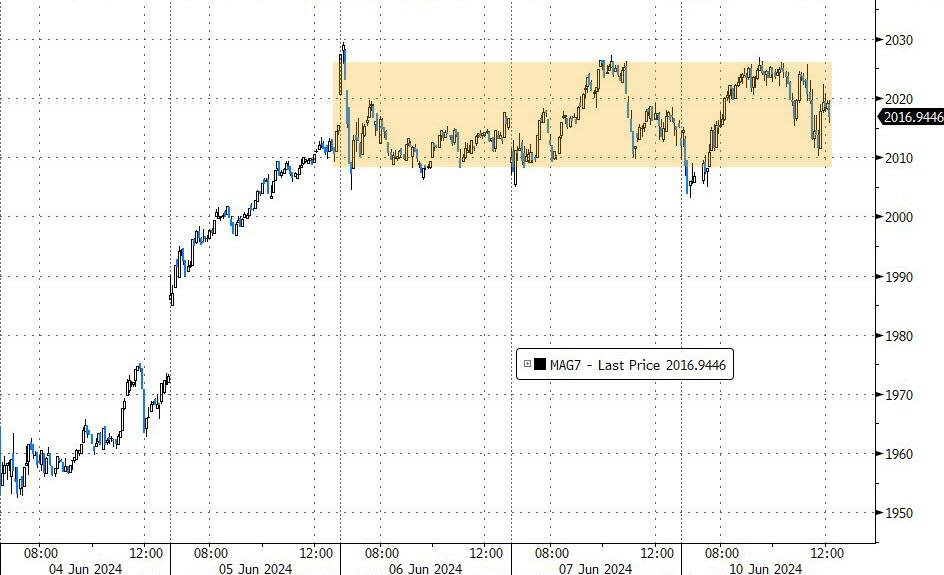
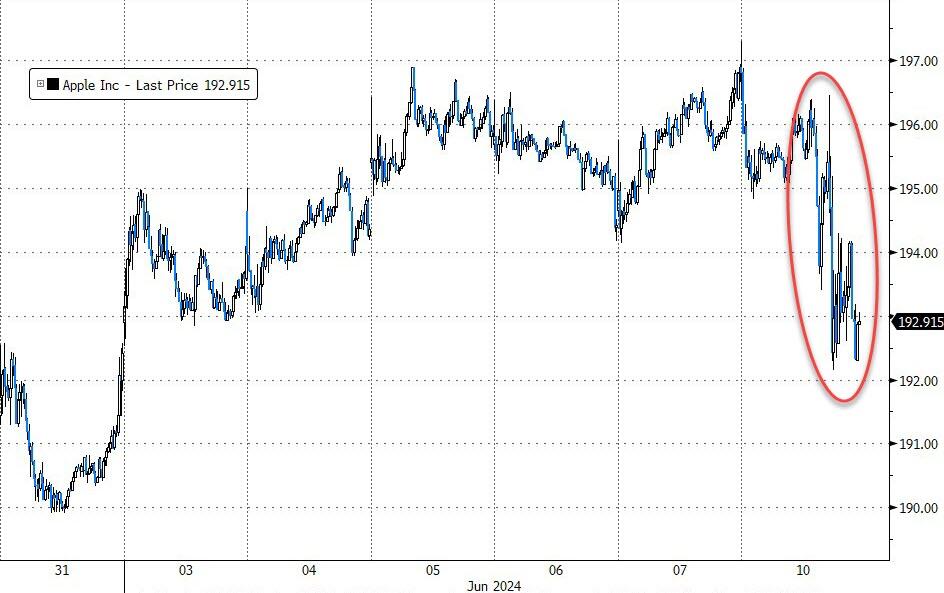
Apple Computers saw a huge surge, with the company now overtaking Nvidia as the second largest market cap company. The MAG 7 stocks stayed their course and rallied.

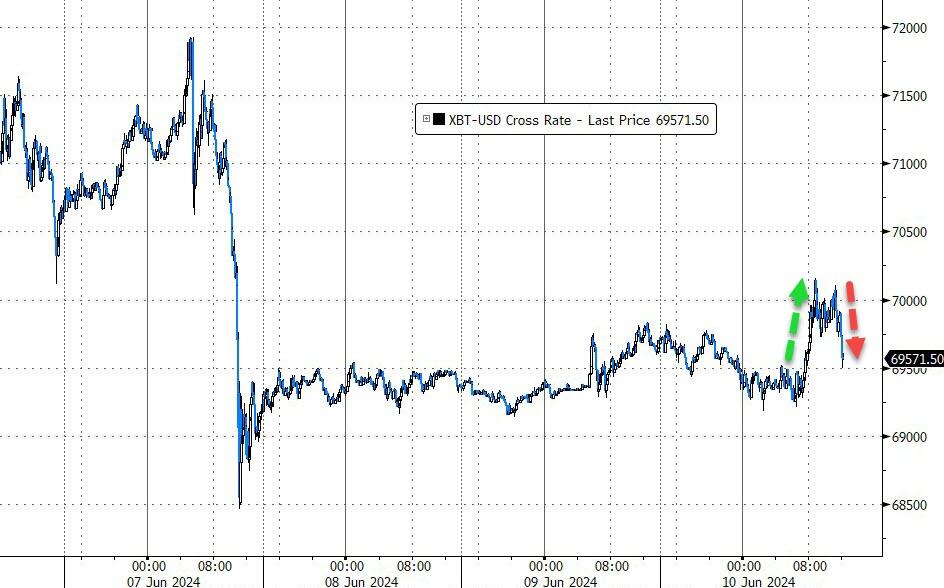
Bond yields pulled back after the recent rally, the dollar rode the range, while Bitcoin surrendered yesterday’s reach for $70k but bounce off its $66k support level.

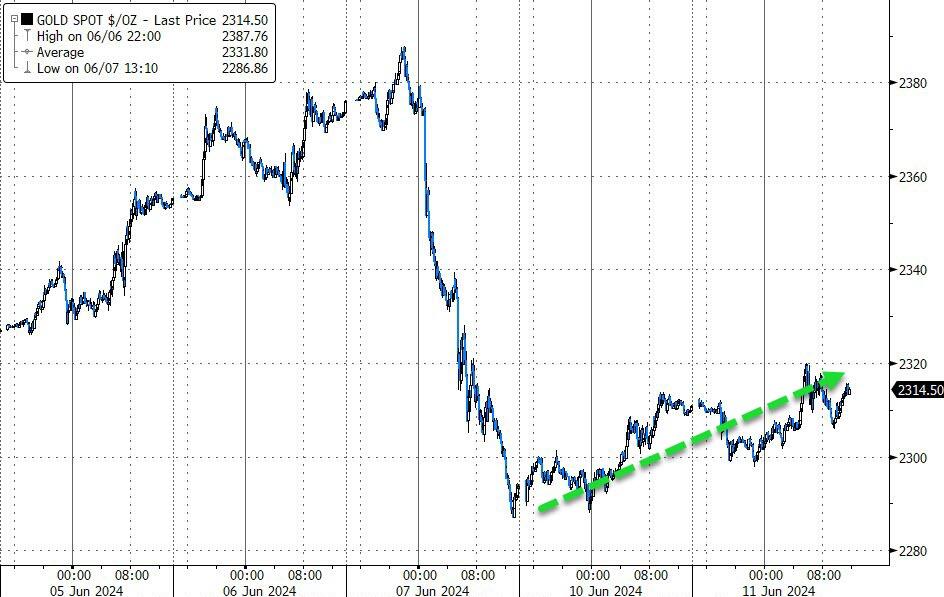
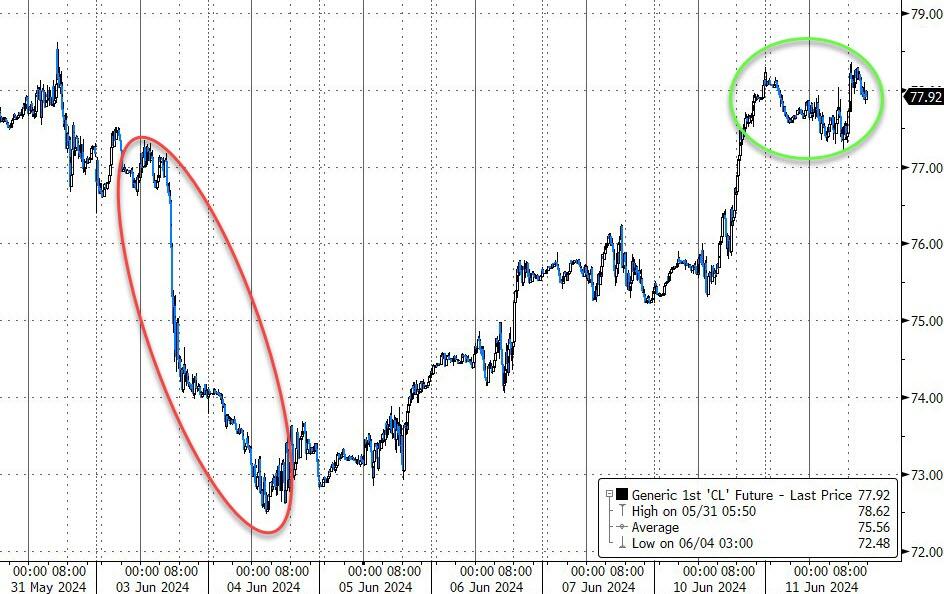
Gold staggered higher for the second day, and oil prices advanced but fell short of reaching the $78 level.

Tomorrow’s CPI and the Fed’s decision on rates will have an impact on market direction, the question is “will it be up or down?”

Read More
Gold And Bitcoin Rebound, Oil Surges Amidst Market Uncertainty Ahead Of CPI Release And Fed’s Rate Verdict

Ulli Market Commentary Contact

[Chart courtesy of MarketWatch.com]

  1. Moving the markets

With the much-anticipated jobs report out of the way, but Wall Street still pondering its implications, the new focus is on the Fed’s interest rate decision and last month’s inflation data.

Both are due out Wednesday with the CPI potentially being a crucial point for market direction. Especially, after Friday’s allegedly strong jobs report, the Fed might continue its present policy of “higher for longer” and not cave in to Wall Street’s relentless hopes of lower rates.

Elsewhere, traders were also watching for any earthshaking new announcements from Apple’s Worldwide Developers Conference, as to any market impacting software products. In the end, their AI message was a somewhat of a disappointment, which was reflected in their stock back peddling.

After overcoming an initial drop, the major indexes recovered and scored moderate gains across the board, despite the wild ride Small Caps participated in. The MAG7 group went sideways, bond yields crept higher, and the dollar bounced and trounced but closed up.   

Gold found a bottom and rebounded, Bitcoin rallied to $70k but pulled back, while crude oil built on recent bullish sentiment and added over 3% but fell just short of reaching $78.

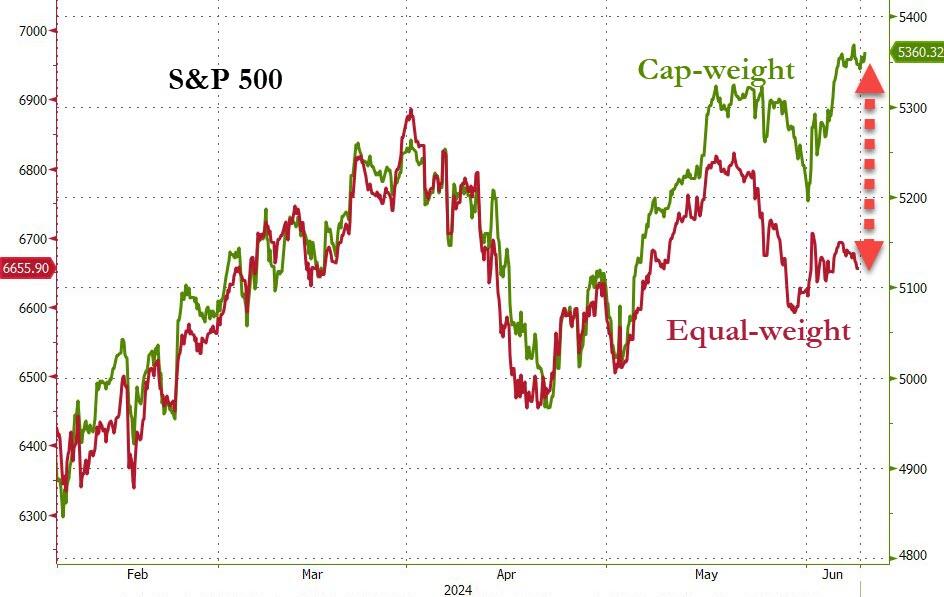
Another divergence could signal trouble for the markets, as ZH pointed out, when looking at the S&P 500, namely the Cap-weighted vs. the Equal-weighted version. This is the largest gap since the peak in 2008/09.   

Hmm. How long can this last?

Read More
ETFs On The Cutline – Updated Through 06/07/2024

Ulli ETFs on the Cutline Contact

Do you want to know which ETFs are hot and which ones are not? Then you need my High-Volume ETF Cutline report. It tells you how close or far each of the 311 ETFs I follow is from its long-term trend line (39-week SMA). These are the ETFs that trade more than $5 million a day, so they are not some obscure funds that nobody cares about.
The report is split into two parts: The winners that are above their trend line (%M/A), and the losers that are below it. The yellow line is the line of shame that separates them. You can see how many ETFs are in each group and how they have changed since the last report (268 vs. 266 current).

Take a peek:

The HV ETF Master Cutline Report

If you are confused by some of the terms we use, don’t panic. I have a helpful Glossary of Terms for you.

If you want to learn more about the Cutline method and how it can make you rich (or at least less poor), read my original post here.