

- Moving the markets
Wall Street was in a good mood as it awaited the earnings reports of some of the biggest tech giants and the Fed’s decision on interest rates.
This week is the peak of the earnings season, with nearly a fifth of the S&P 500 companies revealing their financial performance. The market darlings Microsoft, Apple, Meta, Amazon, and Alphabet — the fab five of tech that have driven this year’s rally — will be among them.
Some other Dow members, such as Boeing and Merck, will also share their quarterly results, but who cares about them, right?
The Fed will also hold its two-day policy meeting starting on Tuesday. Investors are pretty sure the central bank will not change rates. The fed funds futures market gives a 97% chance the Fed will stay put. That’s almost as certain as death and taxes.
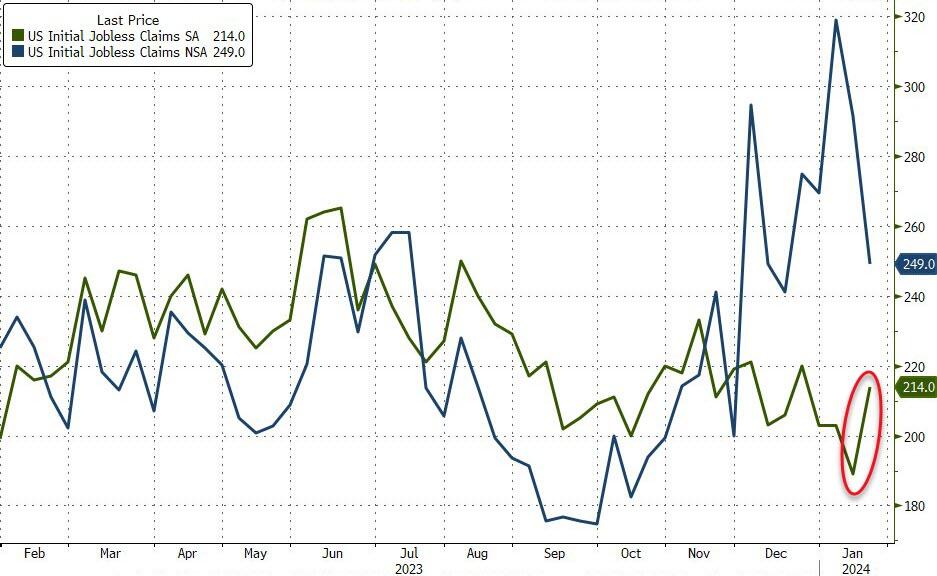
This week is crucial. The market needs to dodge any earnings bombs from the big techs, get some reassurance from the Fed on interest rates, and see some decent but not too spicy jobs numbers. Otherwise, the party might be over.
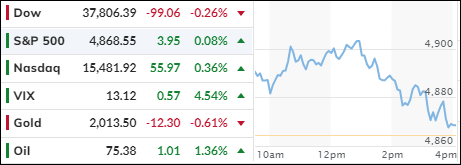
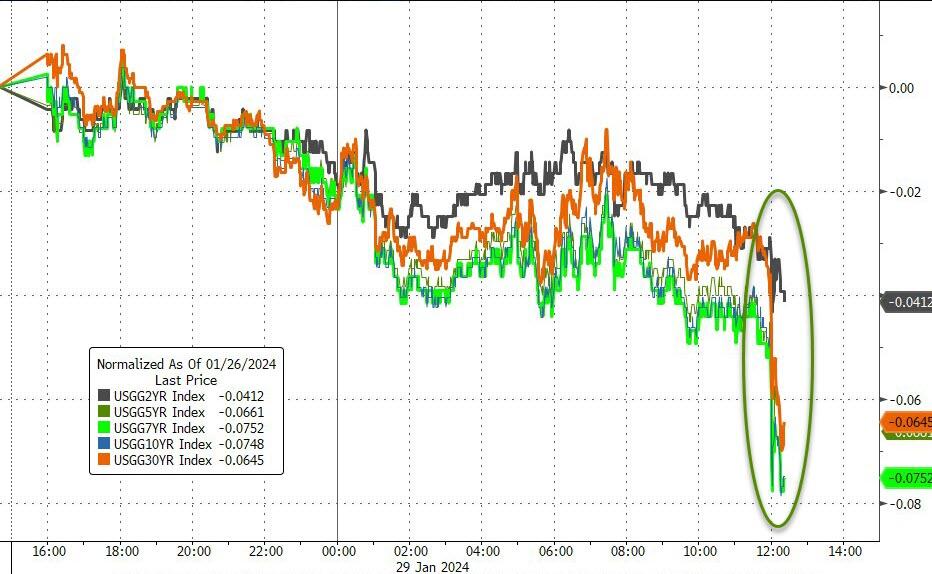
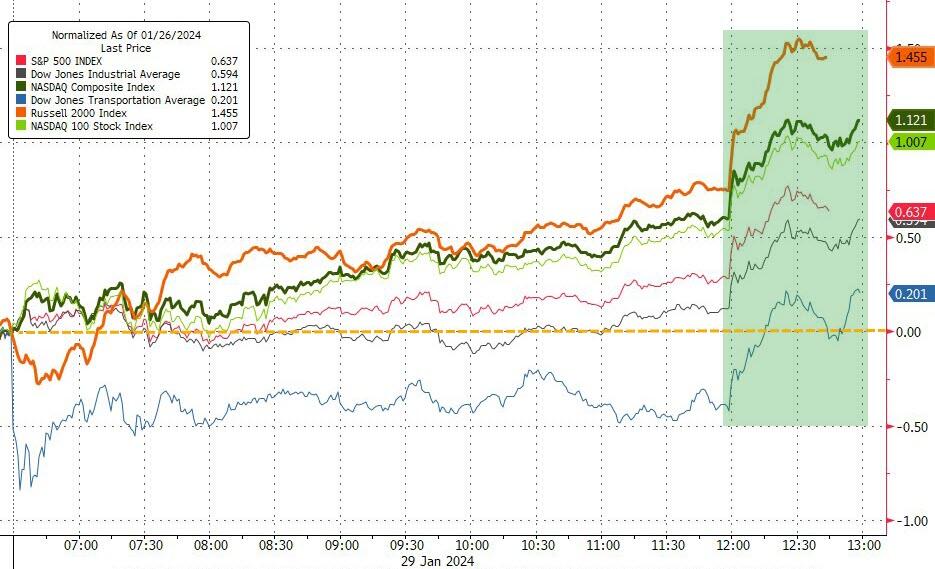
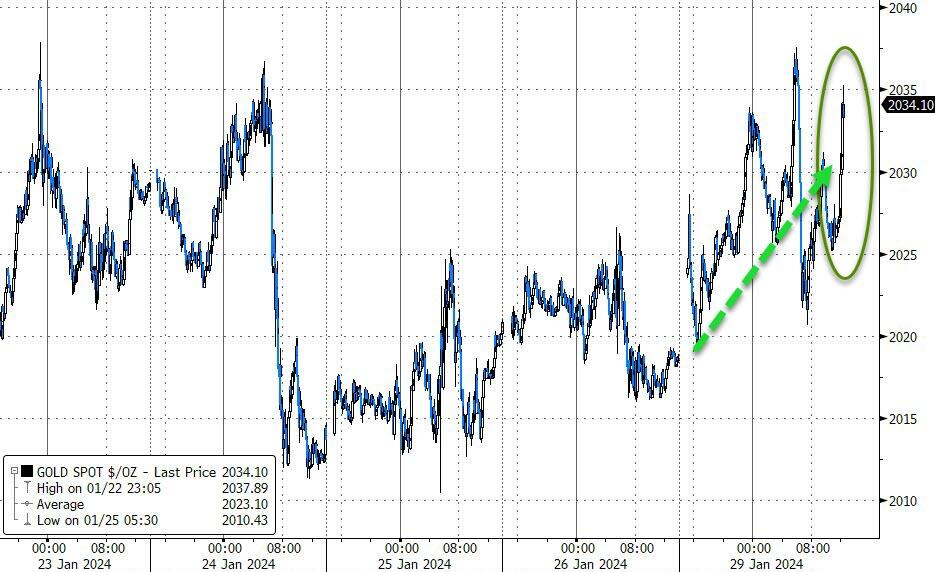
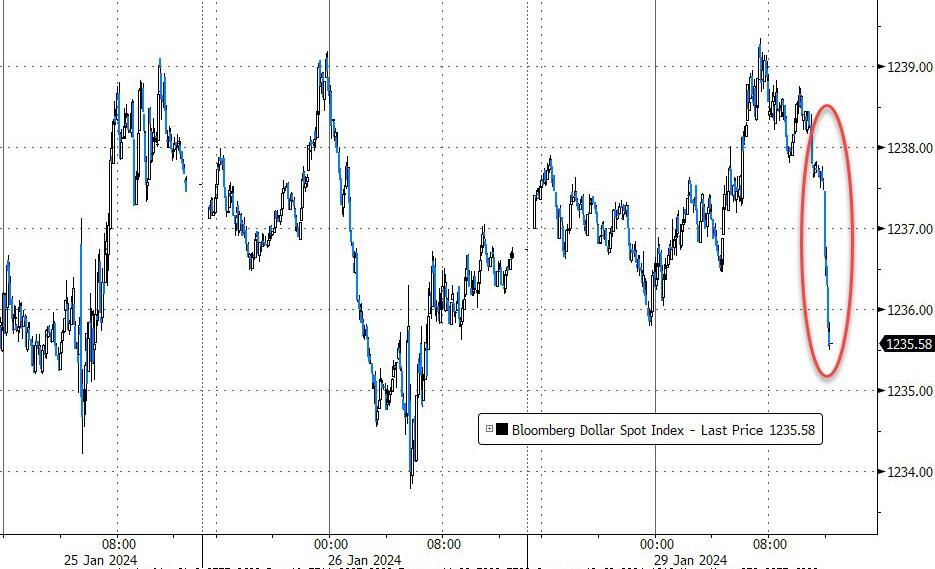
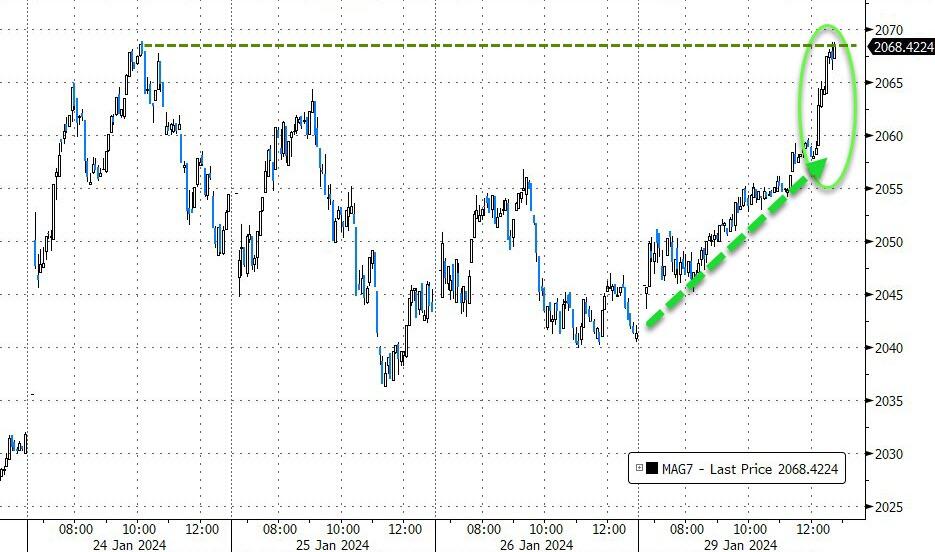
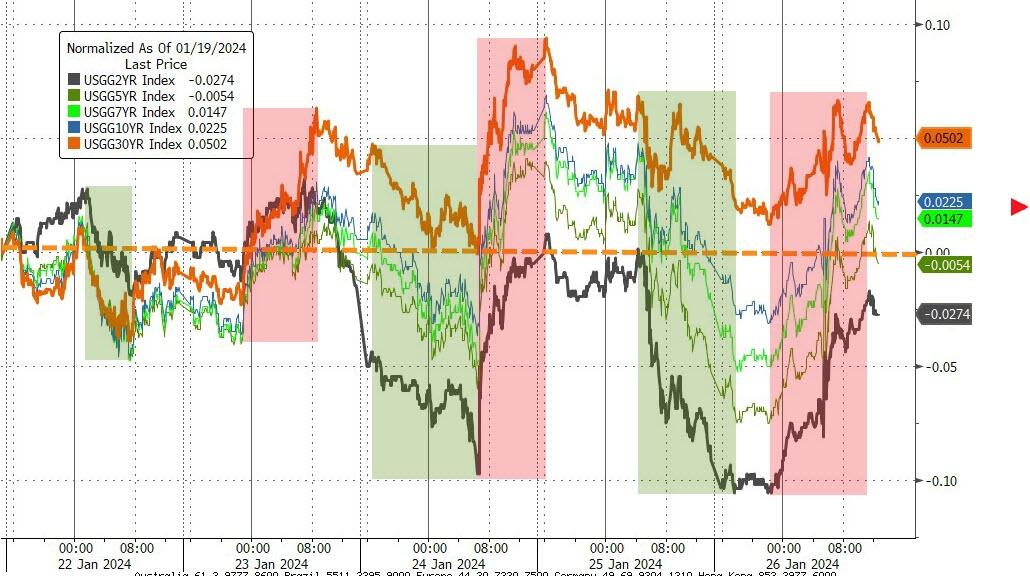
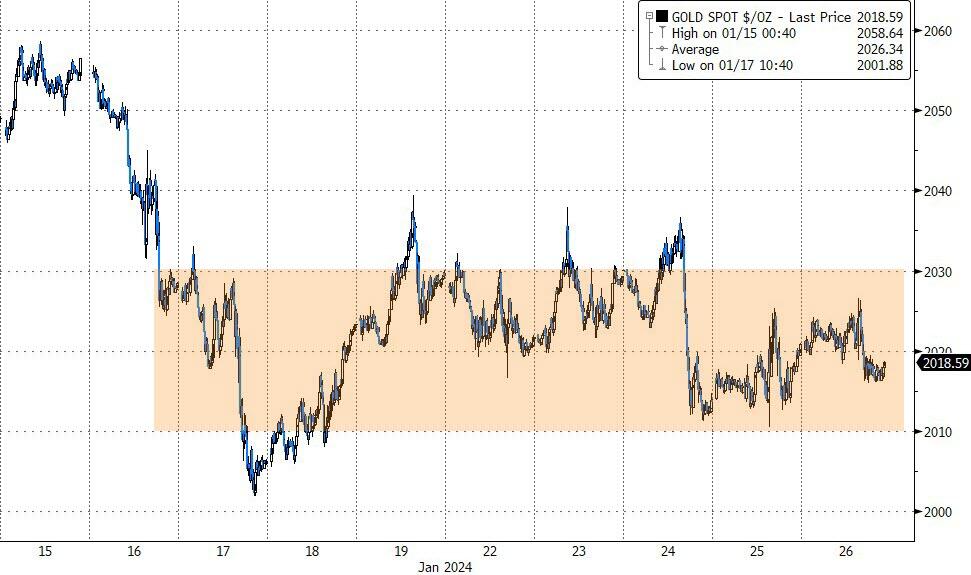
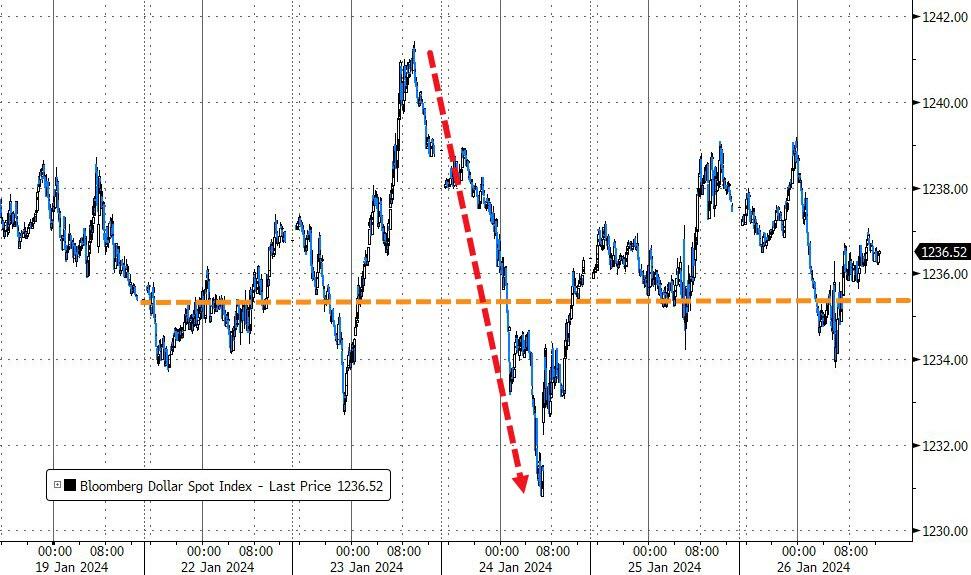
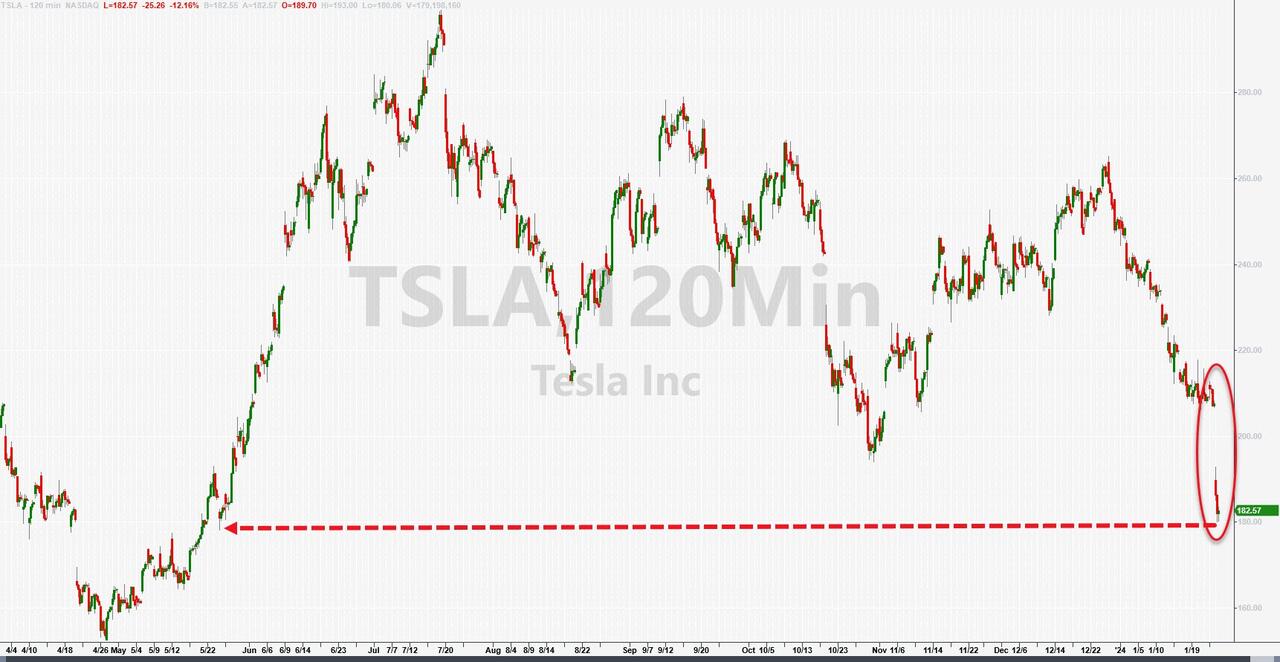
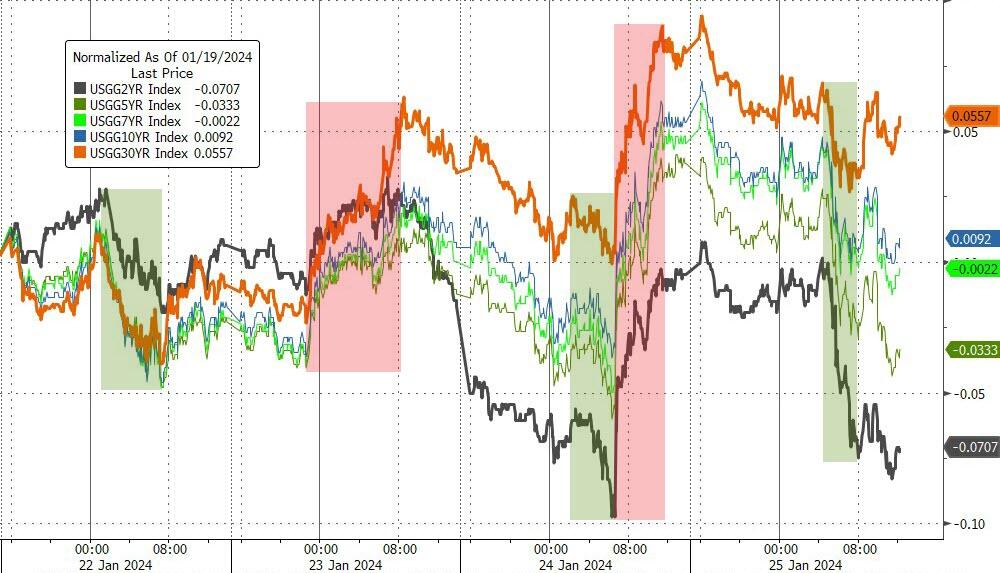
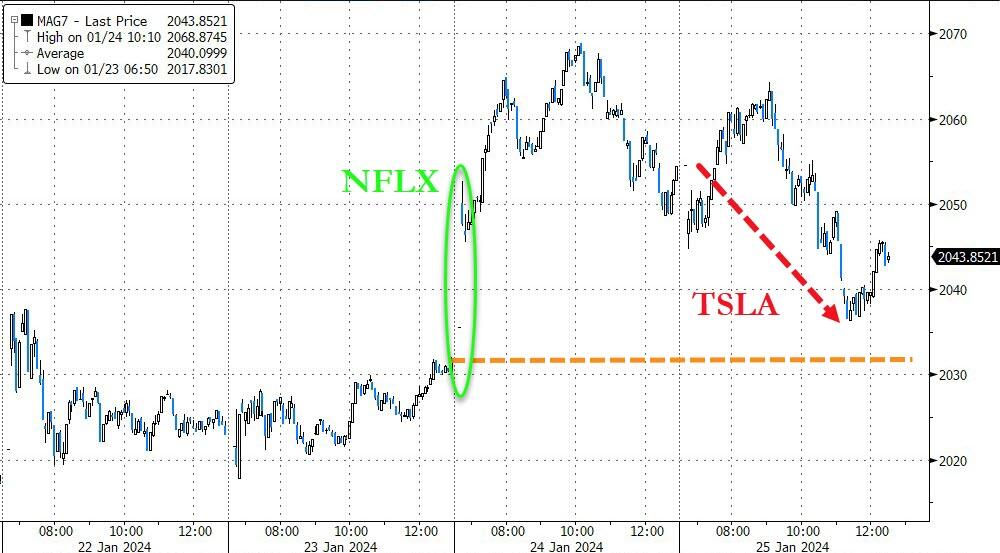
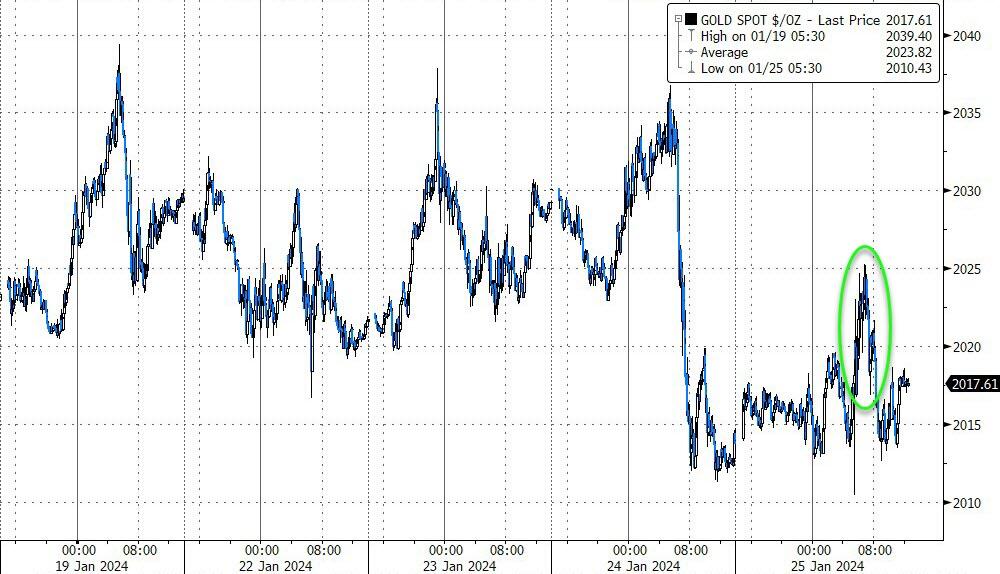
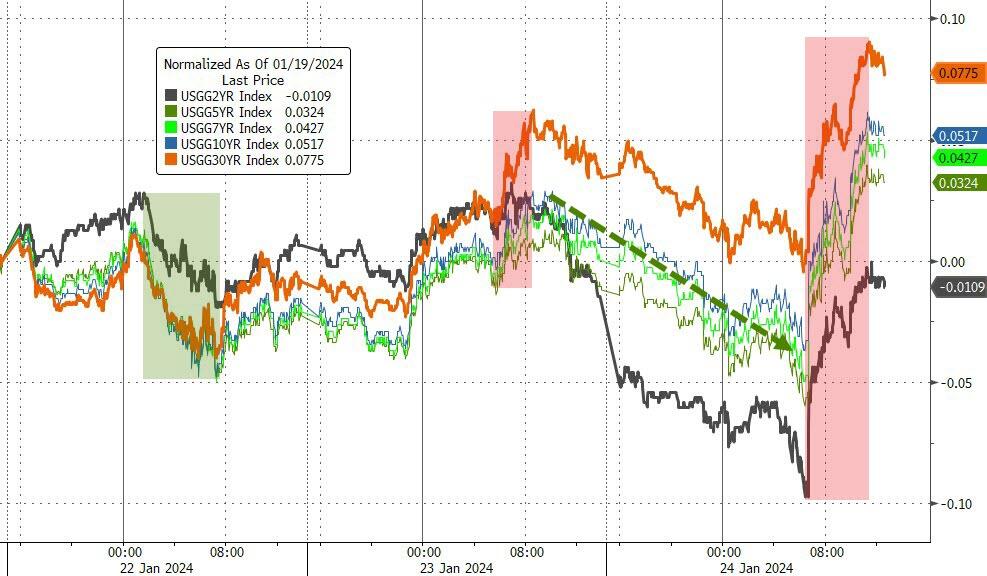
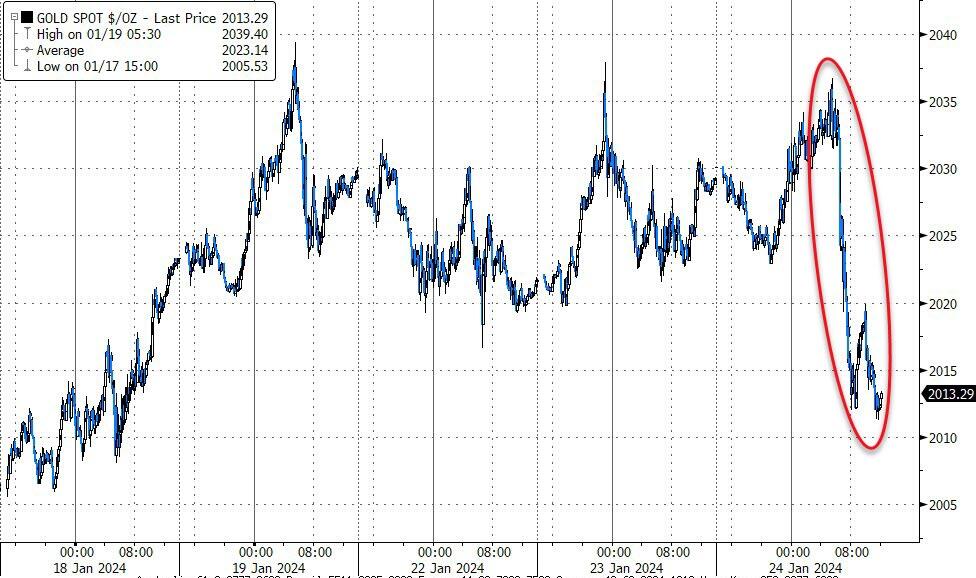
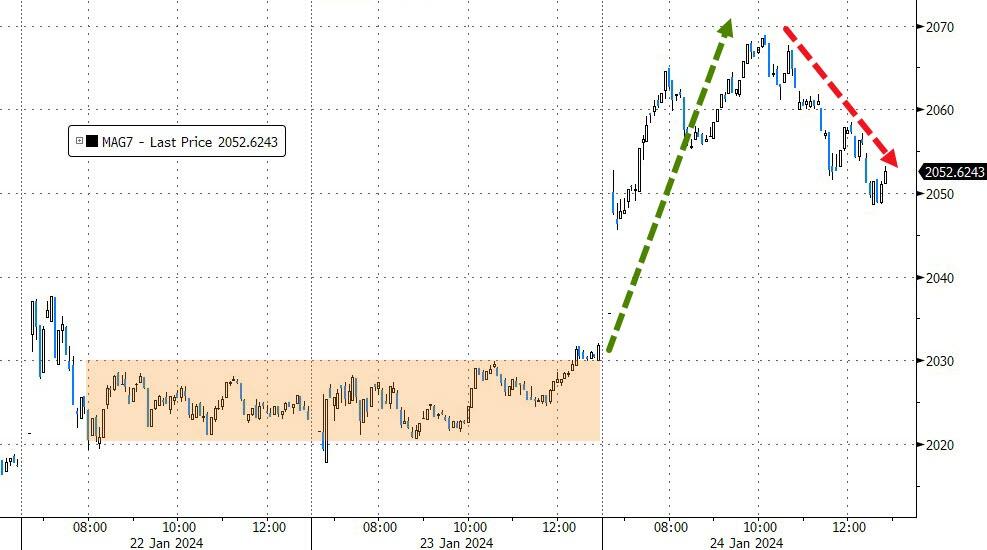
Bond yields went down, helping stocks go up. Gold shone, the dollar faded, and the MAG7 stocks (Microsoft, Apple, Google, Meta, Amazon, Netflix, and Tesla) reached new highs.
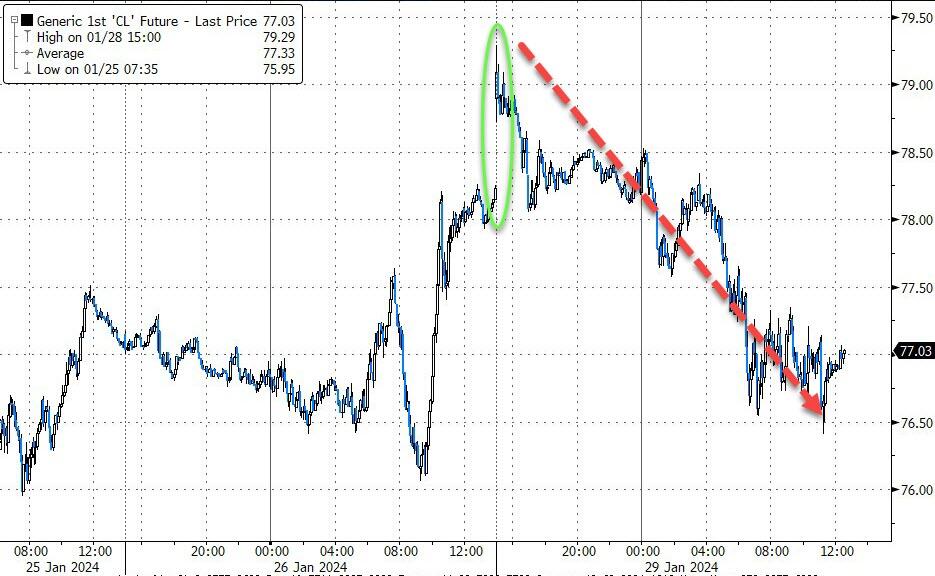
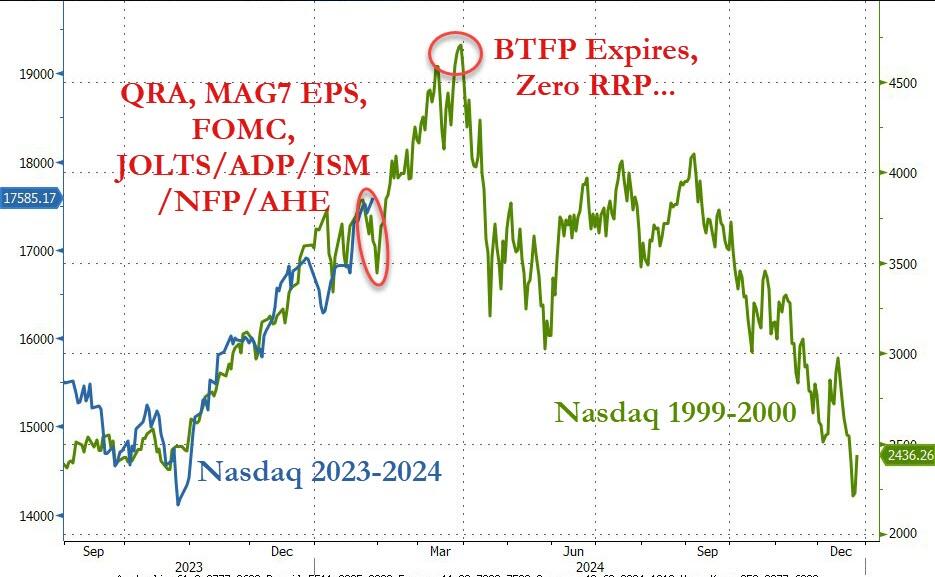
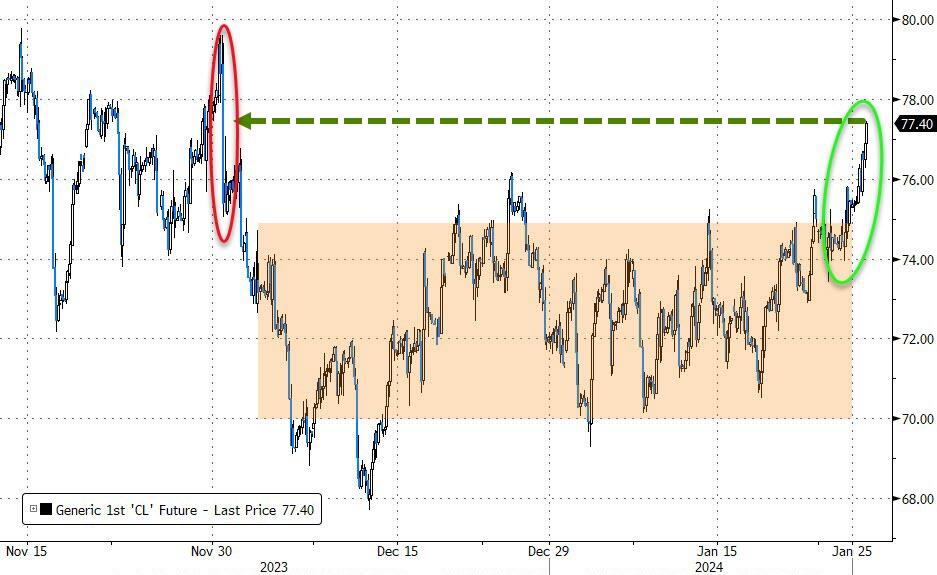
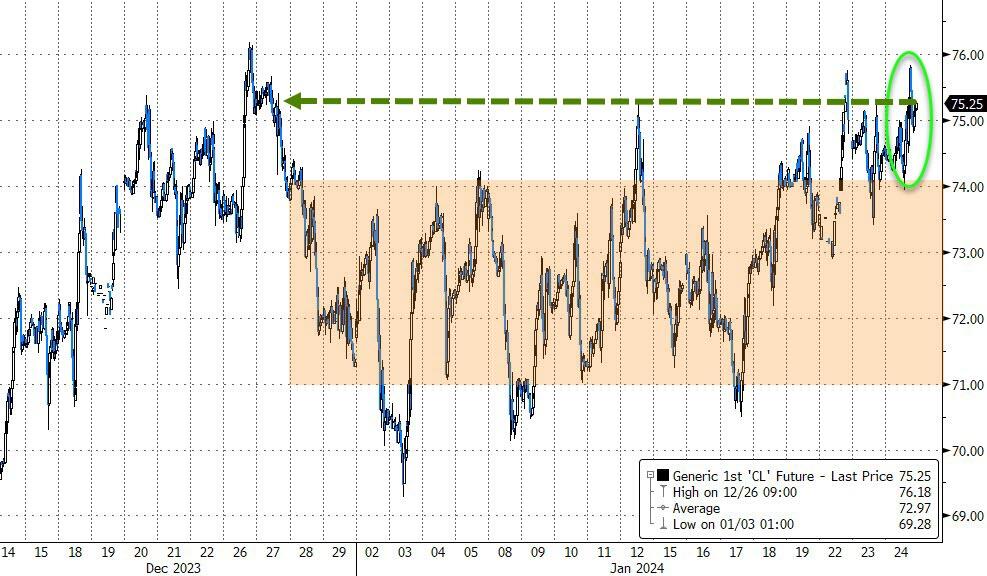
The odd one out was crude oil, which fell 1.31% thanks to a rare peaceful day in the Middle East. The Nasdaq was the leader of the pack and its unstoppable ascent reminded ZeroHedge of the dot-com bubble.
Are we headed for another crash?
Read More


