The Importance Of Trading Volume

Ulli Uncategorized Contact

So you identified an up trend in a sector/country ETF and reviewed the momentum figures in the StatSheet to select a suitable candidate for your investment portfolio. What else do you need to do before placing your order?

You need to check the average volume figures especially if you are investing larger sums of money. In my advisor practice, this is an important step and reader Bruce had this to say:

First, I found you website a couple of months ago and have been following it closely ever since.I find it an absolutely superb resource!

Quite frankly, I would use it as a stand-alone resource if not for one thing…you do not include volume, which I consider a vital component.

For instance, DBO may be marginally better than USO, but DBO only trades 72,900 ATV as opposed to USO which trades 10,603,700 ATV.

Liquidity is a paramount consideration, especially when you get stopped out or the slippage will kill you.

Would you consider adding average trading volume (ATV) to your spreadsheets?

Bruce pretty much follows the same steps as I do. If find two ETFs with very similar technical indicators, but with huge differences in volume, I will always select the one with the highest liquidity. While this may not be as important if your order is for only $10k, it can have an effect nonetheless.

I have found that low volume ETFs tend to have higher bid/ask spreads, which means that you don’t get the best fill when buying or selling along with additional slippage due to lack of liquidity. This is most prevalent on down days when everyone heads for the exit at the same time.

While the weekly StatSheet is already packed with all the information I can cram in, adding a volume column, while helpful, is just not possible. I personally simply review Yahoo’s financial site, which gives me quick access to the volume information in a few seconds.

Reader Bruce’s second question addresses another important area. Here’s what he said:

Second, what protocols do you use to get back into an ETF or fund once you have been stopped out?

For instance, last week I got stopped out of SLX. But steel is quite strong and has a viable thesis forinvestment. At 103.34, it is still 7.96% off its high of 112.28, and its “M-Index” has been cut in half from 18 to 9. Although the trend line has been broken, there is strong resistance at the 100-101 level. It looks like a buy at this level to me.

Thank you for your hard work and superior information.

While it certainly has merit, I personally don’t look at resistance points as this is too much of a subjective opinion. Besides, resistance points are made to be broken. While this approach may work in bull markets, I personally never had much faith in buying at resistance points or entering on dips. My preferred way has always been to buy on breakouts, which supports the basic law of physics that a body in motion tends to stay in motion.

SLX still sits above its long-term trend line (39-week SMA) by some +17%, which is quite high. My view is that if you were in that trade and got stopped out at a profit, be happy. This is a very volatile sector and a 10% sell stop may get triggered in a hurry even when used based on closing prices only.

However, if you are an aggressive investor, you could re-enter when SLX breaks out to new highs again, which would be an indication that the major trend has resumed. While that goes against conventional wisdom, trend tracking is all about buying on price breakouts and not about buying on pullbacks. It goes without saying that a disciplined exit strategy is a must.

How Many Positions Should You Have?

Ulli Uncategorized Contact

As a follow up to yesterday’s post “When Should You Take Your Profits?” reader Dave had this question:

You have covered well the decision-making that goes in profit-taking and what I call “loss-reduction”.

What I am uncertain about is the number of positions one should hold at one time? Does it differ if you have a mixture of ETFs and Mutual Funds from an all-ETF or all-Mutual Fund?

No, it does not. Usually, if a beginning investor has less than $20k in his portfolio, maybe 1-3 positions in domestic and widely diversified international funds, when the respective Buy signals are in effect, is all that is needed to diversify. I don’t recommend sector exposure for a small portfolio.

I usually designate 8 to 10% of portfolio value to any one area. Let’s say we have a buy from our domestic TTI (Trend Tracking Index). I would initially invest 1/3 of portfolio value (allocated to 3 or 4 mutual funds/ETFs).

If the international TTI subsequently signals a Buy, I would to the same thing there, which leaves me with 1/3 in money market. If some sector or country funds are showing strong upward momentum, I would again designate 8 or 10% to any one area.

If sectors and country funds do not offer any opportunities, or volatility is too high, I will then allocate more into my existing holdings, provided they have gained some 5% in value. In other words, I will stay with the long-term trend until it ends and my sell stops are triggered.

When Should You Take Profits?

Ulli Uncategorized Contact

Reader Steve is still unclear about an important part of Trend Tracking, namely when to take profits. He writes as follows:

Thanks again for your great blog and newsletter.

You have really helped me improve my trading (and the way I look at markets). I have appreciated you reviewing your entry and exit strategies. I do have one question. When do you take profits?

I have had a few ETFs go quite a bit higher, then fall back to trigger my stop over the course of a couple of weeks. Looking back, I could see they were quite extended above their short term moving averages. When a fund rockets off, should I take some profits along the way? Or should I wait until it falls in momentum or triggers my stop? Any wisdom you can provide would be much appreciated.

Again, thanks for you generosity in sharing your experience.

The general idea is let your trailing stop loss be your guide when to get out, either to limit losses or to lock in profits. Here is how I have described it in more detail in my Investment Policy Statement under the “Risk” section:

With Trend Tracking, we set up a clearly defined risk limit. Upon executing the purchase of an investment, we immediately establish a trailing sell stop point of 7%. In other words, as prices rise, the stop loss point rises as well. This essentially fulfills 2 functions:

1. It limits our losses in case the trade goes against us, and

2. It locks in our profits if prices continue to rise until the trend ends

As you can see, Trend Tracking, along with the disciplined use of trailing sell stops, greatly reduces the risk.

For example, if we allocate 10% of portfolio value to a certain ETF, and prices decline right away and trigger our sell stop, our risk is to lose about 7% of the 10% investment. That means the effect on the total portfolio is about -0.7%. (Be aware, however, that the final price maybe slightly better or worse than the 7% loss objective due to market conditions.)

This sensible approach allows us to keep these losses small; they are not only part of investing but necessary in order for us to be prepared and ready to participate in the next major up trend whenever it presents itself.

Sometimes it may take several buys and sells, also called whip-saw signals, before the major trend establishes itself. Investor patience is a requirement!

In other words, if the trend continues your way to the upside, you trail your sell stops along with the rising prices until the trend eventually reverses and triggers your exit points. Using this method, you eliminate any emotional decision making and let the market tell you when it’s time to get out.

Sunday Musings: Rubbing Me The Wrong Way

Ulli Uncategorized Contact

I get a lot of e-mails and comments about my articles and weekly updates. I find most of them constructive, but once in a while I get a real winner. This was the case yesterday, when reader Doug had this to say:

I was disappointed in your facetious comment in the second paragraph under MIXED BAG, regarding the CPI numbers. I’m absolutely sure you understand the reasoning behind keeping food and energy prices out of the CPI, but can you be so sure each of your readers also does? Your attempt at humor in that paragraph is misleading and ill-advised.

Lest this email appear completely negative, let the record show that I thoroughly enjoy your weekly newsletter.

Hmm, here we are at the brink of a recession, with the financial system in shambles, gas, energy and food prices at an all time high and showing no signs or receding, and this reader is worried about my facetious comment.

The direction this economy is going, I will be making a lot more facetious comments in the future just to underscore the silliness of some the skewed numbers being released or things like Fed chief Bernanke’s comments that the danger of downturn has faded among many others.

I am not an economist, but I read a lot about economic events, since they all tend to affect the investment arena. I suggest that this reader focuses his energies on the reality of things as pointed out succinctly in the latest issue of Dr. Housing Bubble called “Cultural Spending Neurosis,” and maybe then he will understand that a sense of humor is badly needed to survive in this environment:

I was having a conversation with someone last week regarding his home equity line being shut down. He was rather distraught and frustrated by the sudden move of the lender to close off his line due to market conditions here in California. “How can they do that? They have no right to take away my hard earned money!”

Aside from restraining myself from smacking him upside his head I did ask him how he earned that money that was now gone. “My home equity was my money. The bank has no right in closing access to my money.” Welcome to the new mentality of wealth in our nation.

This simple conversation is the tip of the iceberg of the challenge that is now confronting our nation. In the past few decades, Americans have arrived to the current distorted point in reality where alternate universes collide and somehow debt is now the equivalent to wealth. I should actually clarify that last statement in light of the above conversation about home equity lines being shut down:

“Wealth in the last decade isn’t how much you save or your net worth. Wealth is determined by your ability to have access to large amounts of easy debt via credit lines and maximum leverage.”

That is a very important point and once you grasp this knowledge, you can understand why we are in the predicament we are in. Today, retail sales numbers perked up and the market initially came out of the gate with guns-a-blazing. That is until folks stopped for two seconds and did the current economic math:

A: If all recent data is showing us that consumers are tapped out.

B: Home prices are still declining and foreclosures are rising.

C: Consumer inflation is hitting on every front.

D: Then how can Americans still be spending?

Let me show you how:

“American credit card debt is growing at the fastest rate in years, a fact that may signal coming trouble for the banks that issue them.

The Federal Reserve reported this week that the amount outstanding of revolving consumer credit hit $937.5 billion in November, on a seasonally adjusted basis, up 7.4 percent from a year earlier.

The annual growth rate has now been above 7 percent for three months running, the first such stretch since 2001, when a recession was driving up borrowing by hard-pressed consumers.

The surge in credit card borrowing comes as credit card default rates are gradually rising, albeit from low levels, and may reflect the fact that it has gotten harder for consumers to borrow against the value of their homes, both because home values have fallen in many markets and because mortgage lending standards have tightened.”

Now the above article was posted in January but now we are close to $1 trillion in revolving consumer debt out there. And the more ominous problem is that defaults are rising in this area. So what has occurred in the above equation is due to the lack of wage growth, people were using leverage via mortgages and consumer debt to bridge the Joneses gap.

It is rather shocking that American households have approximately $13.84 trillion in debt obligations. In 1993, this number was at $4.2 trillion so we’ve nearly triple our national household debt in the matter of 15 years. That $13.84 trillion is a very large number and to put that into context, the estimate GDP for the entire United States for 2007 was $13.84 trillion.

We spend every last penny! Is it any wonder why Americans have a negative personal savings rate? You really have to wonder how people can spend more than they earn but that is essentially the way we as a nation have been living for the past decade. This housing bubble fueled by the debt bubble was only a logical extension of the cultural financial neurosis.

The great majority of the public started associating the ability to access credit with true financial prosperity. Well as we all now know, anyone with a pulse and one tooth was able to get a large mortgage in California by simply making things up.

Need we remind you about the farmer making $14,000 a year with access to a $720,000 loan? Or what about the hundreds of credit card offers Americans receive each year in the mail? When debt is no longer seen as a necessary evil and a sign of wealth, new definitions take hold of mass psychology.

That is why at the height of pseudo prosperity and the pinnacle of the housing bubble, Americans had for the first time crossed the negative savings barrier. This is the perfect example of watering down the definition of wealth in our country; collectively as a society people started having an aversion to saving money and a liking to debt.

This of course is a major problem and no country can survive in the long run with crushing amounts of debt. I don’t care what kind of math political parties want to sell you but there is no way a country can be prosperous in the long run by running larger and larger deficits.

This implosion of the credit (debt) markets is simply a decade long debt ponzi scheme that can go on no longer. Consumer psychology still can’t understand why fuel is rising or why everything from education to groceries are costing much more. The perfect scheme was to con people into believing that going into debt, meaning you were spending tomorrow’s dollars today, was somehow a prudent way toward wealth.

And the entire idea of savings lost its allure. In fact, society punished savers implicitly. For much of the past, if you bought a home folks knew that you had the diligence and restraint to hunker down for 2 or 3 years and put off conspicuous consumption for a larger goal such as a home. That entire romanticism of saving went out the window when anyone and everyone was getting BMWs and McMansions with zero down.

In fact, if you were renting and saving and trying to be frugal, you were seen as an outcast and a bum because you just missed out in a home that just went up $50,000 in one years simply because everyone was smoking the housing peyote. I wonder how many people had a kitchen conversation like this circa 2003:

Spouse A: “We should buy a home. The Perma Bulls down the street bought a home last year and they now have $50,000 in equity.”

Spouse B: “But it doesn’t make sense. How can a home be worth $50,000 more if they didn’t do anything?”

Spouse A: “Well here we are saving and all we’ve been able to save in our 2% savings account is $15,000. What if homes go up $50,000 again next year?”

Spouse B: “That can’t be because that makes no economic sense. Prices go up and correspond to some fundamental reason.”

Spouse A: “I heard that they got a home equity line and took a trip to Europe. Isn’t that great and fantastic? We actually make a bit more than they do but why do we live and feel poorer?”

Spouse B: “I don’t know. It just doesn’t make sense. I feel uncomfortable going into that large of debt. Why is that?”

Spouse A: “Because you’re stupid?”

Spouse B: “No. You are stupid you moron and don’t understand the difference between net worth and being in debt.”

Spouse A: “Isn’t wealth about what you can buy? We don’t take fancy trips or even have our own home! You are the true idiot you financial midget with no home.”

Spouse B: “I hate you.”

Spouse A: “I’m leaving you.”

Spouse B: “Go ahead and take the dog while you’re at it. I always hated how he looked at me anyways.”


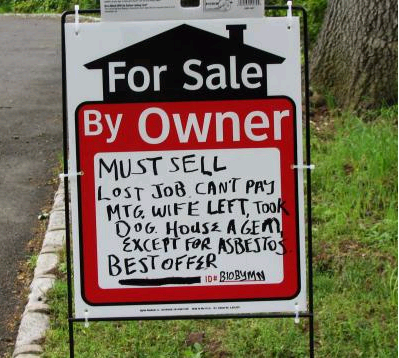
What a lovely and heart warming story don’t you think? As you can see from the above sign, many people did have a conversation like this except in our story above, the couple split ways because of diverging financial goals and with that lawn sign, we can see that some folks unfortunately realized that selling a home in a busted bubble is no easy task.

This is the real deal here folks. We are shifting back whether we want to or not. The real psychological shift that is unfolding is the ability to break down wants and needs. A big gas guzzling car is a want and many folks are painfully realizing this. A large crushing mortgage for a McMansion is a want. Food and education are needs. Time to get these equations recalibrated before the market recalibrates them for you.

You can’t be any more direct than this. To me, this viewpoint is right on and is simply a realistic assessment as how things are and not what we would like them to be.

Portfolio Anxiety

Ulli Uncategorized Contact

While we all enjoy the incredible benefits that technology has brought us over the past few years, there have been some disadvantages especially when it comes to handling your portfolio. Sure, instant access to all information anywhere, e-mail, the internet and customized tracking of your investments have made a mostly positive difference in all of our lives.

However, there have been some negatives too, as you can get overwhelmed by instant information overload and easily change your focus from macro to micro.

That happened to a couple of retired clients, who got stuck in that mode last year when first being exposed to ETFs. The instant price availability throughout the day caused them to watch the market incessantly while hanging on to every tick change of the ETFs they were invested in. They could not control themselves to do otherwise and finally asked me to replace the ETFs with comparable mutual funds.

Many investors are checking their portfolios several times a day or worse yet, on their cell phone. Others have the need to at least review portfolio changes once at the end of each business day.

Psychologists have proven that constant portfolio monitoring has unintended negative consequences and drains investors’ emotions based on the series of “pangs” (negative or positive portfolio changes) they experience. Here’s how Nassim Taleb describes this curious phenomenon in his book “Fooled by Randomness:”

Regardless of what people claim, a negative pang is not offset by a positive one (some psychologists estimate the negative effect for an average loss to be up to 2.5 the magnitude of a positive one); it will lead to an emotional deficit.

Now that you know that high-frequency investors have more exposure to both stress and positive pangs, and that these do not cancel out, consider that people in lab coats have examined some scary properties of this type of negative pangs on the neural system (the usual expected effect: high blood pressure; the less expected: chronic stress leads to memory loss, lessening of brain plasticity, and brain damage.

What economists did not understand for a long time about positive and negative kicks is that both their biology and their intensity are different. Consider that they are mediated in different parts of the brain—and that the degree of rationality in decisions made subsequent to a gain is extremely different from the one after a loss.

Note also that the implication that wealth does not count so much into one’s well-being as the route one uses to get to it.

In my advisor practice, I have a wide variety of clients form all walks of life with all types of behaviors. I have found that those investors with busy lives (and not much interest in the markets), who only check their brokerage statements once a month, do not lose their long-term perspective as easily as those who are engaged in constant monitoring.

While it’s a natural desire for many to increase tracking of their portfolios when the markets whip-saw and meander aimlessly, much of what we have seen during the past 18 months or so, it can lead to an emotional deficit, as Nassim describes above. If you have found yourself being more on the edge lately, this may explain why.

What can you do about it? Change your habits, which is the hardest thing to do for most of us.

No Load Fund/ETF Tracker updated through 6/12/2008

Ulli Uncategorized Contact

My latest No Load Fund/ETF Tracker has been posted at:

http://www.successful-investment.com/newsletter-archive.php

A volatile week left the major indexes with only minor changes.

Our Trend Tracking Index (TTI) for domestic funds/ETFs has moved lower and now remains -0.08% below its long-term trend line (red).


The international index dropped as well and now remains -5.65% below its own trend line, keeping us on the sidelines.


For more details, and the latest market commentary, as well as the updated No load Fund/ETF StatSheet, please see the above link.