No Load Fund/ETF Tracker updated through 5/25/2007

Ulli Uncategorized Contact

My latest No Load Fund/ETF Tracker has been posted at:

http://www.successful-investment.com/newsletter-archive.php

Sideways action had the major indexes slip slightly.

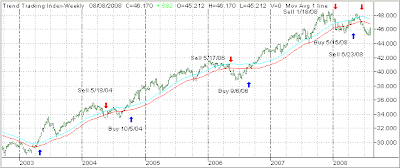
Our Trend Tracking Index (TTI) for domestic funds/ETFs now sits +4.85% above its long-term trend line (red) as the chart below shows:


The international index has now moved to +8.88% above its own trend line, as you can see below:


For more details, and the latest market commentary, as well as the updated No load Fund/ETF StatSheet, please see the above link.

Investment Management: Court Rules In Favor Of Registered Investment Advisors

Ulli Uncategorized Contact

Last week, the U.S. Court of Appeals overturned a long-standing special exemption for brokers known as the “Merrill Rule,” which allowed broker-dealers from offering fee-based accounts without being registered as Investment Advisors.

The court found that the SEC had exceeded its authority by allowing such practice. At this point, the SEC announced that it will not fight the decision.

The lawsuit was brought by the Financial Planner’s Association (FPA), and it agued that “whereas commissioned brokers are only responsible for making sure that trading and related transactions are handled properly, advisers by law must make investment decisions based on what’s in the best long-term financial interests of their clients.”

This is a point I have repeatedly touched on over the years. Broker-dealers, or their sales people, do not necessarily have the client’s best interest in mind when they peddle preferred company products based on incentives.

I for one applaud the U.S. Court of Appeals for fighting the SEC on this one. The outcome has the potential to benefit all investors by making them aware of the differences in compensation and subsequently the bias of the advice.

No Load Fund/ETF Investing: Is The Chinese Market Heading For A Bubble?

Ulli Uncategorized Contact

The Asia Times had a piece describing the potential of a Chinese bubble in their highly inflated stock market. One of the items indicative of speculative behavior has been the tremendous change in daily transaction volume.

It has risen from some $5 billion per day six months ago to some $50 billion per day recently. While that by itself may not be enough of a reason for an upcoming bubble, Michael Shedlock’s deeper analysis called “Stir Fried Stocks” offers some interesting sound bites:

Wanting a “piece of the action”
Opening an account but not knowing what stocks to buy… “I don’t know. I’m still learning.”
Mortgaging homes to buy stocks
Dipping into retirement savings to finance a frenzy of trading known as chao gu, or “stir-frying stocks.”
“We are opening 40 to 50 new accounts a day. Six months ago, it was four to five a day.”
Stock prices are 30 to 40 times earnings
“Earnings growth is very, very strong”
Chinese leaders will prop up prices to avoid turmoil ahead of a key Communist Party meeting in
late 2007 and the Beijing Olympics in 2008.
“We hear that before 2008 the government won’t let prices fall”
“We’re not afraid.”


If that isn’t the same speculative babble I have read about before the crash of 1929, I don’t know what is. If you look at my post from yesterday, you may be able to conclude that this type of behavior may very well be the “Point of Maximum Financial Risk” (Euphoria). Of course, in regards to timing, it is possible that we may stay at this point for a while.

What can you do about it? For one thing, don’t consider investing in the Chinese Market at this point. Track your stop loss points on all of your positions and, most importantly, execute them when those price levels are reached.

From my perspective, this is also not the time to become overly aggressive by restructuring your portfolio just because one of your friends has had a better return than you because he used more aggressive funds. When the pendulum swings again, those top performers will go down the fastest.

Have We Reached The Point Of Maximum Financial Risk?

Ulli Uncategorized Contact

I found a very interesting article that was written almost exactly one year ago. The main focus is on a chart, see below, which shows the range of emotions investors go through when holding a fully invested portfolio through a bear market.

It covers the entire spectrum of extremes from the “Point of Maximum Financial Risk” all the way to the opposite, called the “Point of Maximum Financial Opportunity.”


I believe that this chart is timeless, and I am certain that we will see the various stages repeated at some point in the future. Unfortunately, many investors will be able to identify themselves at the various points of the chart, if they stayed invested during 2000-2003.

If you were one of them, hopefully, you will have learned from the experience by planning on using a different approach the next time around.

From The Archives: The Pros And Cons Of ETFs?

Ulli Uncategorized Contact

Judging by a number of e-mails I received last week, some readers are still confused about how ETFs work and what their pros and cons are. While many articles have been written on the subject, including one I wrote a few years ago, here’s one I found that may help increase your knowledge.

Among other things, it also talks about how ETFs are created and addresses some of their tax-efficiencies as opposed to mutual funds.

However, I must caution you that you should not hold on to an ETF, or any investment for that matter, for only tax reasons. The money you might save could be more than offset by a trend reversal which has the power to do some severe damage to your portfolio.

ETF/No Load Fund Investing: All REITs Are Not Created Equal

Ulli Uncategorized Contact


A question came up in my advisor practice as to whether REITs are still a good investment given the current market climate.

If you look at the sector section of my latest StatSheet, you’ll notice that all domestic Specialty Real Estate ETFs are listed at the bottom based on their 4-wk performance figures as shown below (double click to enlarge):

My managed account clients currently have no holdings in any of these funds since we sold our positions when our sell stop got triggered on 3/6/2007.

As you can see, all momentum figures are very negative, and, if you follow trends, there is no reason to be involved in any of the above at this time.

However, that does not mean this applies to all Real Estate funds. If you look at the international market place, the picture looks different. The chart below shows a comparison between VNQ and EGLRX, a REIT that invests only outside the U.S.:

You can clearly see the “disconnect” between the domestic and the international market. It appears that the divergence took place right after the one-day meltdown on 2/27/2007 after which the domestic Real Estate market never recovered.

I am not sure why this happened, but the fact is that it did happen. Given the above momentum figures, I can’t see any reason that supports an argument for a domestic investment. I would consider the international market with a small portion of “new money”, but currently we have not yet established a position.