
- Moving the markets
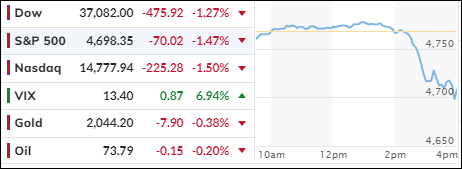
The markets have been soaring to dizzying heights lately, but today they came back down to earth a bit. Some traders decided to take some profits off the table after a long winning streak. This is normal and healthy for a bull market, and it doesn’t mean that the fundamentals have changed.
One of the biggest losers today was FedEx, which plunged 10% after disappointing investors with its revenue outlook and quarterly results. The company blamed higher costs, labor shortages, and supply chain disruptions for its woes.
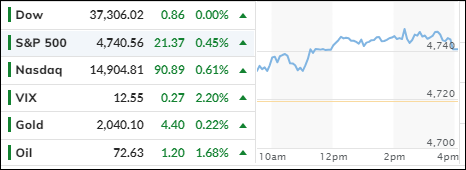
The market’s retreat followed a strong session on Tuesday, when both the Dow and the Nasdaq extended their gains for nine days in a row. Despite today’s dip, all three major indexes are still on track to end the month and the year in positive territory, as investors anticipate lower interest rates from the Federal Reserve in 2023.
But what triggered the sudden sell-off today?
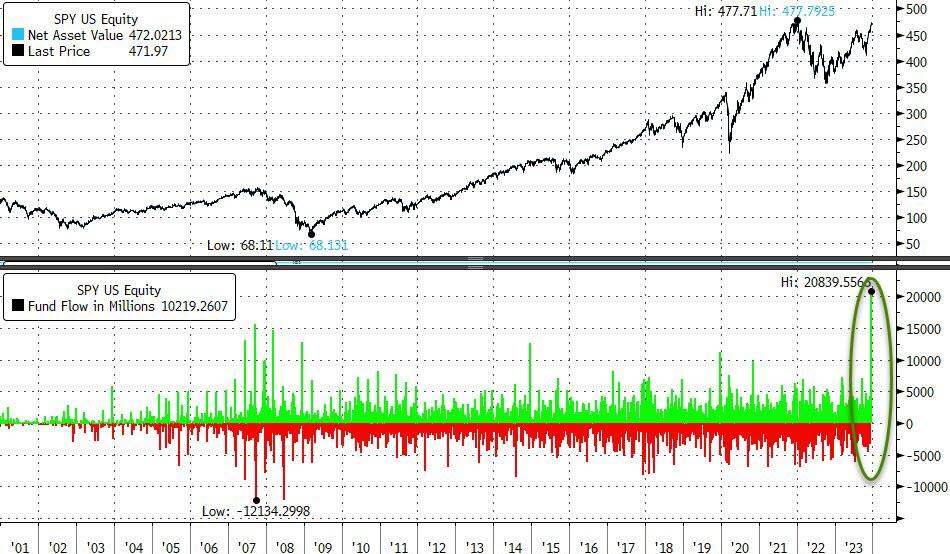
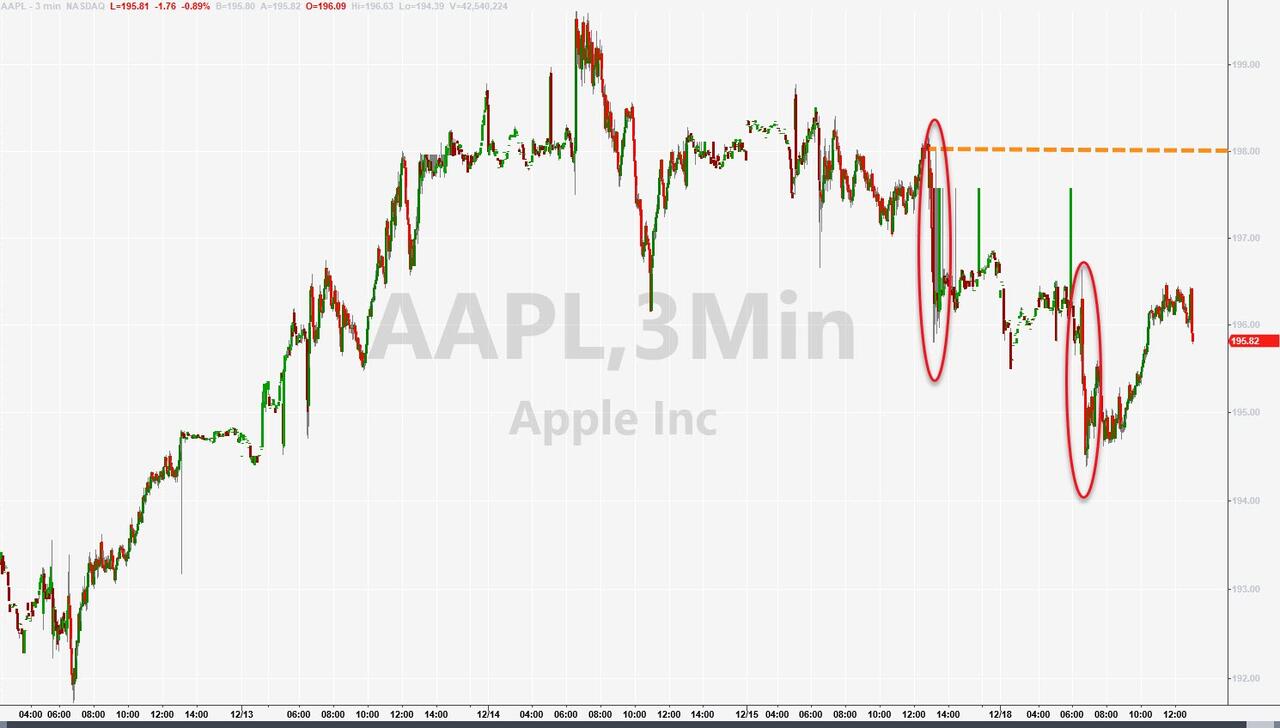
It seems that some exotic options played a role. These are options that expire on the same day they are traded, giving the holders the right to buy or sell the underlying asset at a fixed price.
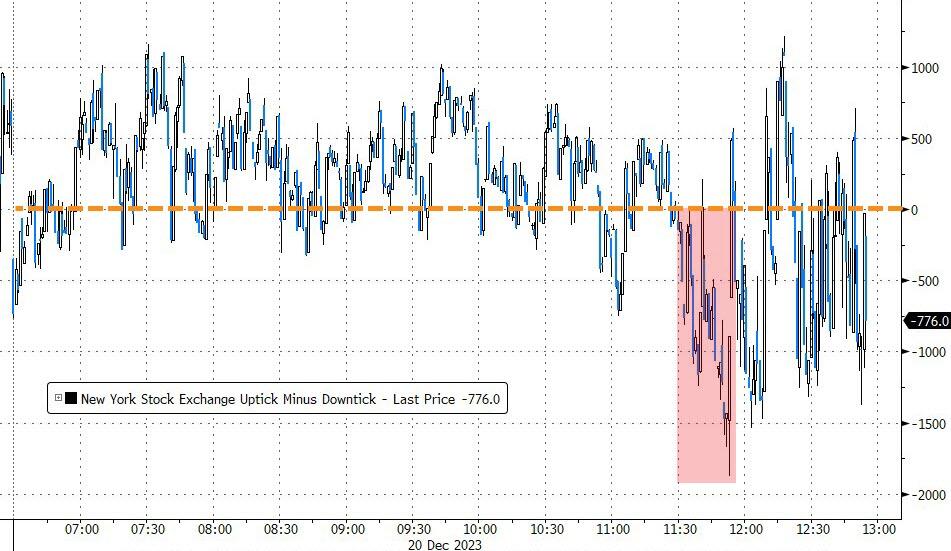
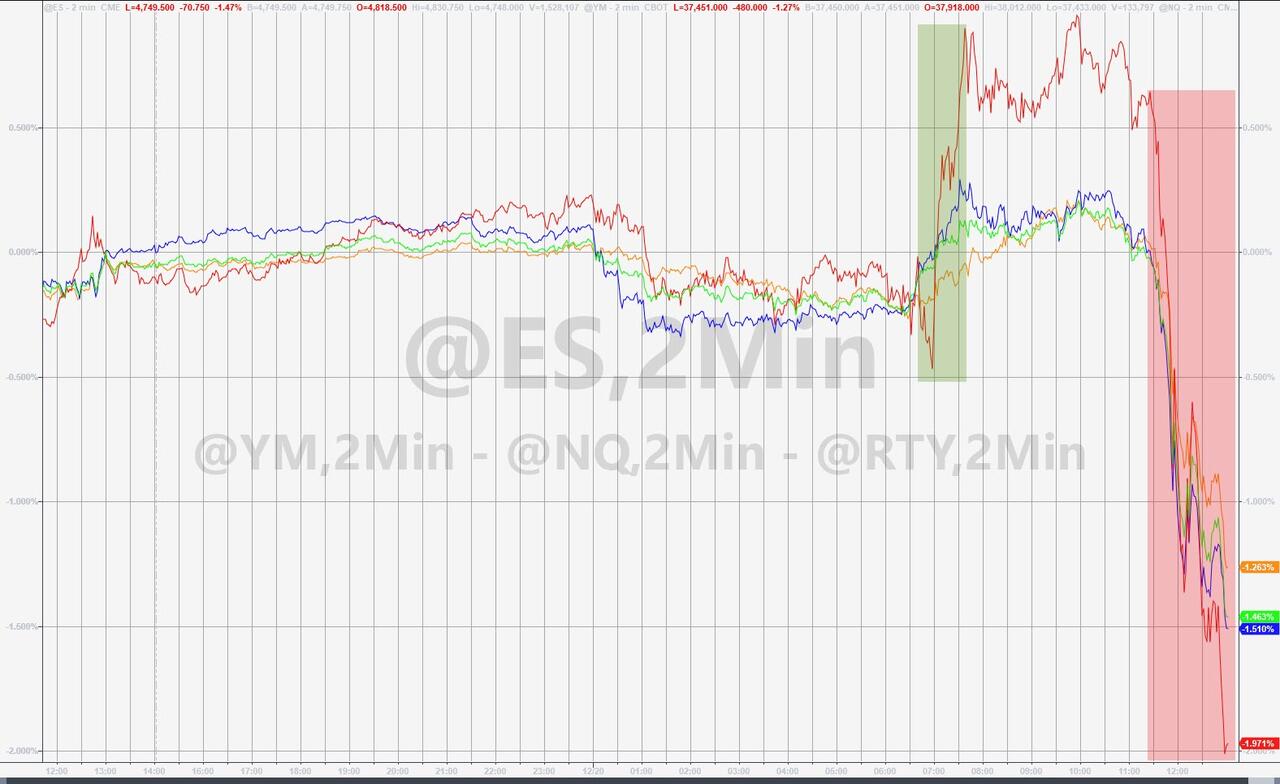
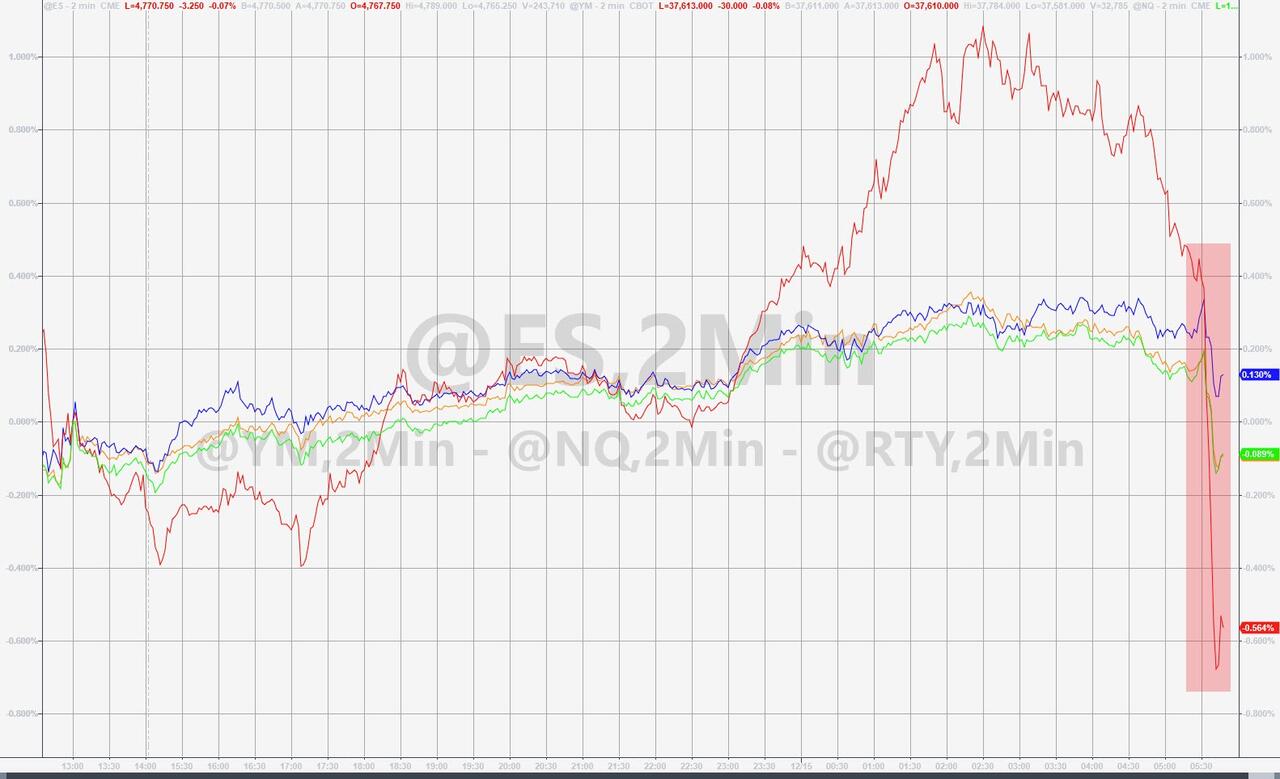
Today, nearly a million of these options on the S&P 500 expired with a strike price of $475. When the market reached that level, the selling pressure intensified, and the market hit a speed bump. The largest sell program since July sent stocks tumbling.
ZeroHedge summed up today’s action like this:
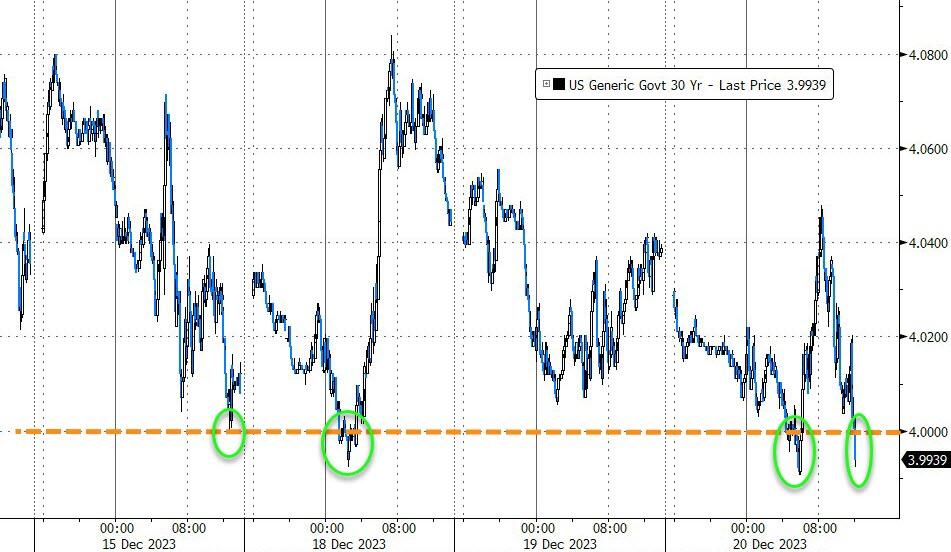
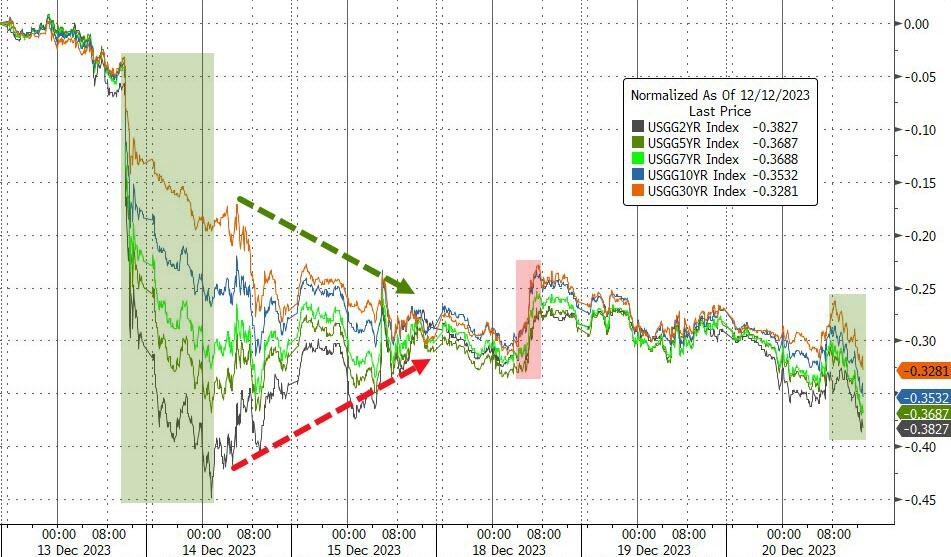
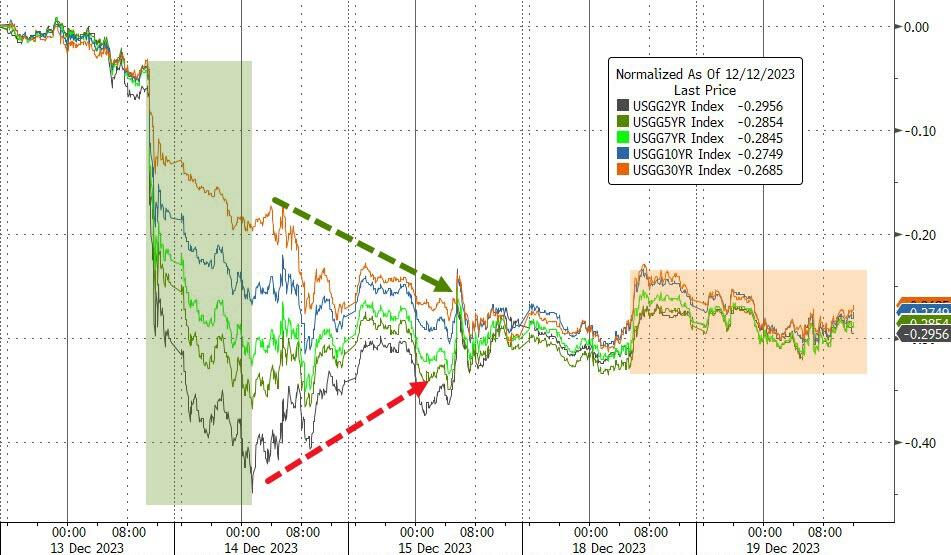
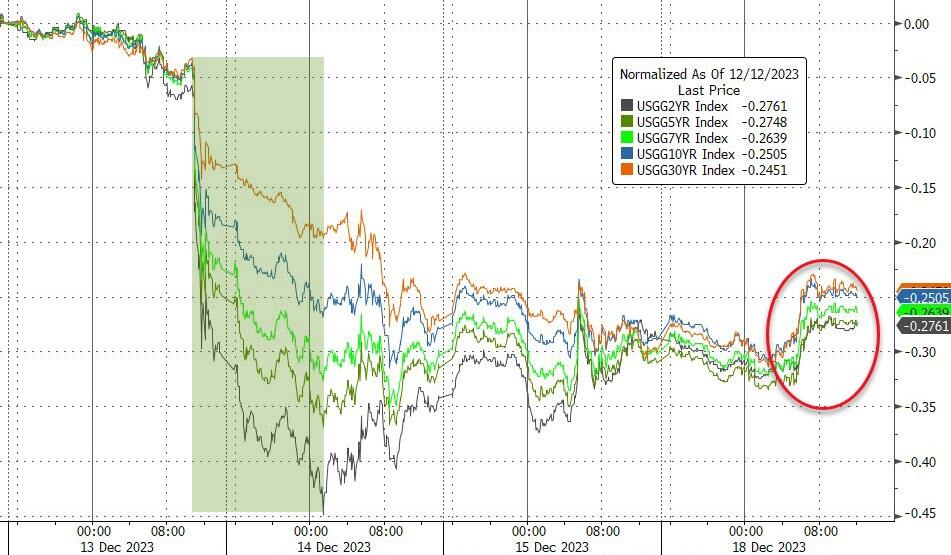
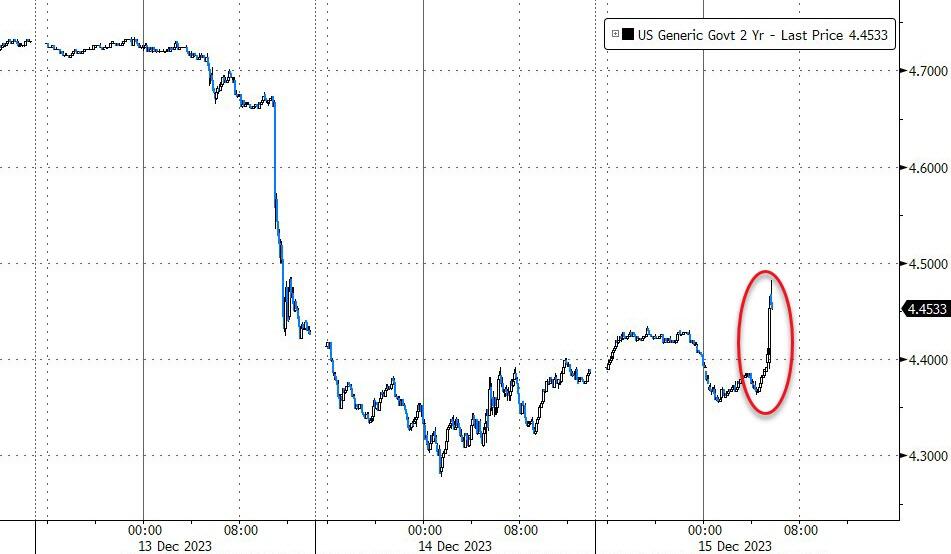
- 30-year Treasury yield fell below 4.00% for the first time since July
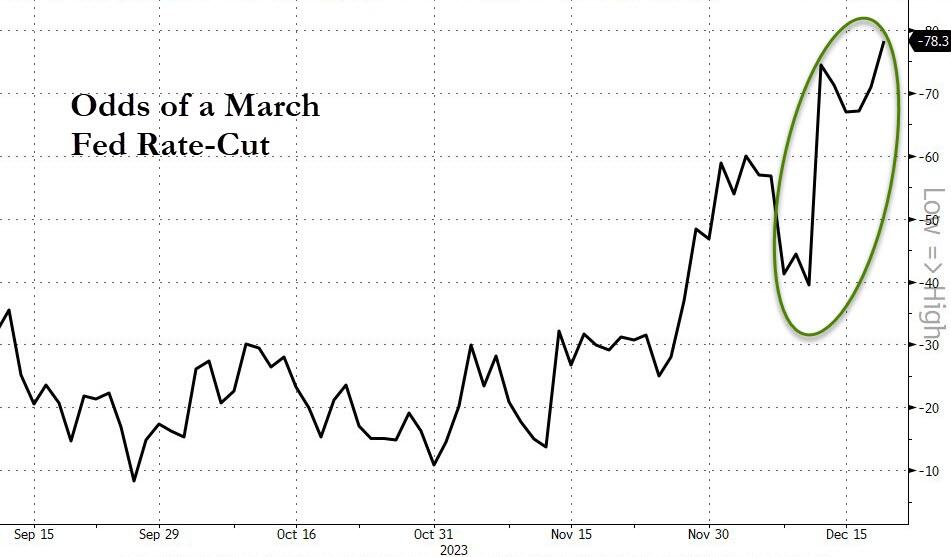
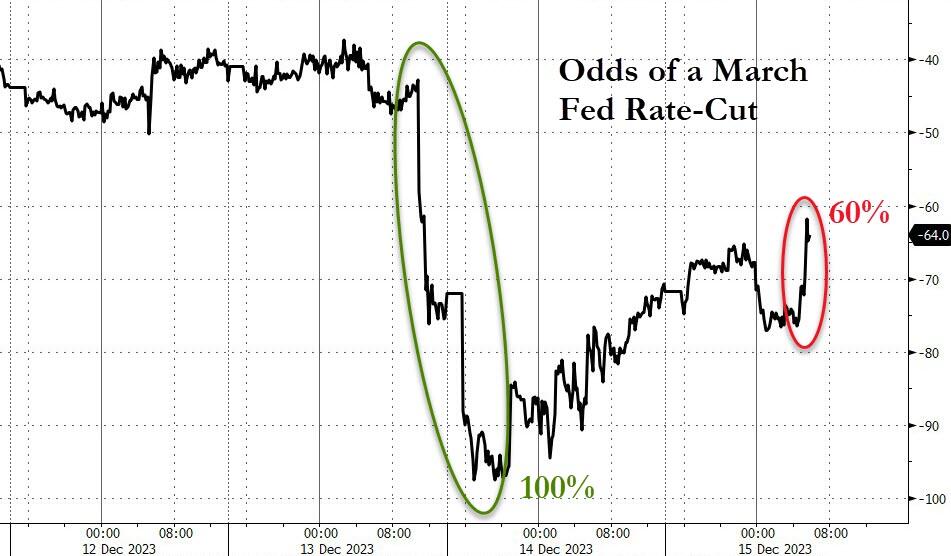
- Odds of a rate cut in March surged
- Expectations of more rate cuts in 2023 soared
- Stocks tanked
- Bond yields plummeted
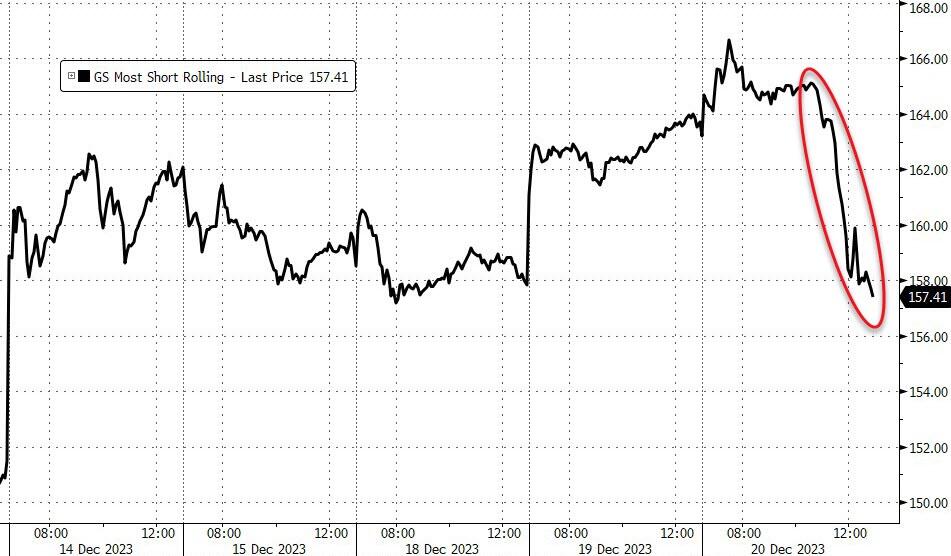
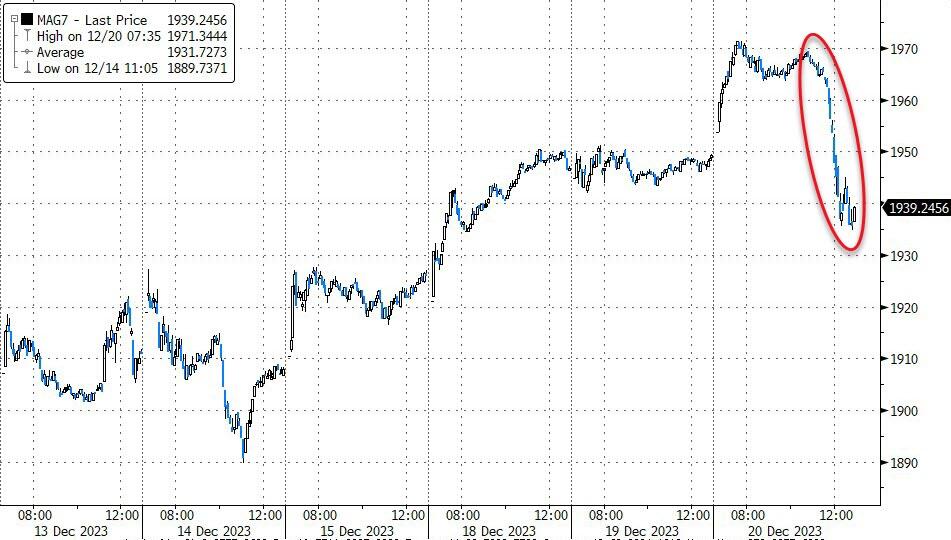
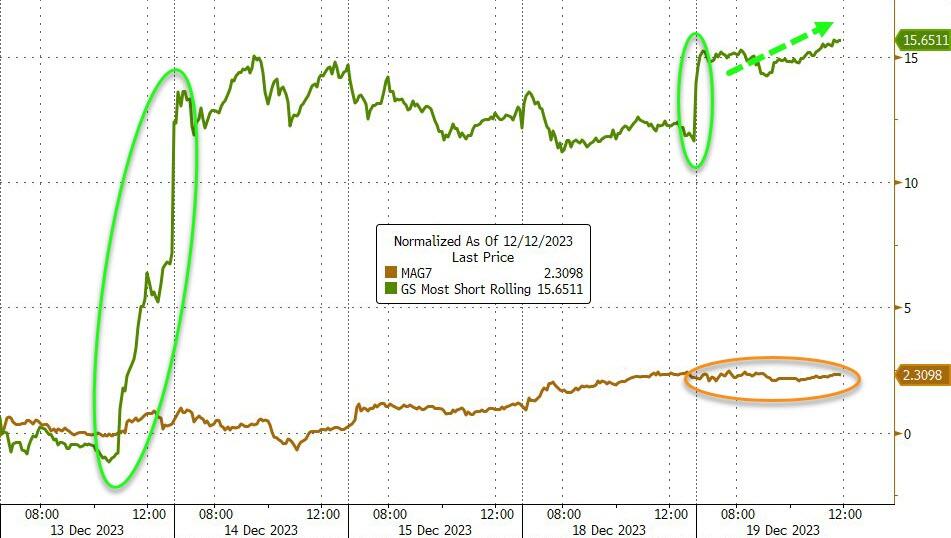
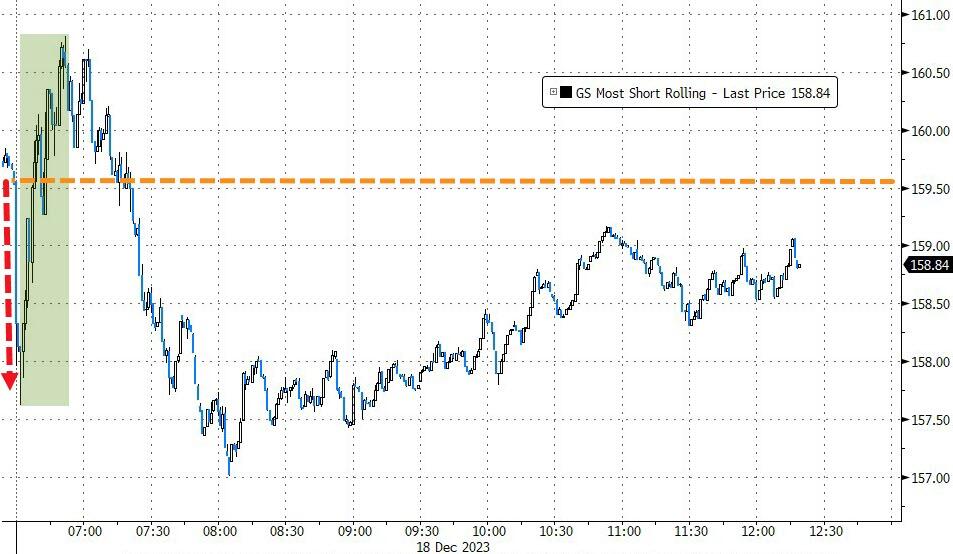
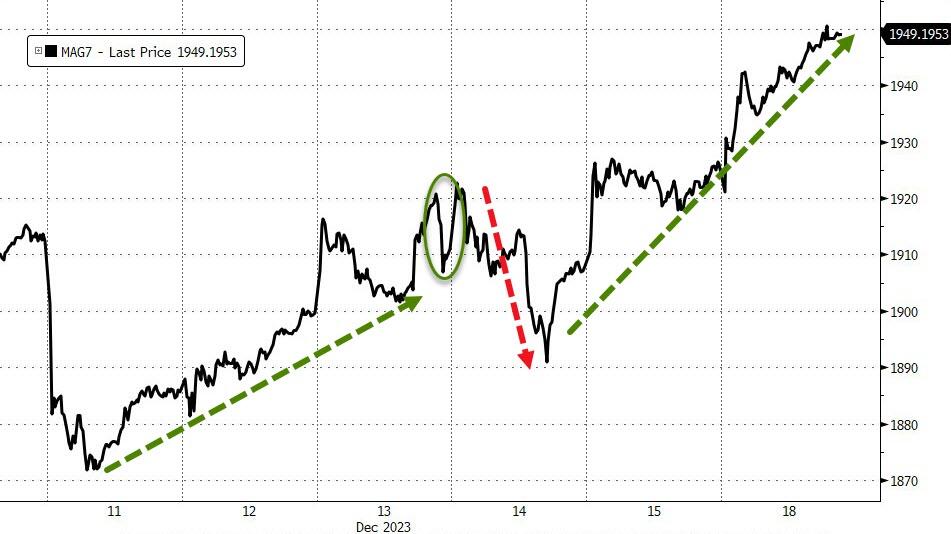
The short sellers finally had a reason to celebrate, as the most hated stocks suffered their biggest daily drop since February. Even the “Magnificent Seven” stocks couldn’t resist the selling wave and got dumped.
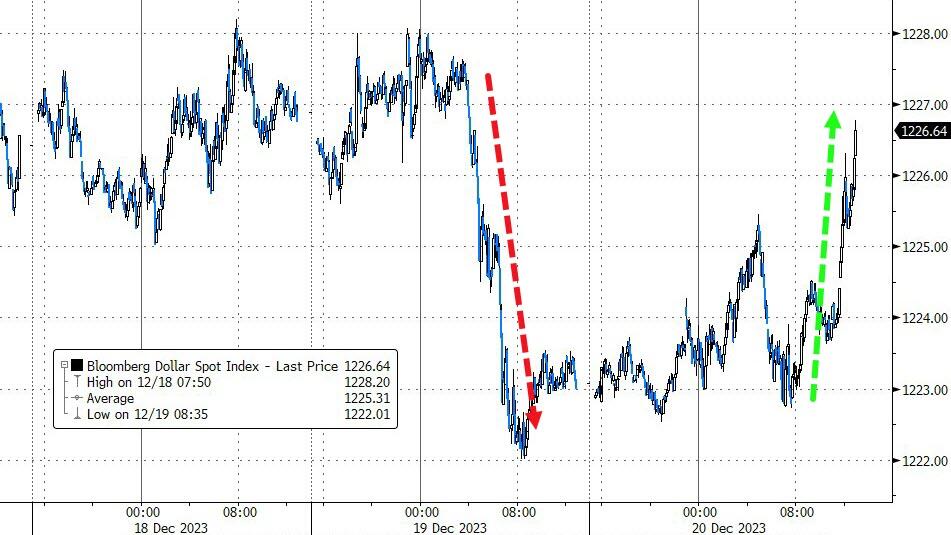
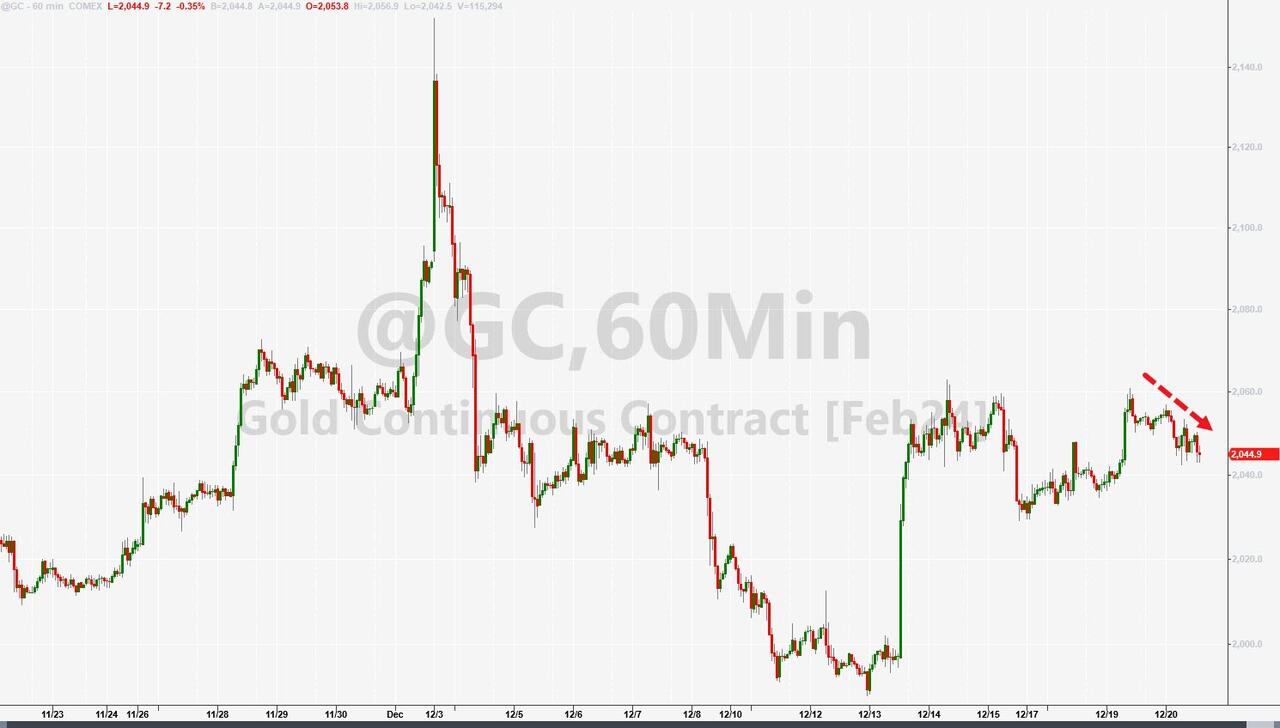
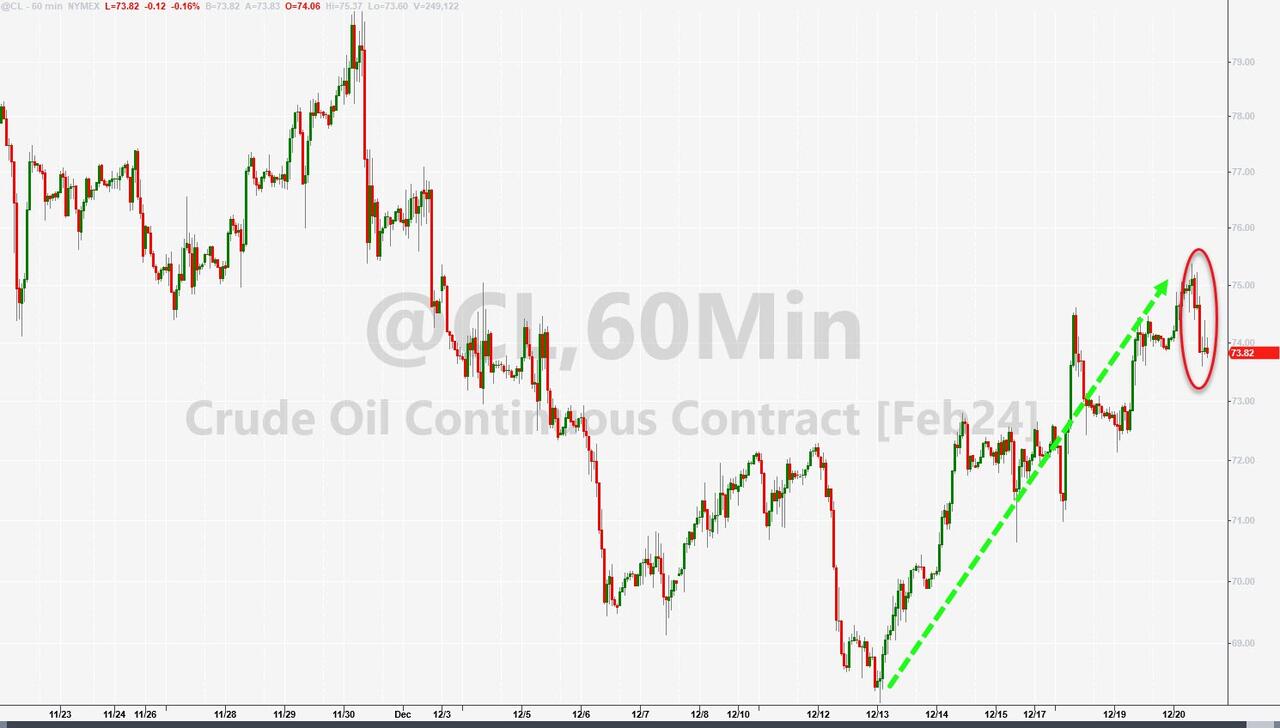
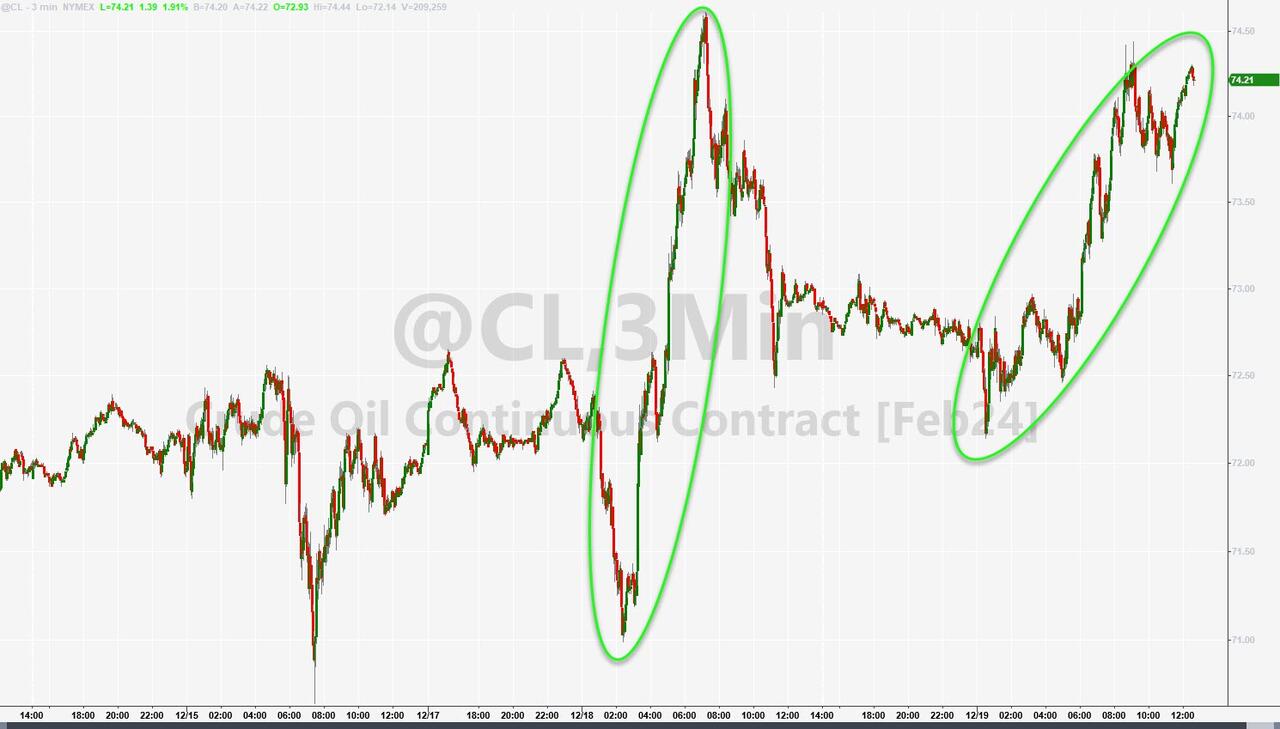
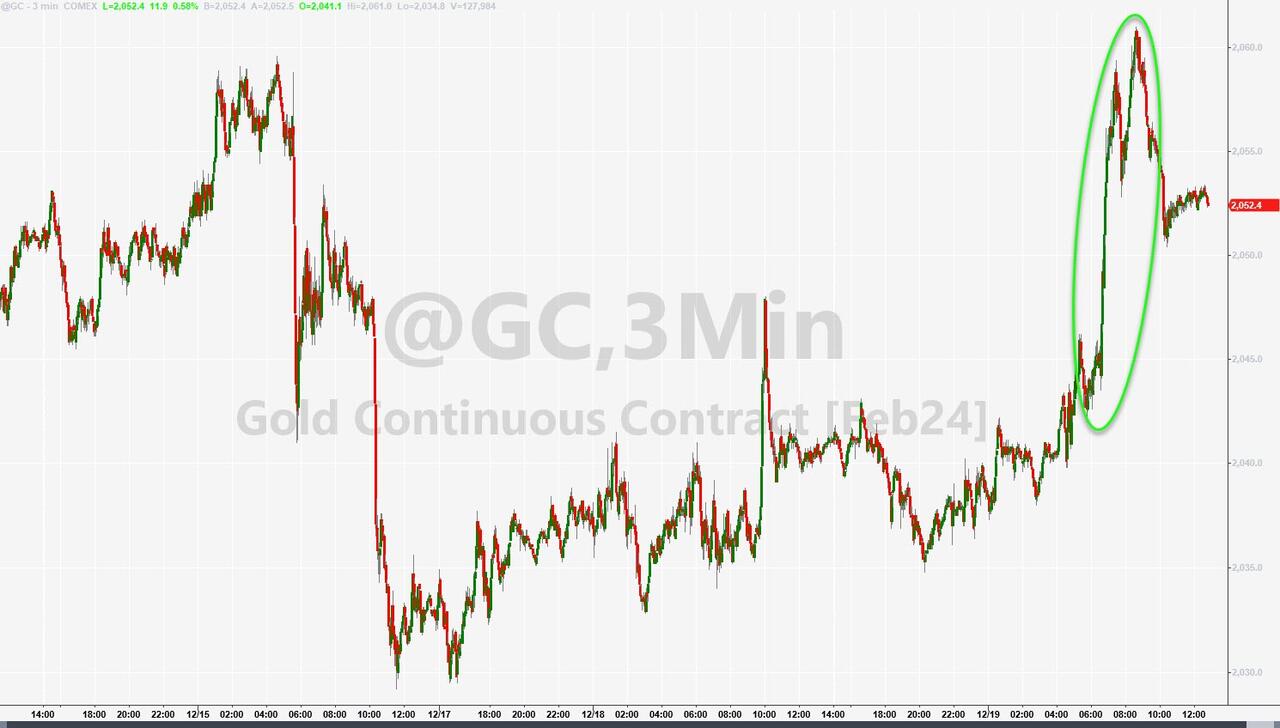
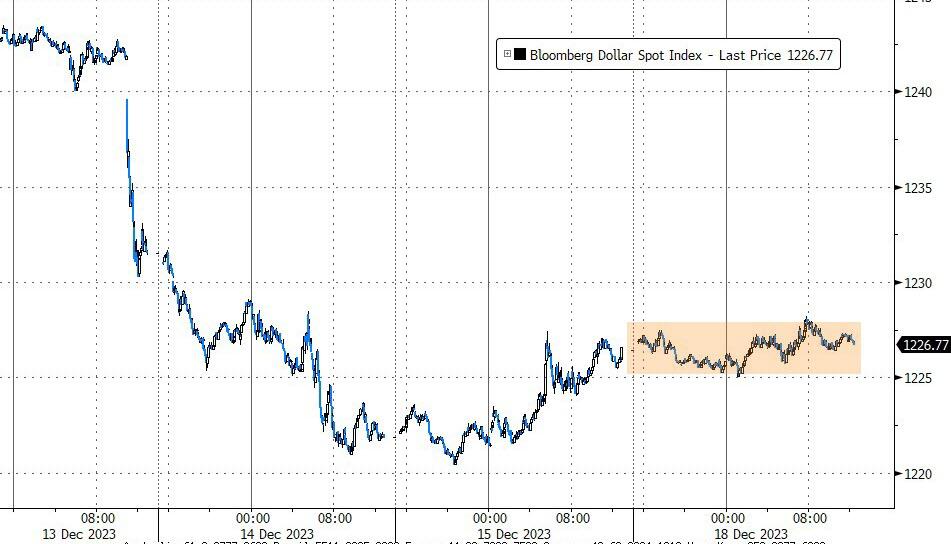
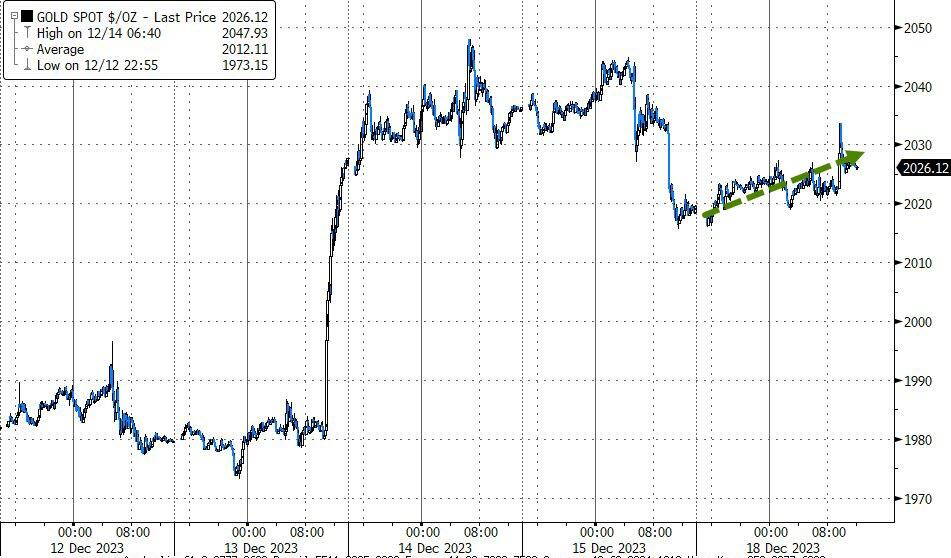
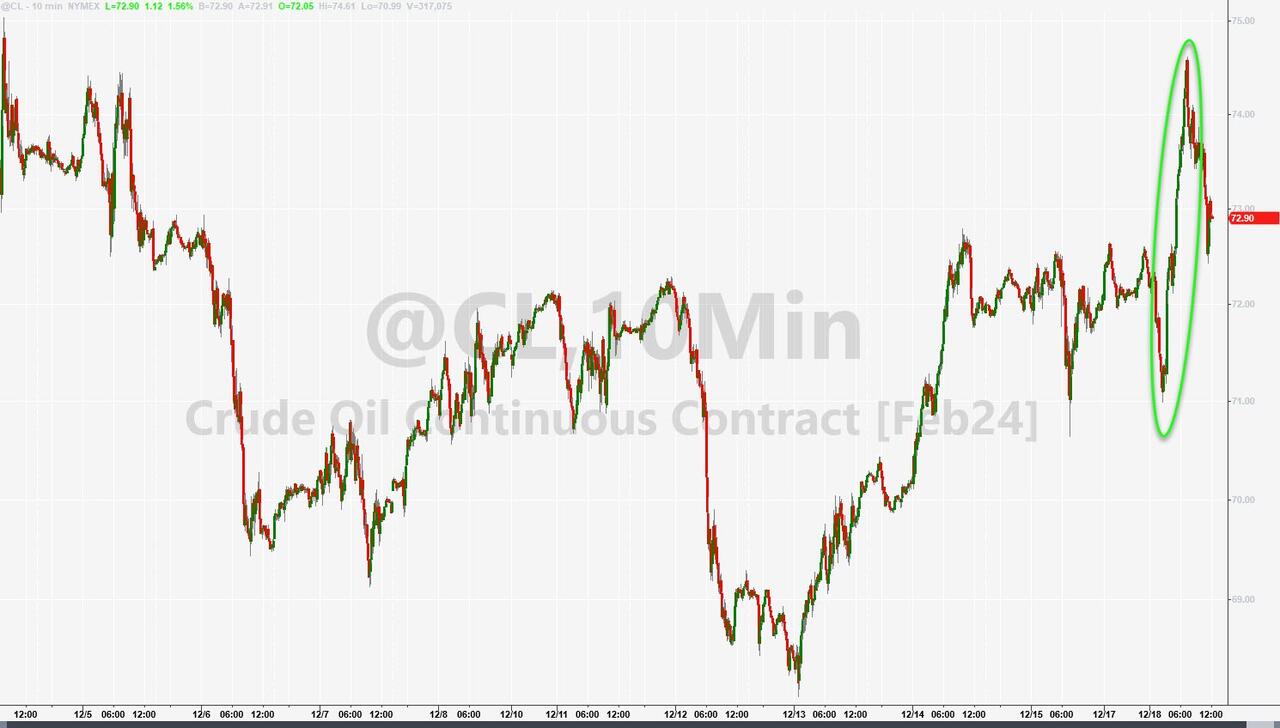
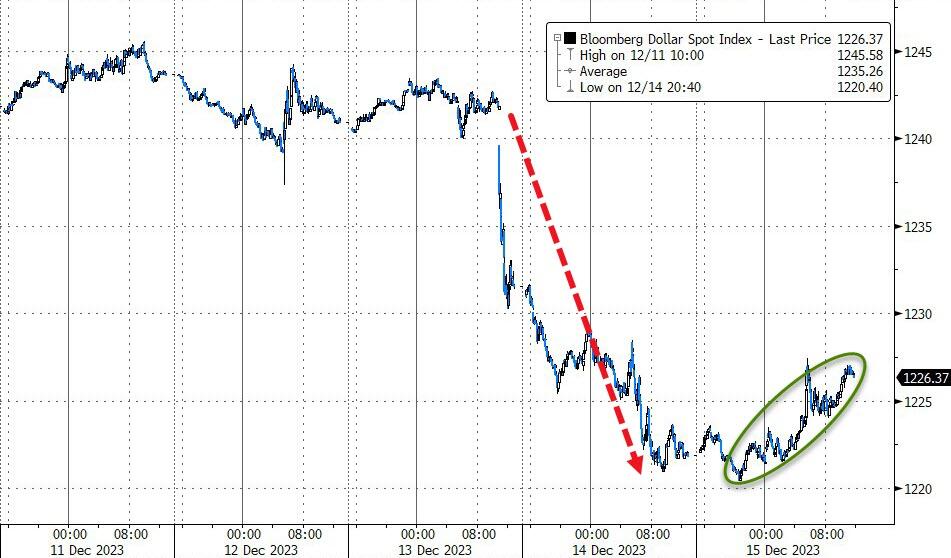
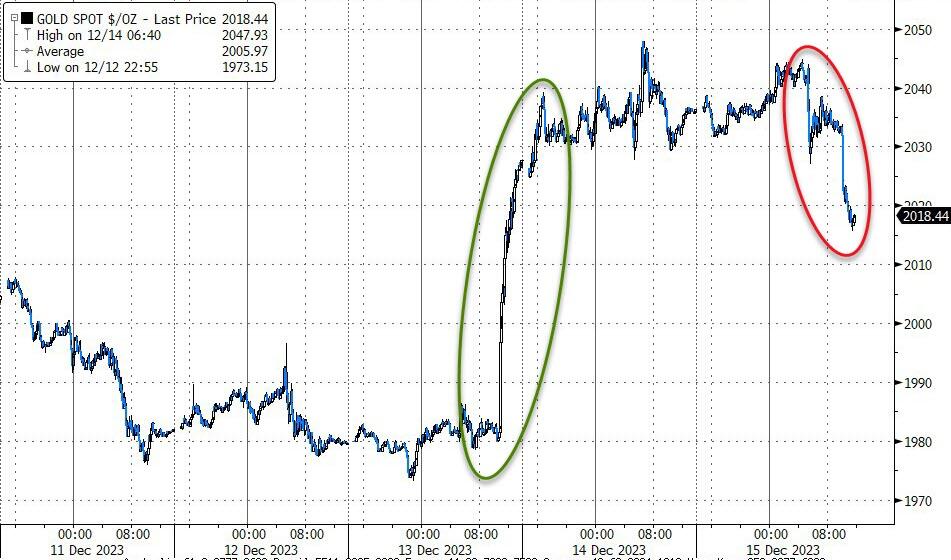
The dollar bounced back and erased most of yesterday’s losses, which weighed on gold. The precious metal slid lower. Oil also closed lower after briefly breaking above $75 yesterday.
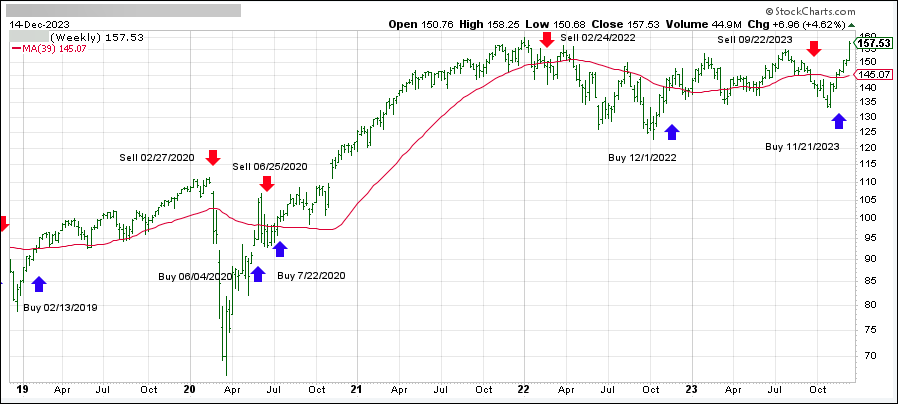
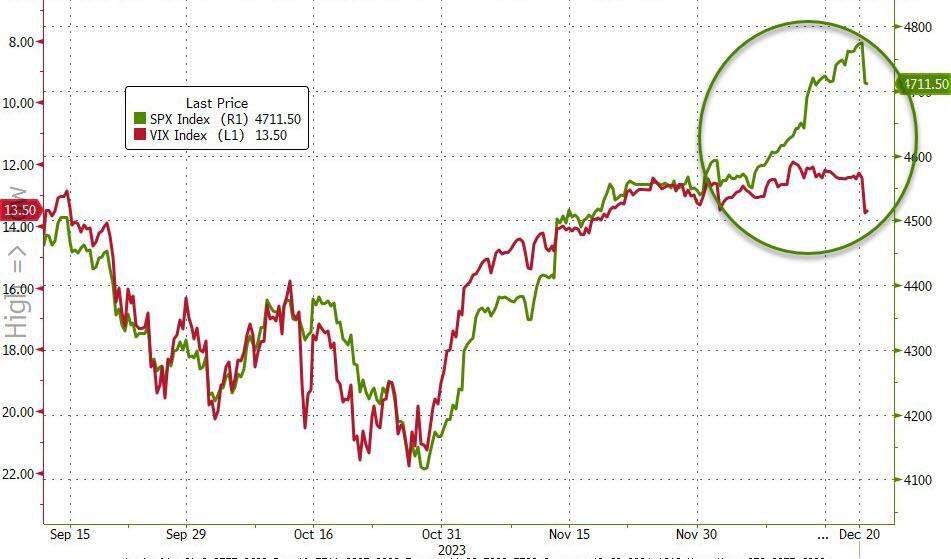
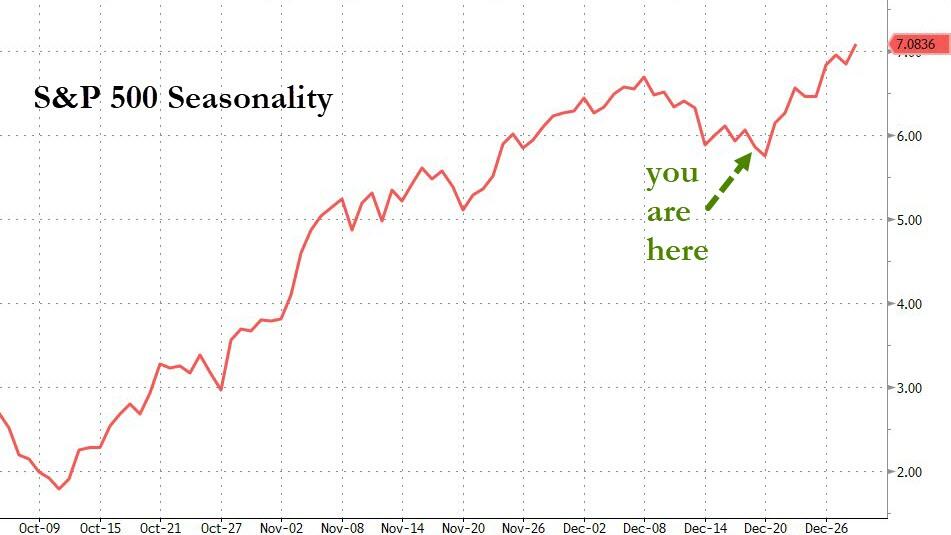
If the volatility index (VIX) is any indication, there could be more trouble ahead for the market, as this chart shows.
Will history repeat itself?
Read More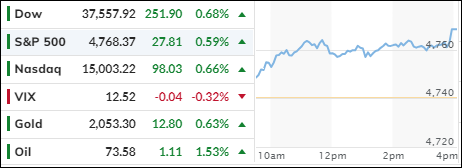

