
ETF Tracker StatSheet
You can view the latest version here.
HOW LONG CAN THE MARKET DEFY GRAVITY? S&P AND RUSSELL HIT EXTREME LEVELS

- Moving the markets
It was a wild ride for the market, but the bulls managed to win the day and keep the Santa Claus rally going.
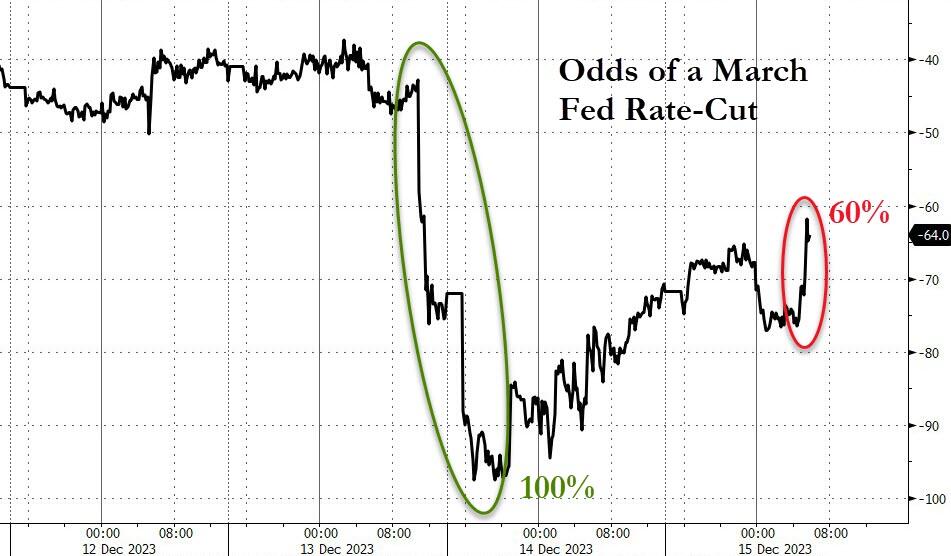
However, it was not smooth sailing. The market had to deal with a massive options expiration, which added a lot of volatility and noise. It also had to digest some mixed signals from the Fed, which seemed to backtrack on its dovish stance.
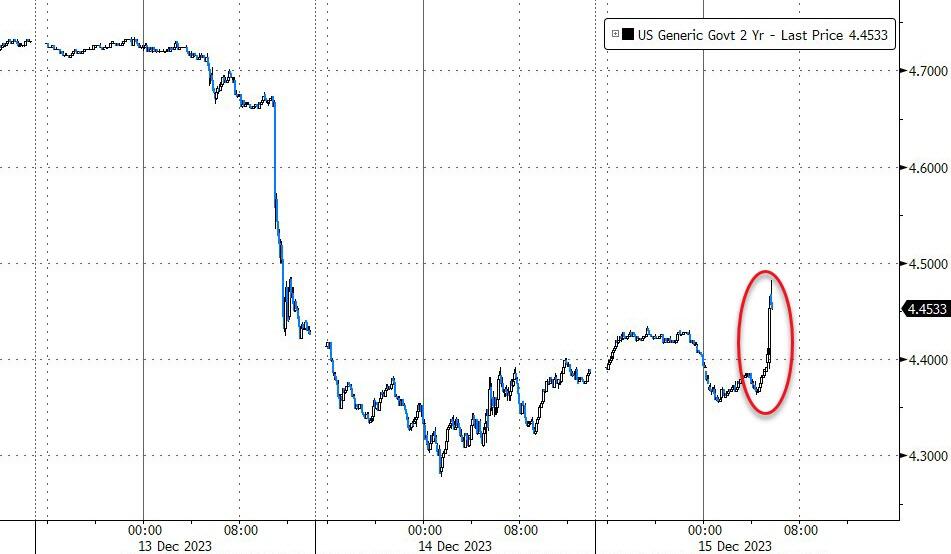
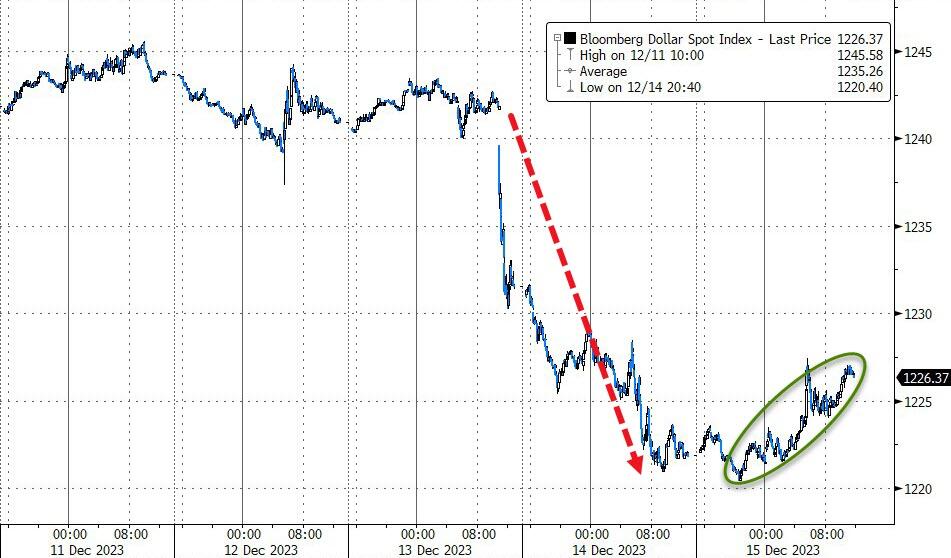
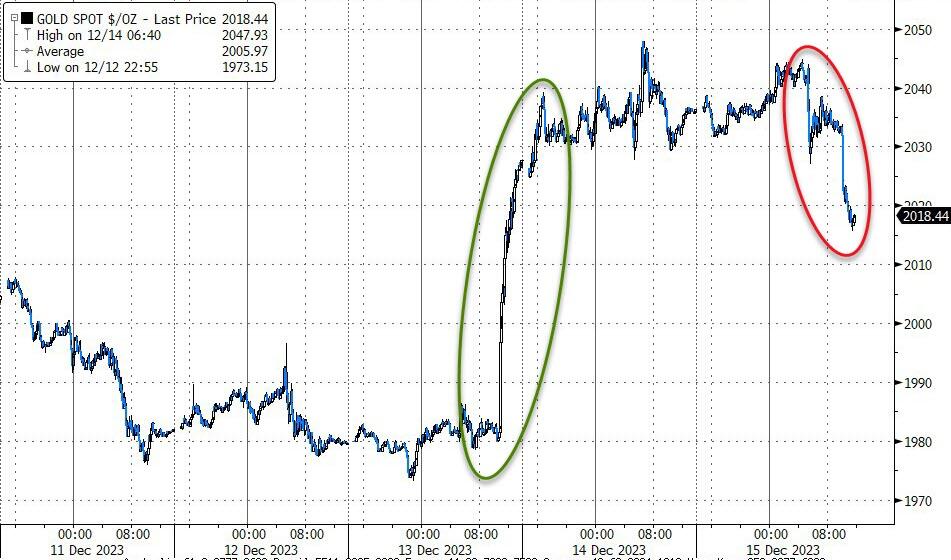
NY Fed’s Williams contradicted Powell’s hint of rate cuts, saying that they were not on the table right now. He also said that the Fed might need to tighten policy further if inflation stalled or reversed.
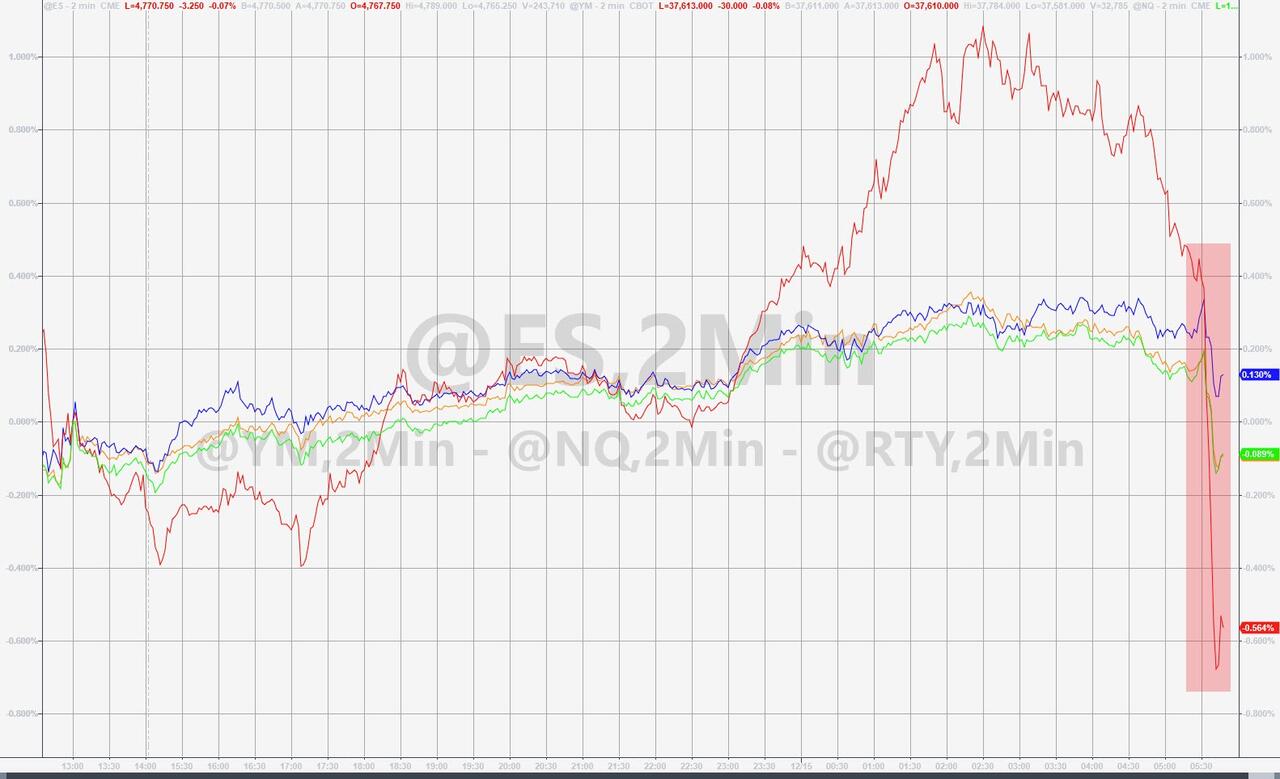
This spooked traders and sent stocks lower, bond yields higher, the dollar stronger, and gold weaker. The market also lowered its expectations of a March rate cut.
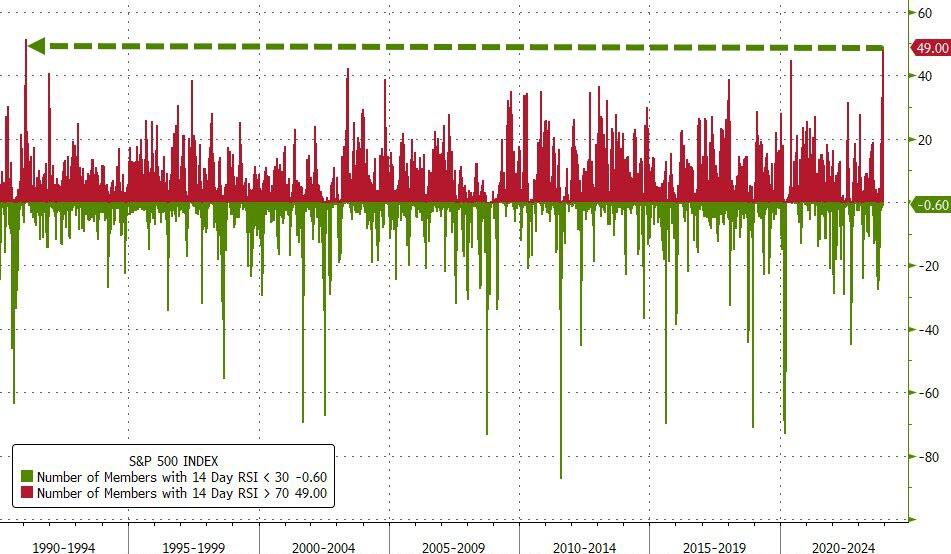
But despite these headwinds, the market recovered and closed higher, extending its impressive streak. The S&P has risen for seven weeks in a row, the longest run since 2017. Almost half of its components are overbought, the highest level since 1991.
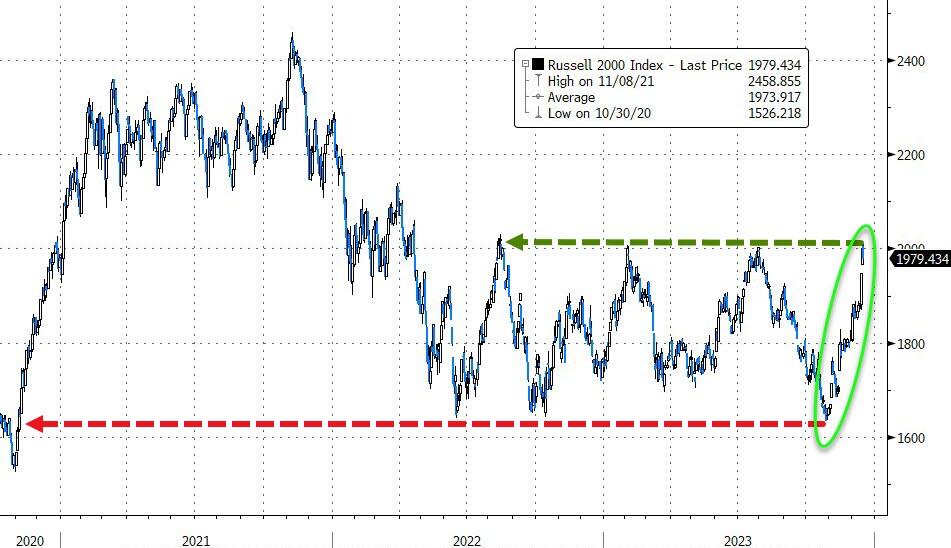
The Russell 2000, the small-cap index, has flipped from a 52-week low to a 52-week high in less than two months, the fastest turnaround ever. These are signs of a very strong and resilient market, but also a very stretched and euphoric one.
How long can this party last before the hangover kicks in?
2. Current “Buy” Cycles (effective 11/21/2023)
Our Trend Tracking Indexes (TTIs) have both crossed their trend lines with enough strength to trigger new “Buy” signals. That means, Tuesday, 11/21/2023, was the official date for these signals.
If you want to follow our strategy, you should first decide how much you want to invest based on your risk tolerance (percentage of allocation). Then, you should check my Thursday StatSheet and Saturday’s “ETFs on the Cutline” report for suitable ETFs to buy.
3. Trend Tracking Indexes (TTIs)
Despite the volatility caused by options expirations and the Fed’s Williams’ hawkish remarks, two out of the three major indexes managed to end the day in the green.
The gains were marginal, however, and our TTIs fell slightly from their peak levels. Nevertheless, they remain firmly in the bullish zone.
This is how we closed 12/15/2023:
Domestic TTI: +7.84% above its M/A (prior close +9.00%)—Buy signal effective 11/21/2023.
International TTI: +6.20% above its M/A (prior close +6.79%)—Buy signal effective 11/21/2023.
All linked charts above are courtesy of Bloomberg via ZeroHedge.
———————————————————-
WOULD YOU LIKE TO HAVE YOUR INVESTMENTS PROFESSIONALLY MANAGED?
Do you have the time to follow our investment plans yourself? If you are a busy professional who would like to have his portfolio managed using our methodology, please contact me directly to get more details.
Contact Ulli