Sunday Musings: Dr. Housing Bubble

Ulli Uncategorized Contact

Some time ago, I came across an interesting website dealing with the analysis of the California, and at times nationwide, housing market.

The site is appropriately named Dr. Housing Bubble and, in a recent article (12/26/07) it featured a special edition titled “Real State of Genius: Today we Salute you California with Our Real Home of Genius Award! 10 Homes throughout the Golden Bubble State.”

Here’s a snippet:

Happy holidays everyone! Hope everyone is enjoying the end of the year festivities. There’s a feeling in the air that everyone is maxed out. I was out in the Inland Empire this past weekend and saw very nice brand new homes going for $200,000. Prices are starting to take major downturns here in California. I’ve been getting a lot more e-mails from readers showing me Real Homes of Genius throughout the state. In fact, I would venture to say that this housing fiasco has enveloped the entire state of California into a Real State of Genius.

We featured 10 Southern California homes back in May and people still had doubts about a housing bubble. In today’s very special holiday report, we are going to show 10 homes throughout the state from Palo Alto, to Fresno, to Chula Vista that bring home this housing crisis. This should also show that this housing bubble is more than a subprime problem but a much larger and pervasive credit issue that will impact the entire economy.

Listening to the radio this weekend, they had a realtor from Las Vegas pleading his case that the government needs to bring back “alternative financing” to prime the pump. Yes! What a splendid idea. Instead of admitting the glaring problem, let us pump this bubble to the next dimension. This is tantamount to giving a meth addict more meth when they are in the middle of rehab because they cannot bare the withdrawal pains. Oh yes, our society is addicted to credit and even the rhetoric of “injecting” more liquidity should make you think about the psychological ramifications of comparing the Fed to some sort of doctor. Maybe they are comparing their valiant effort to that of Dr. Kevorkian.

If you have any doubts that we are in a bubble here in California, after seeing these 10 homes maybe your opinion will change. We’ll profile homes in posh areas, to not so prime areas to demonstrate that this manic housing bubble infected rich and poor alike. Greed crosses all socio-economic barriers. California is the golden state and land of Hollywood. Perfect weather and tan bodies are everywhere; that is if you are within a 10 mile radius of the coastline. Yet homes that are nowhere near the coast and have bad weather went up in price just like prime properties. It would seem that being in California was justification enough for sky-high prices. Today we salute you California with our Real State of Genius Award.

Read the full article to see pictures of the featured shacks and their price histories. If you’re not living in California, you will be simply amazed at the overpriced turkeys presented here. With no more Subprime borrowers and teaser financing available, there is only one direction for these home prices to go—and that is down.

Definition: Debt Crisis Vs. Liquidity Crisis

Ulli Uncategorized Contact

Several readers have asked if we are currently in a debt or liquidity crisis, or both. Minyanville’s Kevin Depew had an excellent write-up explaining the differences. Here is an excerpt:

Here is an interesting data point that many may not have noticed. Since the Federal Reserve Open Market Committee began lowering interest rates on Sep. 18, the S&P; 500 has declined more than 7%. For those that have noticed the decline, particularly the decline in shares of Financial stocks as the PHLX Bank Index (BKX) has plummeted by 24% since Sep. 18 – a bear market by any measure – the most frequently asked question is “Why isn’t the Fed’s liquidity working?”

It’s a reasonable question, after all, central banks in both the U.S. and Europe have said without equivocation that they will provide “as much liquidity as the market needs” to “fix” the problem. So why has this liquidity not been enough to maintain and support asset prices? Because this is not a liquidity crisis, it’s a debt crisis. The difference is important, and grasping it can help us sort through a number of market actions that appear to be counterintuitive.

During a liquidity crisis, the issue is one of supplying money to those who, for whatever reason, have suddenly shortened their time preferences. Mr. Practical, writing on Minyanville’s Buzz & Banter, characterized it this way:

“Suppose there is a rumor that a large bank has made a bad loan. Because banks lend out more money than they have on deposit – this is called a fractional reserve banking system – if everyone goes to the bank and demands their money at the same time, a liquidity crisis can occur because the bank does not have enough cash on hand to satisfy the demand from its depositors.
The Federal Reserve will then step in and provide liquidity, allowing the depositor demands to be satisfied. If the rumor of the bad loan proves to be false, then the issue is one of liquidity. Time preferences soon return to a more normalized state, depositors return, everyone feels better. But, if the rumor turns out to be true, it doesn’t matter how much liquidity the Fed provides, the bank will go bankrupt.”

Similarly, the issue today is not one of temporary liquidity, time preferences being shortened out of a temporary risk aversion. The issue is too much debt supported by too little value and income generation. As a result, time preferences are retreating, risk aversion is growing, and access to credit is diminishing.

If this subject fascinates you, I suggest you read the entire article. As always, Kevin makes his points succinctly and easily understandable even for the lay person.

No Load Fund/ETF Tracker updated through 1/10/2008

Ulli Uncategorized Contact

My latest No Load Fund/ETF Tracker has been posted at:

http://www.successful-investment.com/newsletter-archive.php

The bears continued their assault on the bulls and came out a winner again.

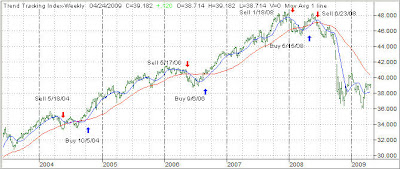
Our Trend Tracking Index (TTI) for domestic funds/ETFs has moved to +2.02% above its long-term trend line (red) as the chart below shows:


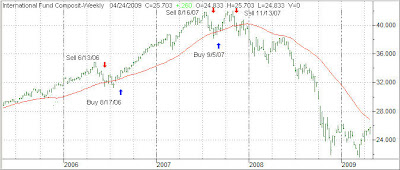
The international index dropped to -7.20% below its own trend line, keeping us in a sell mode for that arena.


For more details, and the latest market commentary, as well as the updated No load Fund/ETF StatSheet, please see the above link.

What A Difference A Week Makes

Ulli Uncategorized Contact

Not withstanding yesterday’s rebound, this year has been a tough one for all major indexes. Even many country and sector funds have seen their long-term trends interrupted if not ended.

Here are some interesting stats for the various investment orientations I track in my data base. As of 12/31/07, there were considerably more no load funds/ETFs showing strong momentum figures as compared to yesterday, only 9 days into 2008.

The tables below list the number of funds/ETFs for the major categories that show positive momentum figures (4wk, 8wk, 12wk, YTD), which means that their long-term trends are intact according to our tracking methodology:

As of 12/31/2007:

Domestic no load funds: 10 out of 598
Domestic ETFs: 6 out of 185
International funds/ETFs: 4 out of 67
Country ETFs: 6 out of 65
Sector ETFs: 31 out of 217
Bear Market funds/ETFs: 11 out of 48

As of 1/9/2008:

Domestic no load funds: 1 out of 598
Domestic ETFs: 0 out of 185
International funds/ETFs: 1 out of 67
Country ETFs: 2 out of 65
Sector ETFs: 24 of 217
Bear Market funds/ETFs: 42 out of 48

The interruption of the up trend is obvious, what can’t be confirmed at this time is if this is just a temporary reversal or the beginning of more downside activity. Since no one can answer that question, you can only do one thing to protect yourself from the uncertainties of the marketplace: Use your sell stops diligently! If you heard me pounding on this fact before, you are right; there is nothing more important than controlling risk in an economic environment that gets cloudier by the day.

Towards Bear Market Territory?

Ulli Uncategorized Contact

Yesterday’s sudden market reversal to the downside pushed our domestic indicator Trend Tracking Index (TTI) further towards bear market territory. The domestic TTI is now positioned only +2.32% above its long-term trend line, while the international TTI has slipped even further south to -6.91%. This again confirms our Sell signal in that area, which was effective as of 11/13/07.

It seems like weakness is spreading to a variety of sectors where current trends may come to an end as well. Such was the case with PBW, which hit our pre-set 10% sell stop point and was sold early yesterday morning prior to the markets washing out.

A couple of other sector holdings are within striking distance, and we will execute the sell stops as necessary. With the Dow just having had its worst first five trading days of the year ever, it behooves to pay attention to some words of wisdom. MarketWatch featured a story by Bill Donoghue titled “Into the woods.” Here are a few snippets:

Perhaps the three worst things that can happen to your portfolio now are: Buying stocks hitting new records (that’s behind us); selling too late, and passively failing to protect your assets.
Fortunately, you have some time to react. First, ignore advice to “stay the course,” and observations that “index funds are cheap and bond funds are safe.” That’s useless in a bear market. Index funds and balanced “lifecycle” funds lose when their benchmarks decline and bond funds lose when interest rates rise.

That’s been my experience as well. Especially, don’t fall for the “cheap” index fund story. That approach may work fine in a bullish environment but will be devastating should we slide further towards a bear market scenario.

“Big Ben” Bernanke’s time may be up. The Fed is not helping matters much. Interest rate cuts may slow the stock market’s decline, but it undercuts the value of the U.S. dollar. As the dollar erodes, foreign investors, mostly from the Middle East and Asia, use their stronger currencies to buy into Wall Street firms at fire-sale prices.

The regulators dropped the financial ball. The ratings agencies, real estate appraisers, mortgage bankers, realtors and the lenders all have conflicts of interest. Banks, thrifts, insurance companies and other financial institutions are continuing to write-off subprime debt. Don’t buy their sales pitches.

Remember, everyone has some bias. There will be times that we will pass through a transitional phase where cash in money market is a great option. Don’t be in a hurry to throw your money at some hot fad ETF. Follow the trends to make your decisions.

What can you do? Invest in exchange-traded funds or mutual-funds that are geared to profit from market and sector declines. These so-called inverse funds, or related bear-market funds, are available from ProFunds and ProShares, Rydex Investments and Direxion funds.

While our domestic TTI has not given the signal to stand aside yet (or get into bear market funds), there are already opportunities in selected short ETFs. Short commercial real estate and financials have done very well. Be aware that many carry the description “ultra,” which means that performance is twice of the underlying index. That can produce nice profits, if you’re right and timely, but can also accelerate losses.

For example, we have a few aggressive portfolios containing SRS, but with only a 5% allocation due to the high volatility. How much volatility? For the 10 days we’ve been holding this ETF, it’s up 19%—so be careful with aggressive ETFs and, most importantly, never ever work without a sell stop.

ETF Investing: Making A ‘Buy’ Decision

Ulli Uncategorized Contact

Reader Gy posted an interesting question, which I like to share with everyone since it addresses a problem faced by most investors.

Here’s what Gy had to say:

Thanks for your assistance. In fact, I bought GDX and SLV two weeks ago.

However, in regards to the energy ETF fund and agriculture Fund I am stuck here. From your fund list, currently UCR and DBA have the best M-index 12. My feeling is I am little bit afraid of investing in both of them, and actually I have been waiting for two weeks because I felt both of them were in an overbought region thus I wanted to wait for a pullback.

However, it looks like the more I wait the more hesitation I now have because UCR did have a pullback and it may retreat more. DBA did not pull back and it even entered a much more overbought region. This may be a very common question for use with your models, please let me know how I can solve this problem.

This is a very common question to a common problem we all face—investors and advisors alike. Once you have analyzed a mutual fund/ETF, looked at the momentum figures and consulted the charts to confirm that an uptrend is indeed intact, you have reached the point where the rubber meets the road. In other words, there is nothing left to do than making a decision to buy.

However, before you do, there are two items you need ask yourself to clarify in your own mind how to control and limit the risk of this investment:

1. How much of your portfolio are you going to invest? That factor strictly depends on your own risk tolerance. Since we’re discussing more volatile sector funds, I personally allocate no more than 10% of portfolio value to any one sector. You can use any percentage you are comfortable with.

2. You need to determine your sell stop point, so that you can track it daily. The only way you can gain any piece of mind when investing is by using clearly defined entry and exit points. In regards to the latter that means how much are you willing to lose before admitting that you were wrong about the trend direction before you get out? If your attitude is that you don’t want to lose, then you should not invest because losses are part of the equation, whether you like it or not.

The key issue here is not to avoid losses, because you can’t, it is keeping them small enough so that any one bad/early/wrong decision does not wipe you out, but keep you in the game.

Here’s how I approach it. Once I made my investment in a sector ETF, I track it daily and monitor my trailing sell stop point. If it goes my way, the sell stop point will eventually stop me out at a profit whenever the trend turns.

If it doesn’t go my way, and the markets head south they will eventually trigger my 10% stop loss (using day end closing prices only; not intra day data); I will have lost 10% of my investment. If I allocated, as mentioned above, 10% of my portfolio value, the net effect on my portfolio will be a negative 1%. That was the risk I took when I entered this trade, and I was fully aware of it. To be clear, for volatile sector and country funds, I use a 10% trailing stop loss while for domestic and broadly diversified equity funds, I use 7%.

So my risk is always known and that’s how you should to look at it too. Could you reduce your risk even further by using tighter stops? Sure you could, but I don’t recommend it since the markets need to have some room to “breathe.” If you keep your stops too tight, you will be whipsawed constantly.

I want to go one step further by saying that if this type of risk scenario is something that makes your stomach turn, you should not be investing in the market place. Risk will always be present; the key is to limit it as discussed. Right now, with the markets in a shakeout mode, even trying to get onboard of established long-term trends may feel like riding a bucking bronco. Sooner or later trends will become more firmly established which will make it easier for us ride them until they turn.