Buying Time

Ulli Uncategorized Contact


It was nip and tuck for a while as the major indexes plunged right after yesterday’s opening. The subsequent rebound attempt held for a change and buying during the last 30 minute lifted the averages (except the Nasdaq) out of the doldrums.

As discussed on Monday, the S&P; 500 bounced off its 1,040 support level twice; an encouraging sign for many traders. The euro gained helping metals and energy prices to move up as well.

After all the recent selling some kind of rebound was overdue, but it certainly does not guarantee a new bottom is in. To me, it merely means that we have bought some time as the 1,040 level is certain to be tested again.

For right now, however, a domestic sell signal did not materialize as the domestic TTI moved slightly higher and is still positioned above its long term trend line— although by only a very meager +0.46%.

Honing In On Bear Market Territory

Ulli Uncategorized Contact


When the intra-day mini crash of 1,000 points in the Dow occurred on May 6, most investors thought of it as an aberration and did not consider the possibility that we might actually revisit that price level.

Here we are 30 days later, and we have broken through it decisively. Yesterday’s rally attempt was wiped out during the last 30 minutes of trading, and the major indexes closed at their lows for the day.

Our international Trend Tracking Index (TTI) has been stuck in bear market territory since 5/7/10 (currently at -5.94%), while the domestic TTI has been hanging on by staying above the trend line. At times it has come within striking distance of succumbing to bearish forces before the bulls managed to save the day.

Yesterday’s sell off pulled the domestic TTI again to within +0.12% of moving into bearish territory; close, but no cigar. Another down day similar to yesterday, and we will surely be heading below the line.

If you followed and executed my recommended sell stop discipline, you should have sold your domestic equity holdings some time ago, so, when the actual sell signal occurs, it is merely a formality confirming the already established downward trend.

If you have a small equity position left you wish to hold for whatever reason, you may want to consider hedging it once we have actually broken below the trend line for the domestic TTI.

In our managed accounts, we actually have such a (conservative) mutual fund that covers some equities, bonds, gold, silver and currencies. Due to the size of the holding, and the fact that we are still partially within the 90-day redemption period, I may hedge it for the time being to guard against sudden further down moves.

Market technicians are trying to figure out whether we are near a bottom or not. The 1,040 level of the S&P; 500 offers the nearest support by being part of a long-term trend line since last July.

However, with the European debt crisis only being in the first inning or so, nothing would surprise me on the downside. We could take out that 1,040 level before breakfast today and be back in no man’s land.

Right now, we are still in that range where establishing new long positions doesn’t make any sense while it’s too early (and risky) to get involved in outright short ones. Be patient and wait for the market to give a better indication as to where we’re headed next.

Should You Buy Oil Now?

Ulli Uncategorized Contact

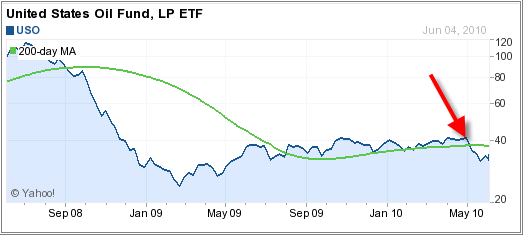
Several readers have emailed wondering whether oil would be a good buy at this level. The most obvious reason has been the devastating oil spill with all its implications. Let’s take a look at a 2-year chart of oil as represented by USO, the heavily traded ETF:


As you can see, oil has gone nowhere in the past year and has pretty much traded slightly above its long-term trend line before breaking it sharply to the downside late in April 2010 (red arrow).
Last Friday alone, USO dropped 4.61% and now resides below its long term trend line by -13.84%. Year to date, it’s down almost 17% and all of its momentum numbers are negative.

Apparently, many readers were of the opinion that oil should rally in view of the current oil spill. The reason that this did not happen, and the opposite occurred, is that oil prices fluctuate based on supply and demand in regards to economic activity.

The European debt crisis has again raised fears of a double-dip recession causing oil and energy products to head south. Look at the chart again. You can clearly see that this is what happened in September 2008, as the recession took hold, USO broke through its long-term trend line and those who held on suffered steep losses.

Given the fact that a resumption of the recession is a real possibility during the second half of this year, oil could head even lower. So, when would it be a buy?

I would consider it once it moves back above its long term trend line. At that point, at least you would have some assurance, although not a guarantee, that upward momentum has been restored. In the meantime, stay away from it as bottom fishing could be hazardous to your financial health.

Disclosure: No positions in USO

Sunday Musings: 5 Star Mutual Fund Ratings

Ulli Uncategorized Contact

In the new world of ETFs, it seems almost archaic to talk about Morningstar’s mutual fund ratings. But with many investors still being stuck in 401ks with only mutual funds a choice, it’s still a valid topic.

MarketWatch reports that “Five-star mutual funds don’t live up to their past:”

Tim Courtney decided he’d had enough. In meeting after meeting this year, he and his colleagues at Burns Advisory Group had recommended mutual funds to prospective clients, only to be hit with the same response almost every time: Why are you telling me to invest in a three-star rated fund?

That sums up the way many investors allocate money to funds — look at products that have four- or five-star ratings from investment researcher Morningstar Inc., take that as an imprimatur of quality and hope for the best. Such decisions are perhaps even more common in volatile markets, when anxious investors view top-ranked funds as somehow better-equipped to handle adversity.

Five-star funds in particular seem to have their own allure. Even in 2008’s brutal market, when the other star-rated funds saw net outflows ranging from $111 billion for three-star funds to $14 billion for four-star funds, five-star funds enjoyed $67.5 billion in net inflows.

The trouble is that investors seem to forget that star ratings look backward based on a fund’s past performance, and studies have shown the ratings have no predictive value.

“Having to get over that hurdle [explaining how star ratings shouldn’t influence choices], every time we recommended a fund that wasn’t five-star, is something we have to do time and time again,” said Courtney, chief investment officer of Burns Advisory, which manages about $300 million and advises about $150 million of 401(k) assets.

So Courtney and his colleagues went back to Dec. 31, 1999 and studied the subsequent 10-year performance of five-star funds. What he found might convince investors to kick their star-rating habit.

Of the 248 stock funds with five-star ratings at the start of the period, just four still kept that rank after 10 years. The 218 domestic stock funds with the rating typically lagged their category averages over the period — not just the benchmarks, but other mutual funds. The exceptions were 30 foreign large-cap funds, which had a 10-year annualized return of 1.44% compared with their category average of 1.32%.

In other words, it’s not just that five-star funds don’t, on average, continue to lead their peers, but they actually do worse in subsequent years.

There is much more to this article; if the subject interests you, be sure to read the entire link.

Personally, I have never seen the value of that rating system; I have found that if you wait long enough, your favorite 5-star fund may end up in the 2-star category and vice versa.

Using these ratings, investors get lulled into a false sense of security by believing that highly rated funds will hold up well in all types of market conditions. That false belief has turned into a very expensive lesson as the bear markets of 2001 and 2008 have clearly demonstrated.

I don’t care what rating a mutual fund has, whether it’s no load or load with high or low annual expenses; it will get clobbered when a bear market strikes—period. Only by being out of the market altogether during lengthy downturns can you avoid a serious portfolio haircut.

Sure, if you have assets in a 401k plan, you could use the ratings system to make your choices at the beginning of a bullish period, as long as you’re aware of the shortcomings once that trend comes to an end.

Better yet, use the 401k section of my StatSheet to verify that your selected 5-star fund is showing indeed upward momentum to justify a purchase.

The bottom line is that whether mutual funds or ETFs are on your equity menu, you need to recognize that neither will protect your principal during lengthy downward trends (unless they’re bear market funds). If you haven’t learned this valuable lesson from history, you’re doomed to repeat it.

The Tip Of The Iceberg

Ulli Uncategorized Contact

Jim Jubak wrote an interesting piece a week ago titled “Euro crisis is tip of the iceberg.” It’s a bit lengthy but well worth the read.

Someday the euro debt crisis that started in Greece and spread to engulf Europe will be over.

Politicians in the nations that use the euro will figure out the right mix of carrot and stick to get Greece, Portugal, Spain and other member states to adhere to European Monetary Union limits on debt. They’ll figure out how to balance national pride with the clear need for more-integrated fiscal systems among the members. They’ll gradually earn back the trust of financial markets, and someday we’ll all be back talking about the euro as a rival to the U.S. dollar as a global reserve currency.

Hard to believe right now, when the euro’s troubles are driving plunges in the world’s stock markets and rampant fears that the world is about to fall back into economic and financial crisis.

Hard to believe but true.

Here’s something, however, that may be even harder to believe: The euro debt crisis, for all its power to shake financial markets and the global economy, is just Chapter 1 in a story that will run for the next two decades. This crisis is only our introduction to the kinds of wrenching changes that virtually every nation’s economy will face over the next 20 years.

The euro debt crisis is a crisis coming to a nation near you. And let’s hope the next chapter suggests that there’s an ending to this story that doesn’t involve street riots and a long-term decline in living standards for entire populations.

Let’s hope. But the lesson from the euro debt crisis is that it’s not going to be easy. It may not even be possible.

You probably don’t think of the euro debt crisis as part of some larger global story that is going to pull in you and your family as starring characters. But it is. This isn’t just a story about some feckless Greeks who went on wild shopping sprees with money lent to them by hardworking Germans who didn’t check the books carefully. (But it is that story, too.)

Some basic economics make the Greek crisis universal.

From the first quarter of 2001 to the third quarter of 2009, unit labor costs in Greece — that’s how much a worker earned for producing one unit of something — rose 33%. That’s a 33% increase in the cost of producing one gimcrack in Greece after you’ve deducted all the benefits of any increase in the productivity of Greek workers. In other words, if a Greek worker went from making one gizmo an hour to making two an hour and got paid twice as much for that hour, the unit-labor-cost increase would be 0%.

Greek productivity did climb, at an average annual rate of about 2% from 2000 to 2010. Greece showed the same productivity growth as Germany, but wages climbed faster. According to Greece’s national collective labor agreement, wages rose 6.2% in 2006, 5.4% in 2007, 6.2% in 2008 and 5.7% in 2009.

The result was that Greece priced itself out of global export markets. If your unit labor costs climb 33% while those of Italy go up just 30% and those of Spain 28% — and while Germany’s costs increase just 6% and U.S. costs plummet 27% (as they did from 2001 to 2009) — you can be sure that selling your exports will get harder.
…

The combination of falling competitiveness and an aging population would be lethal enough — fewer workers making less-competitive products to support an increasing number of retired workers — but the Greek government has made it worse. To win voters’ support, governments of all parties not only promised those hefty wage increases, but they also promised generous pensions at earlier ages.

Before the crisis, for example, Greek civil servants employed before 1992 could retire after 35 years on the job if they were 58 or older. And the pension benefit is 80% of pre-retirement salary. The legal retirement age for all workers was just 61 before the crisis. In reaction to the crisis, the current government has proposed raising the retirement age to 63. (No wonder German taxpayers are steamed at the idea of having to fund a Greek rescue plan. The German retirement age is 67.
…

Greek politicians weren’t alone in promising future benefits to voters. The average burden of debt, plus liability for pension and other social-service promises, averages 434% of GDP across the European Union. France, with its relatively generous social benefits, comes in at 549%. The United Kingdom stands at 442% and Germany at 418%. Spain, which has a bigger current deficit but relatively modest promises to its citizens, shows up in Gokhale’s calculations at 244%.

And the United States? By these calculations, the debt-plus-promises burden comes to 890% of GDP. Move over Greece. Who’s your daddy?

Now governments could take the next decade or two to plan ways to meet or shirk this burden. Countries could set a schedule of raising the retirement age so that everyone would know what was coming and could plan for it. More-generous incentives for private savings for retirement and retirement health care could help make reductions in government-funded pensions less punishing. Subsidies could give some retirees incentives to choose less-expensive retirement housing.

Governments could do that.

But the evidence of the Greek crisis is that they won’t. Politicians in Greece didn’t take action until the country’s back was to the wall and they had the cover of a crisis to excuse their cuts to wages and future promises. It’s sad to think that a country’s leaders would prefer riots in the streets to proposing painful measures before the situation reaches a crisis, but that’s the conclusion I draw after watching how the Greek crisis has played out.

The transition that I’m describing from a world of glorious promises to an admission that we can’t pay for the promises to a long period of reneging on those promises would be painful enough if carefully planned and managed. But without that planning, I think we’re going to see most — but not all, I hope — countries lurch from crisis to crisis as governments downsize their promises to fit an aging world.

All industrialized nations are pretty much in the same boat as far as debt overload is concerned. It will take just one default, and the domino effect will take over.

Too farfetched?

I don’t think so. A few days ago, during my travels, I read on Bloomberg that the Greek government has engaged the services of a few British economists.

So far their unanimous recommendation has been for Greek to leave the EU and default on their debt. The jury is still out on that one, but watch out for stock market reaction once that possibility is not only seriously considered but actually executed.

It may not be a popular view, but I believe that much of today’s debt can’t possibly be repaid and will eventually be defaulted on. While I am not sure when the first shoe will drop, once it does, we will very likely find ourselves in bear market territory in a hurry.

Fortunately, there are a host of bear market funds/ETFs available, which are featured in my weekly StatSheet, to let us take advantage of that type of trend reversal, whenever it occurs.

No Load Fund/ETF Tracker updated through 6/3/2010

Ulli Uncategorized Contact

My latest No Load Fund/ETF Tracker has been posted at:

http://www.successful-investment.com/newsletter-archive.php

A rebound early in the week was annihilated today via a poor jobs report and negative news from Europe.

Our Trend Tracking Index (TTI) for domestic funds/ETFs remains above its trend line (red) to the upside by a scant +0.52% (last week +1.06%) keeping the current buy signal intact. The effective date was June 3, 2009.


The international index broke below its long-term trend line by -5.12% (last week -3.90%). A Sell Signal was triggered effective May 7, 2010. We are no longer holding any positions in that arena.

[Click on charts to enlarge]
For more details, and the latest market commentary, as well as the updated No load Fund/ETF StatSheet, please see the above link.