Do you want to know which ETFs are hot and which ones are not? Then you need my High-Volume ETF Cutline report. It tells you how close or far each of the 311 ETFs I follow is from its long-term trend line (39-week SMA). These are the ETFs that trade more than $5 million a day, so they are not some obscure funds that nobody cares about.
The report is split into two parts: The winners that are above their trend line (%M/A), and the losers that are below it. The yellow line is the line of shame that separates them. You can see how many ETFs are in each group and how they have changed since the last report (270 vs. 244 current).
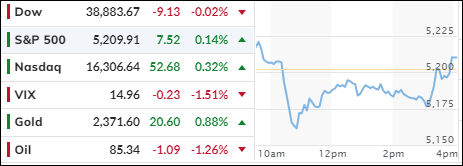
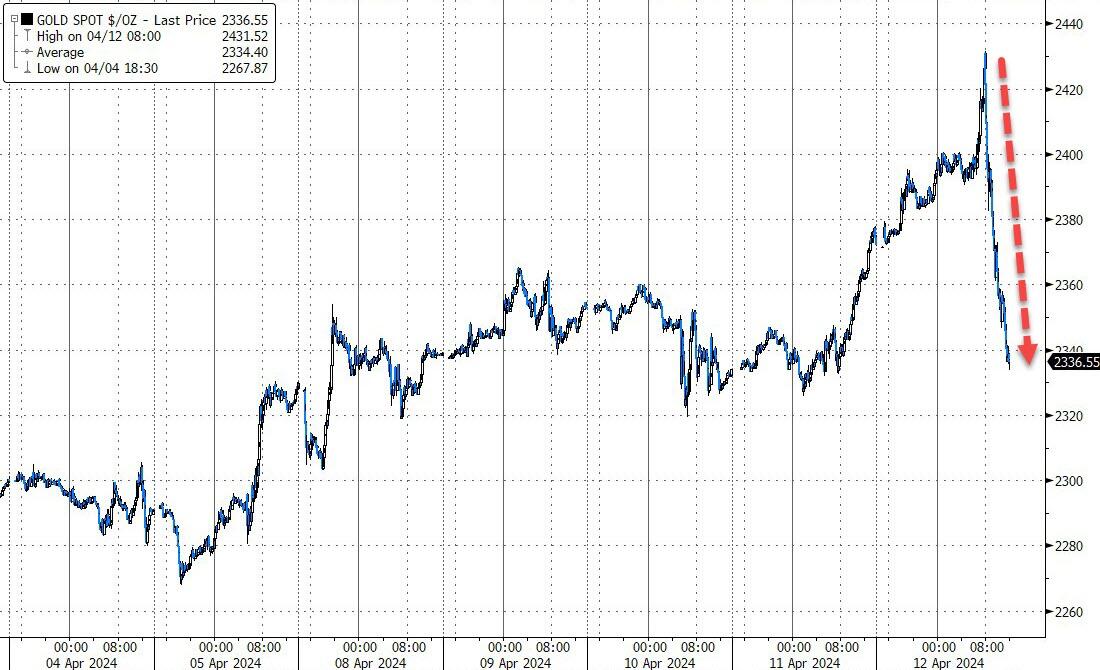
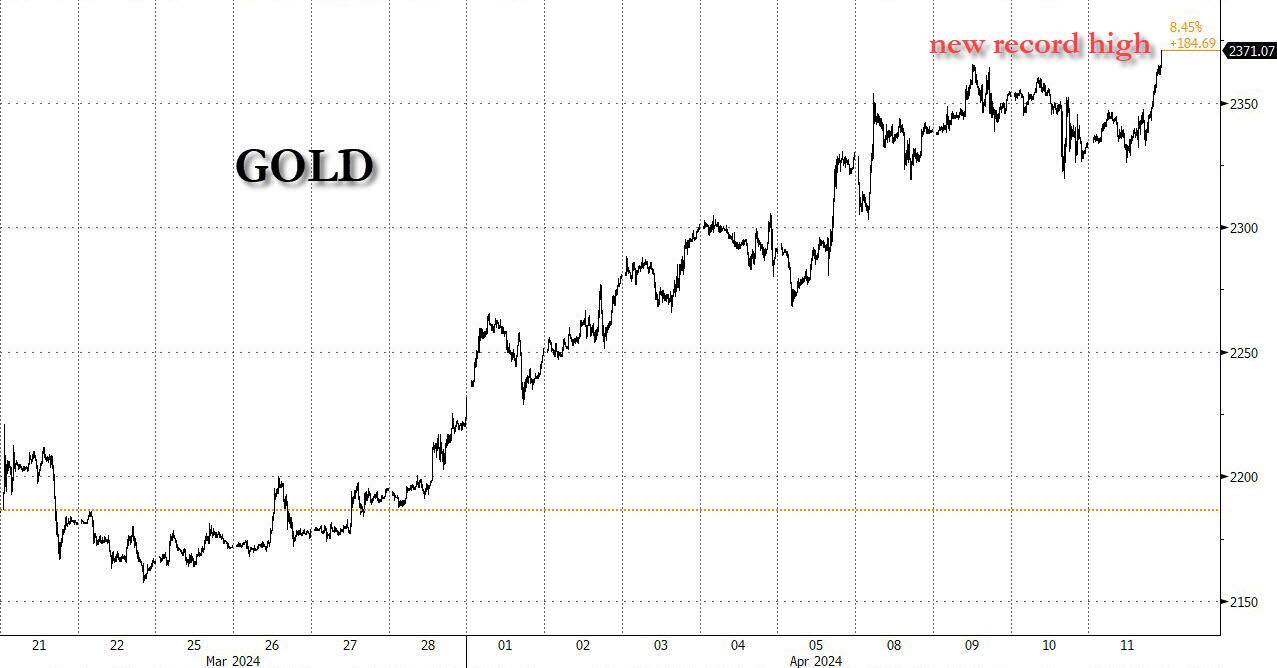
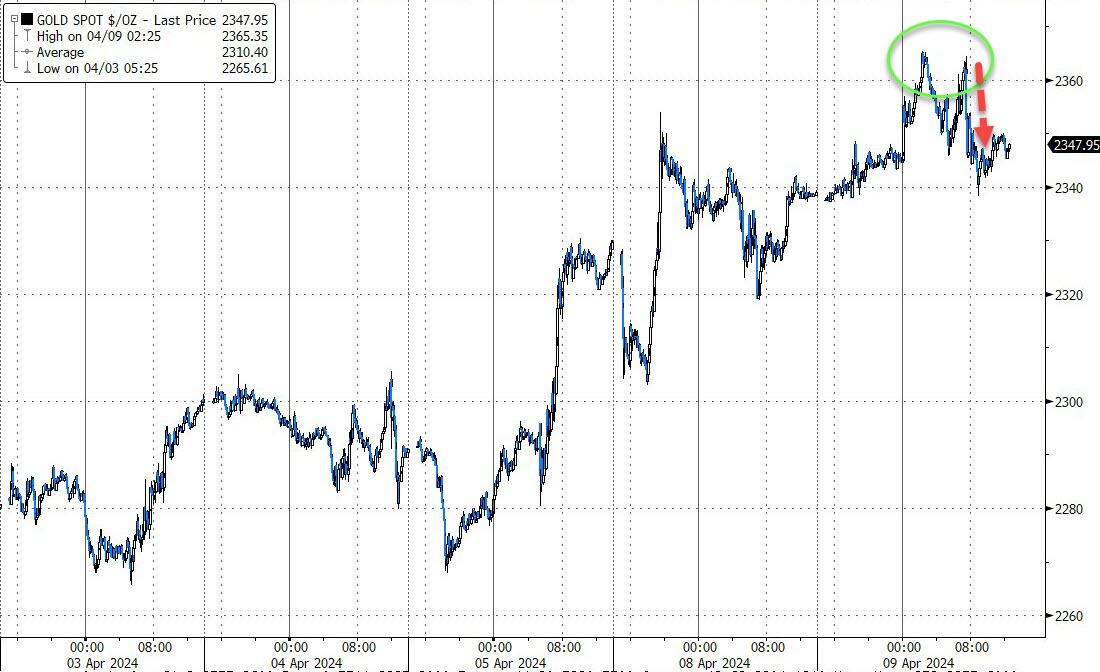
GOLD GLITTERS AMID MARKET GLOOM, OUTSHINES S&P 500 IN TURBULENT TIMES
[Chart courtesy of MarketWatch.com]
Moving the markets
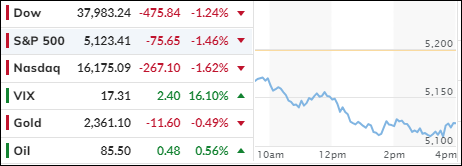
Today, the stock market experienced a sharp decline as major U.S. banks began reporting their earnings amidst a backdrop of inflation and geopolitical tensions.
JPMorgan Chase’s shares fell over 6% following its first-quarter earnings report, which suggested that net interest income might fall short of analysts’ expectations for 2024. CEO Jamie Dimon highlighted ongoing inflationary pressures as a concern for the economy.
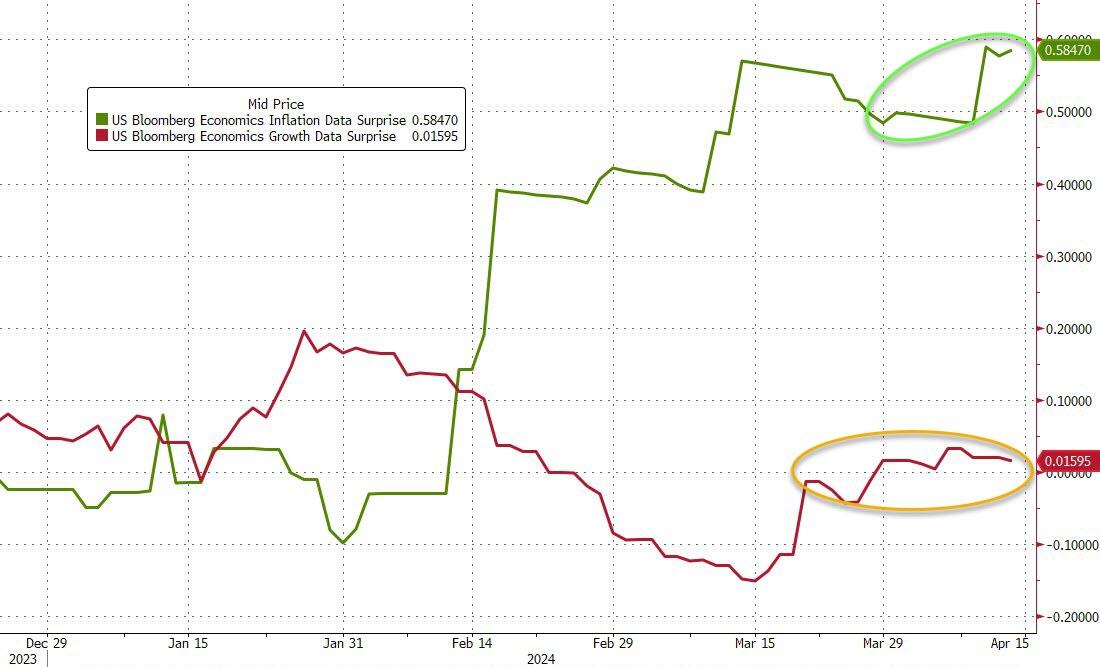
The persistent rise in inflation, which has yet to fully manifest, is causing traders to question the Federal Reserve’s ability to counteract this trend. This skepticism has been a recurring theme in my analysis over the past few years.
The combination of escalating debt, deficits, continuous military engagements, and diminishing confidence in the government has driven investors towards gold, which has yielded a year-to-date return of +13.45%, significantly outperforming the S&P 500’s +7.48%.
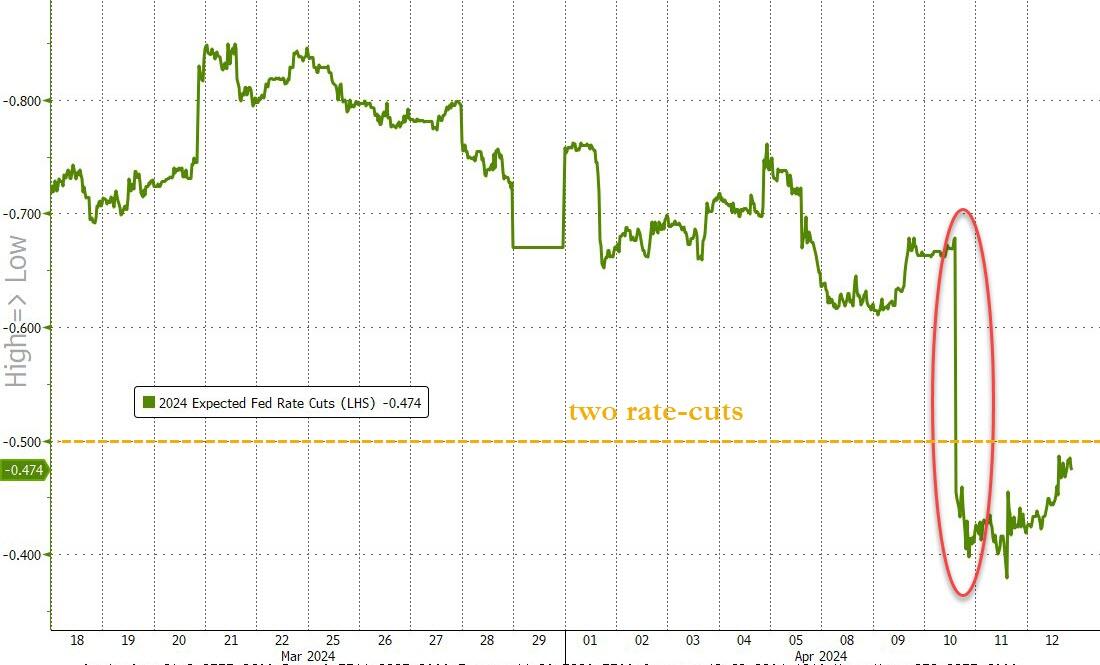
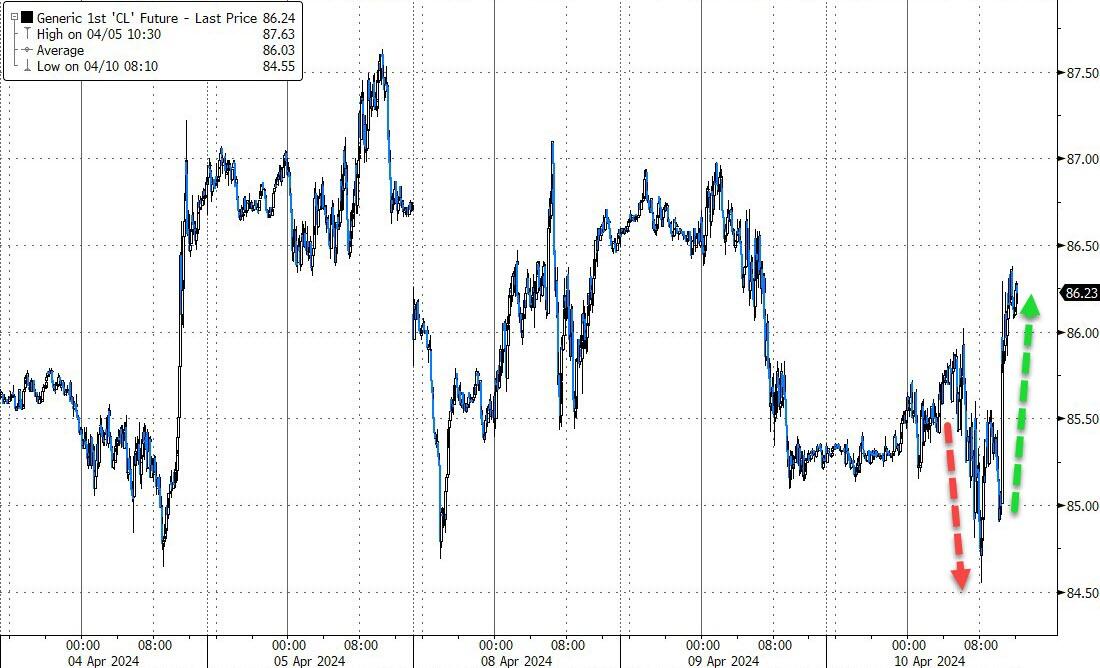
Oil prices have surged on reports of potential military action in the Middle East, contributing to the inflationary worries that are already pressuring the market. Meanwhile, the Federal Reserve’s indication of fewer rate cuts has raised concerns about asset valuations.
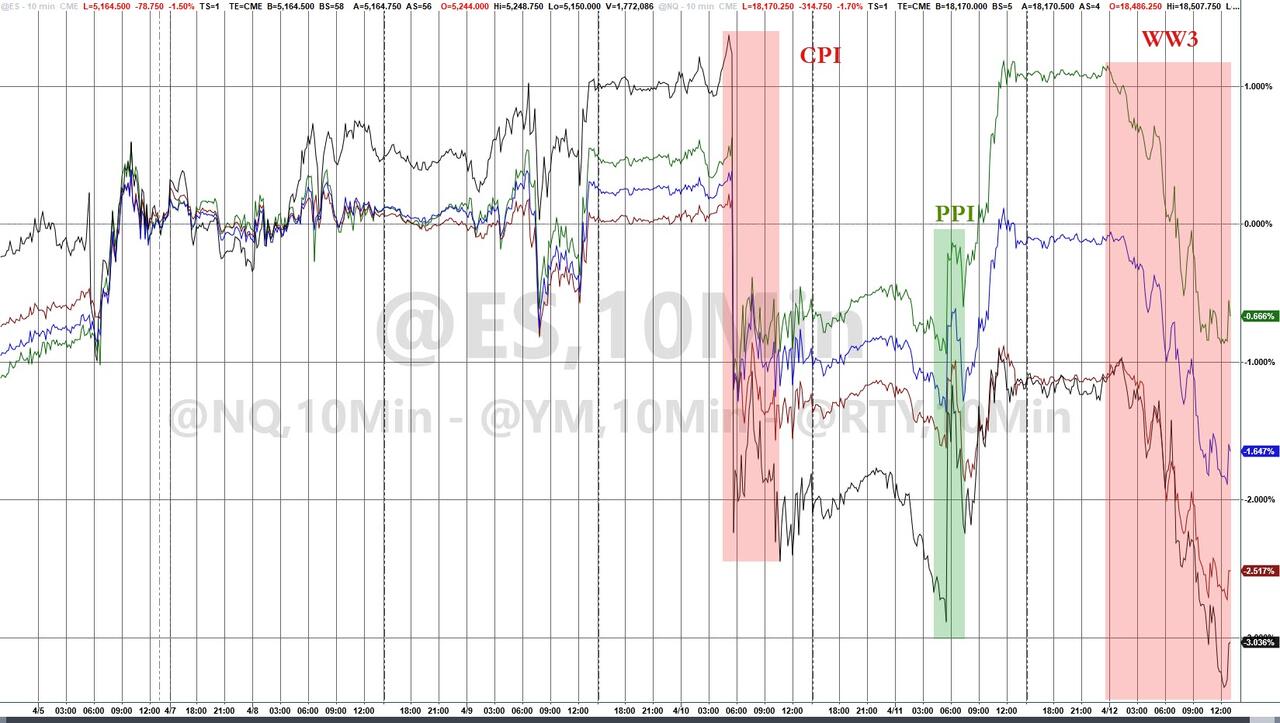
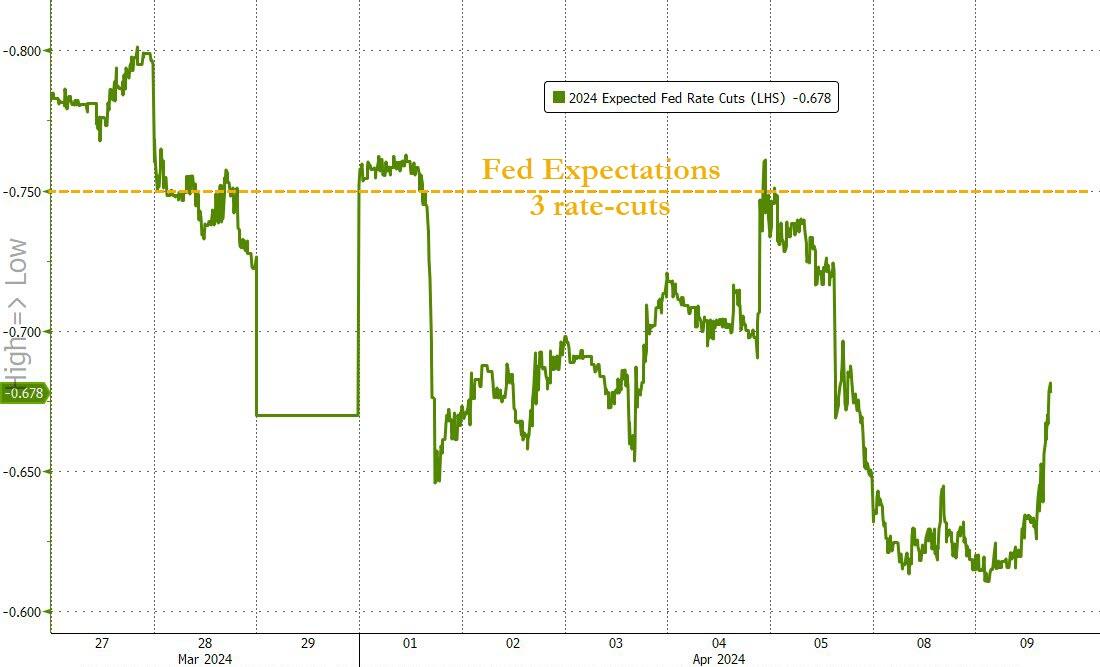
This week’s inflation indicators, including the Consumer Price Index (CPI) and Producer Price Index (PPI), came in hotter than expected, dampening the hopes of those anticipating rate reductions. With less than two rate cuts now anticipated for 2024, the market’s reaction was evident. Federal Reserve officials have echoed a consistent message, suggesting that interest rates may remain elevated for an extended period.
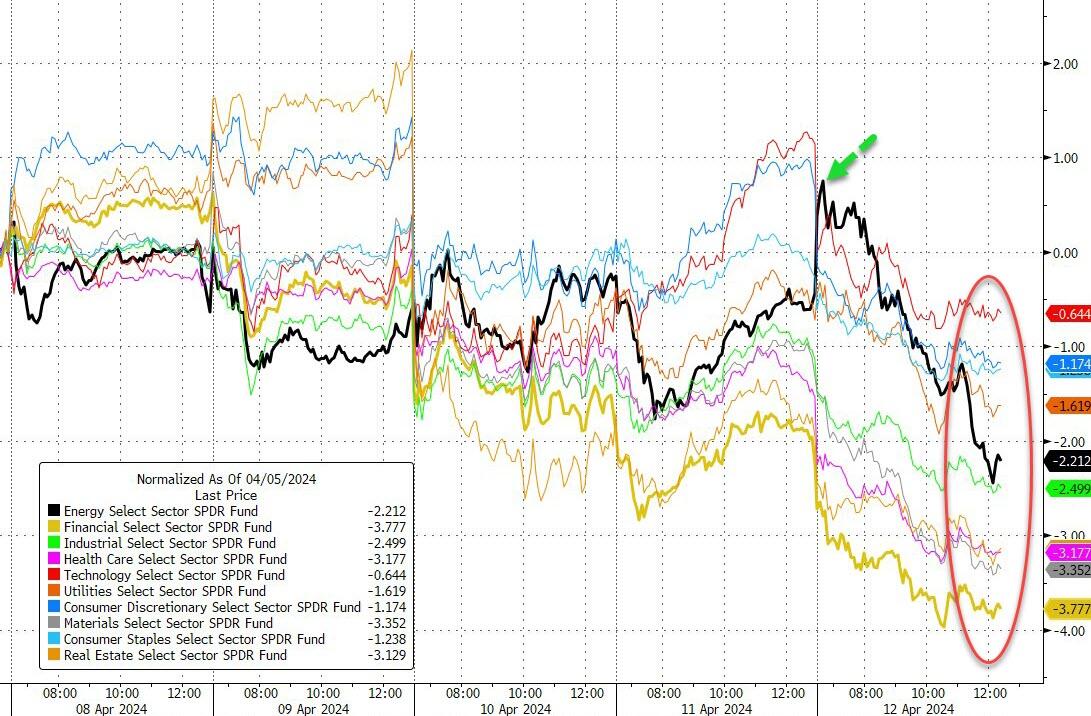
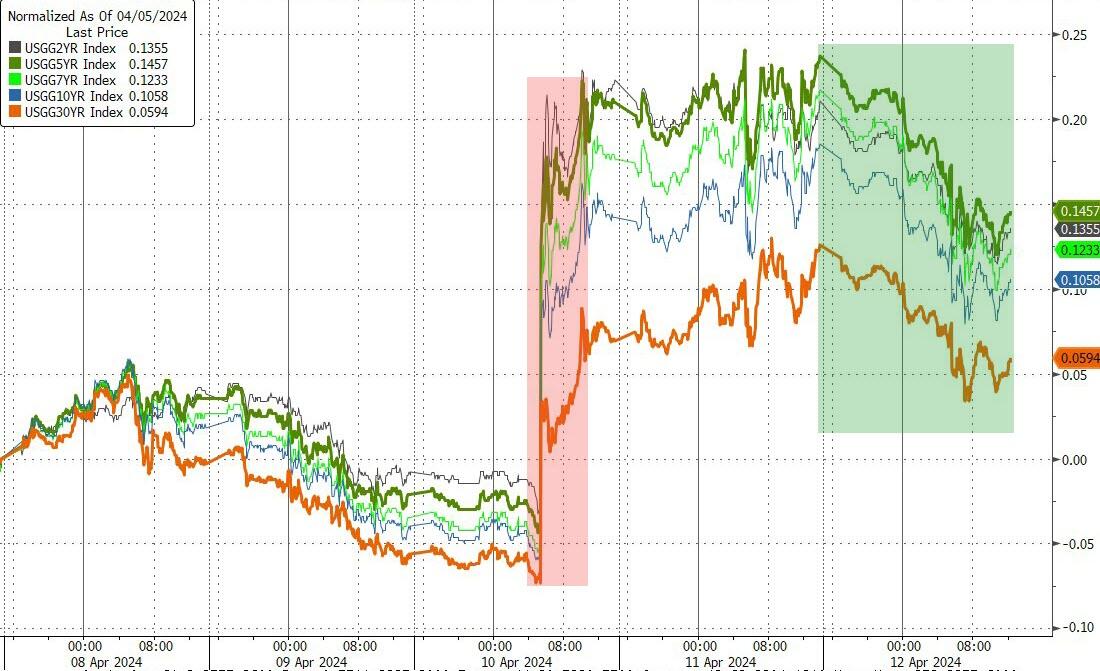
As the week concluded, all major stock indexes and sectors closed in the red, with Small Caps leading the downturn. Bond yields provided some refuge, rising over the week but dipping on the final day.
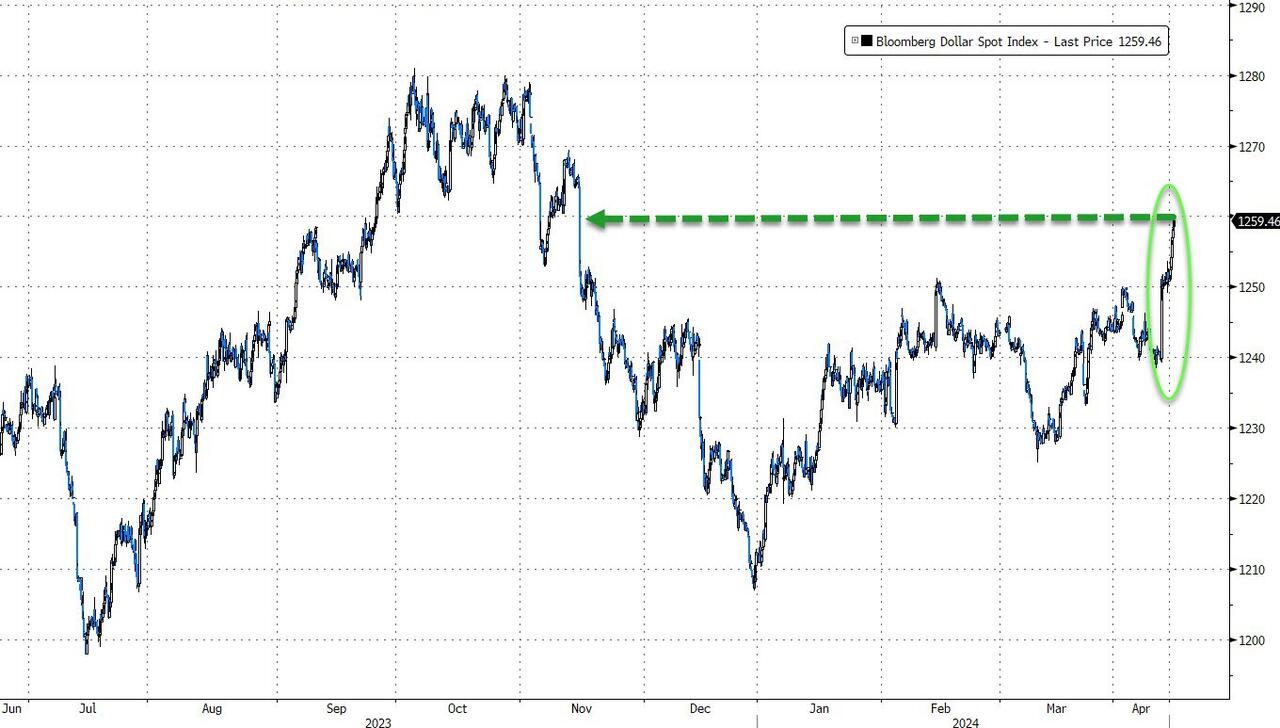
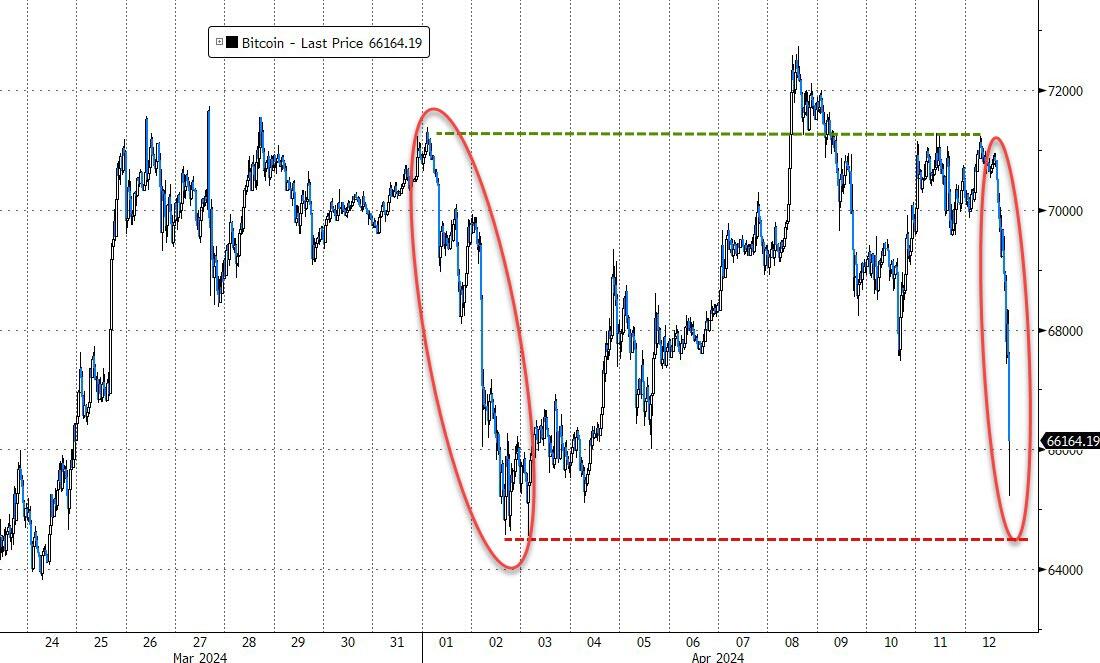
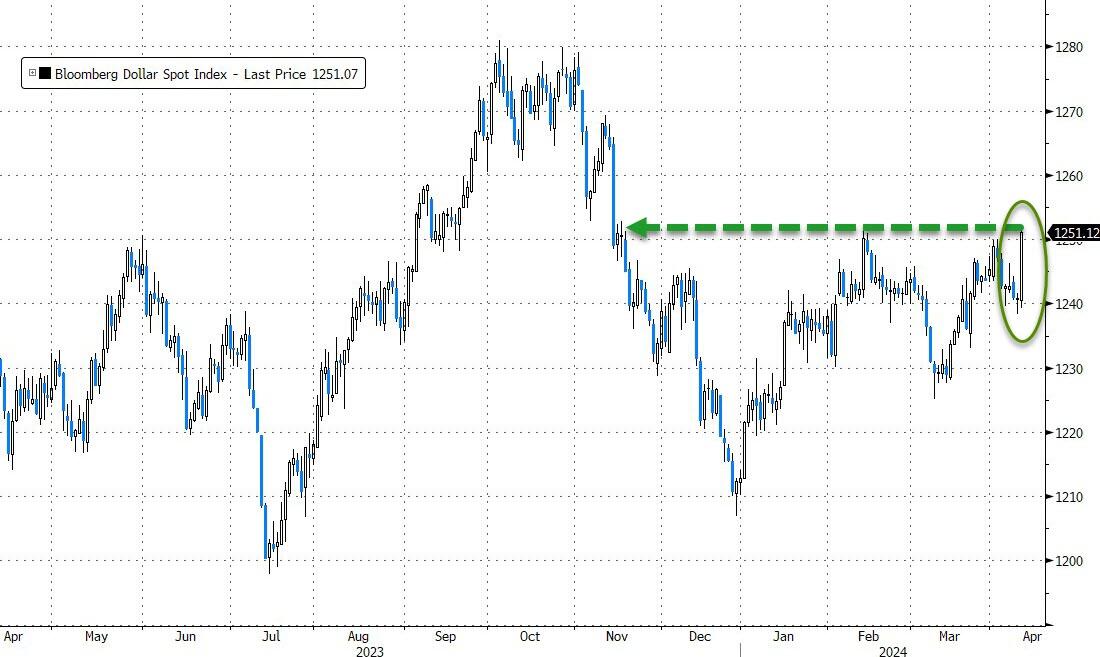
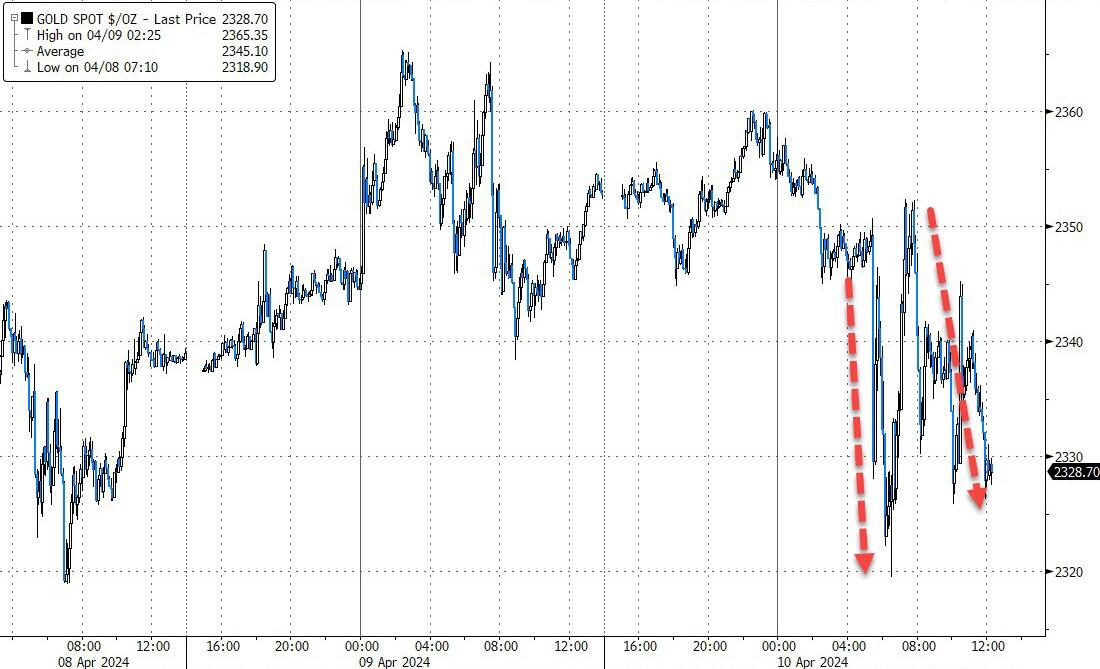
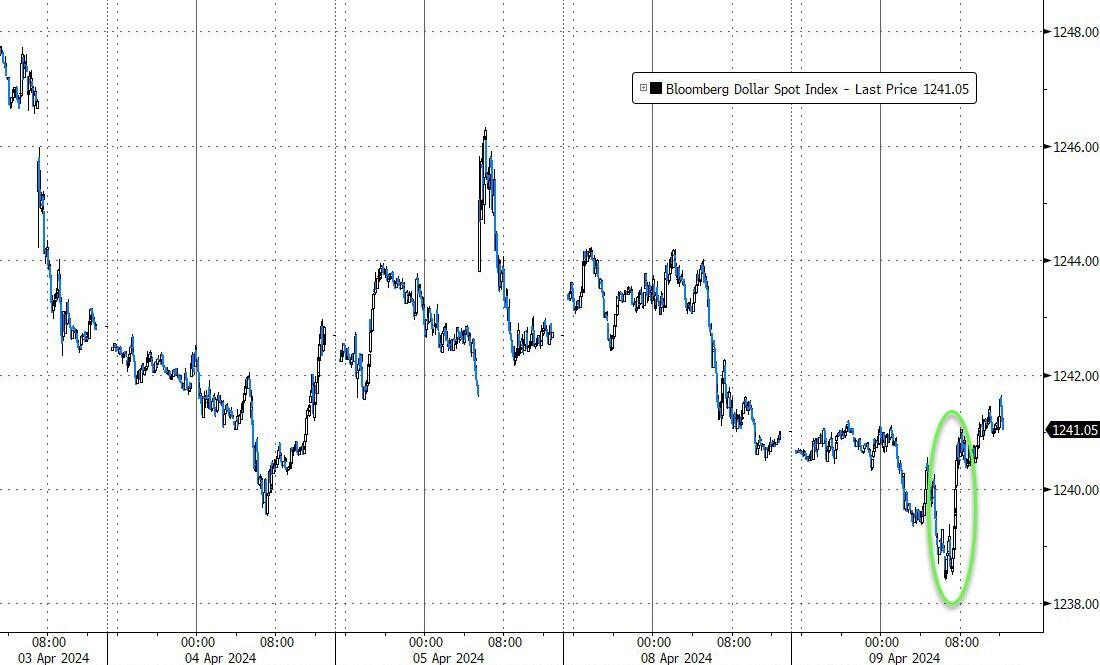
The U.S. dollar saw its largest increase since September 2022, while Bitcoin retracted its weekly gains. Gold, despite a strong start, ended the day lower after an initial 3% surge.
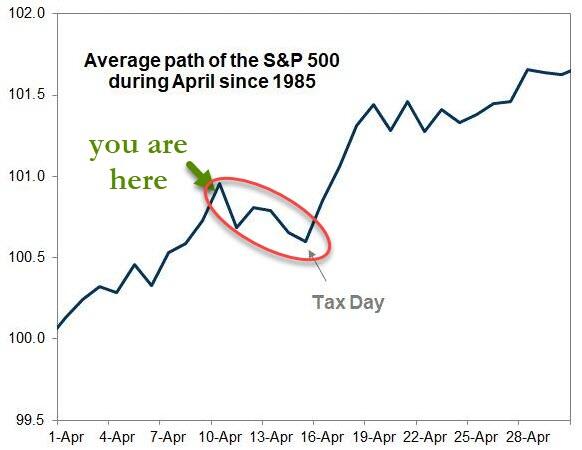
With the volatility potentially linked to the upcoming Tax Day on April 15, investors are left wondering:
Will the market’s performance post-Tax Day follow historical patterns?
Out of the 1,800+ ETFs out there, I only pick the ones that trade over $5 million per day (HV ETFs), so you don’t get stuck with a lemon that nobody wants to buy or sell.
Trend Tracking Indexes (TTIs)
These are the main indicators that tell you when to buy or sell Domestic and International ETFs (section 1 and 2). They do that by comparing their position to their long-term M/A (Moving Average). If they cross above, and stay there, it’s a green light to buy. If they fall below, and keep going, it’s a red light to sell. And to make sure you don’t lose your shirt if things go south, I also use a 12% trailing stop loss on all positions in these categories.
All other investment areas don’t have a TTI and should be traded based on the position of each ETF relative to its own trend line (%M/A). That’s why I call them “Selective Buy.” In other words, if an ETF goes above its own trend line, you can buy it. But don’t forget to use a trailing sell stop of 12%, or less if you’re feeling nervous.
If some of these words sound like Greek to you, please check out the Glossary of Terms and new subscriber information in section 9.
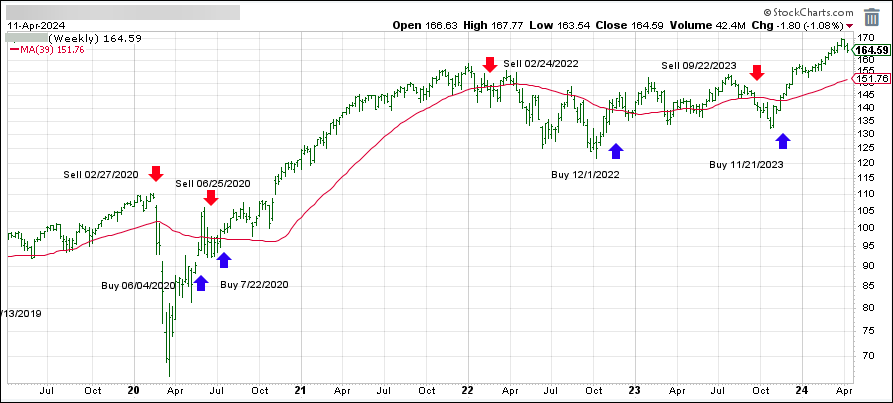
DOMESTIC EQUITY ETFs: BUY— since 11/21/2023
Click on chart to enlarge
This is our main compass, the Domestic Trend Tracking Index (TTI-green line in the above chart). It has broken above its long-term trend line (red) by +8.72% and is in “Buy” mode as posted.
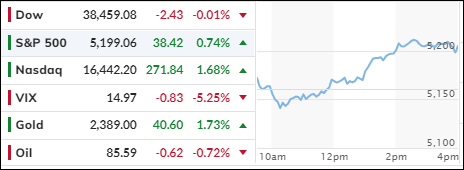
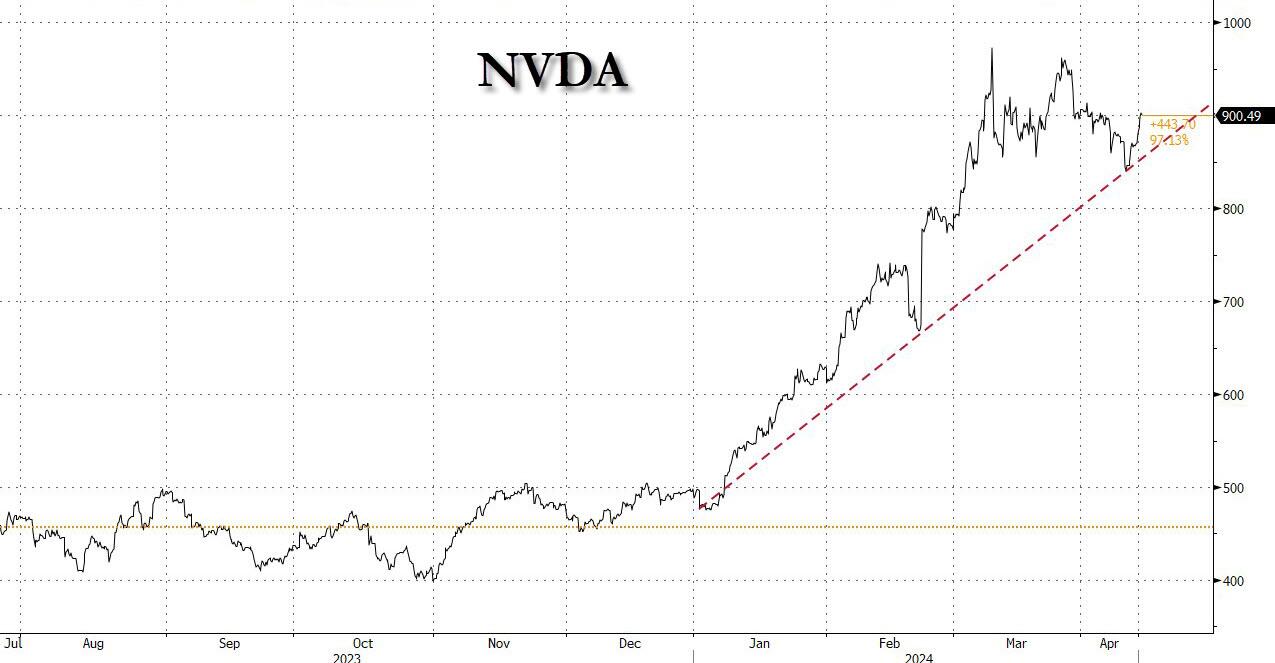
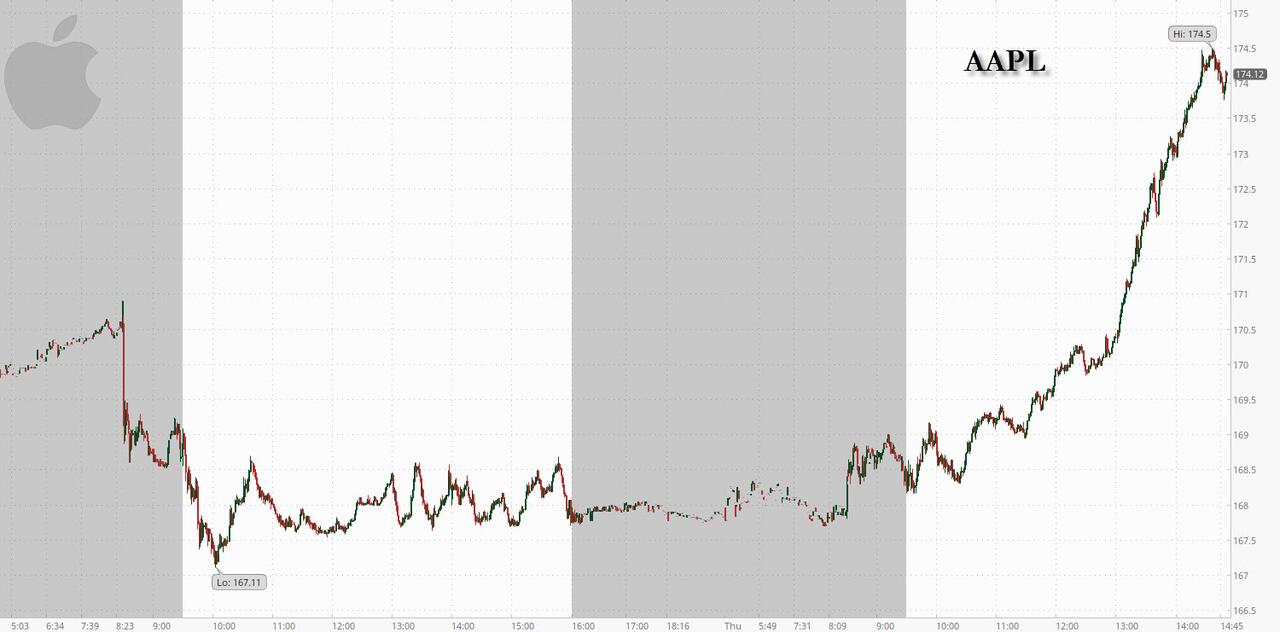
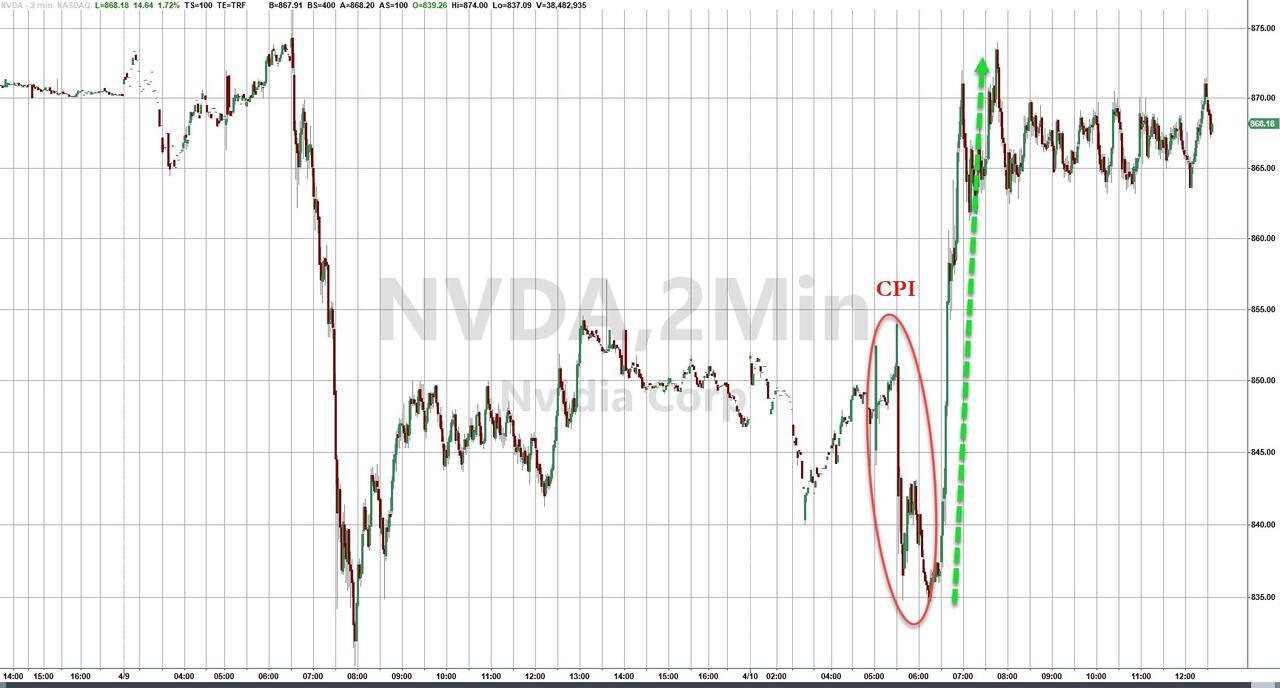
Today’s stock market witnessed a remarkable turnaround, with technology stocks leading the charge. The earlier concerns about ongoing inflation were overshadowed as tech giants like Nvidia soared nearly 4%, while other prominent players such as Amazon and Alphabet each advanced over 2%. Amazon’s shares reached unprecedented heights, and Apple enjoyed its most significant gain of the year with a 3% increase.
The Producer Price Index (PPI) for March reported a modest rise of 0.2%, falling short of the 0.3% predicted by economists, which eased some of the tension following Wednesday’s sell-off triggered by an unexpected surge in consumer goods and service prices. The Core CPI, excluding food and energy, also rose by 0.2%, aligning with expectations.
Despite this, New York Fed President John Williams’ remarks today suggested no immediate policy shifts, a stance that may dishearten traders looking for more aggressive action.
In the wake of a higher-than-anticipated Consumer Price Index (CPI) for March revealed on Wednesday and Federal Reserve meeting minutes indicating ongoing concerns about reaching the central bank’s 2% inflation target, it appears traders are adjusting their outlook. The realization is setting in that taming inflation may be a more formidable challenge than previously thought.
The buying frenzy wasn’t limited to the ‘Magnificent Seven’; gold, the recent favorite among investors, also experienced a surge, hitting a new all-time high of over $2,370.
As we close another tumultuous trading session, the financial community turns its attention to the upcoming earnings season. With major banks poised to disclose their first-quarter results tomorrow, one can’t help but wonder:
Will the big banks’ earnings reflect the resilience seen in today’s market comeback?
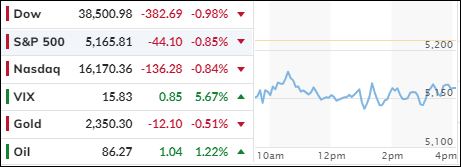
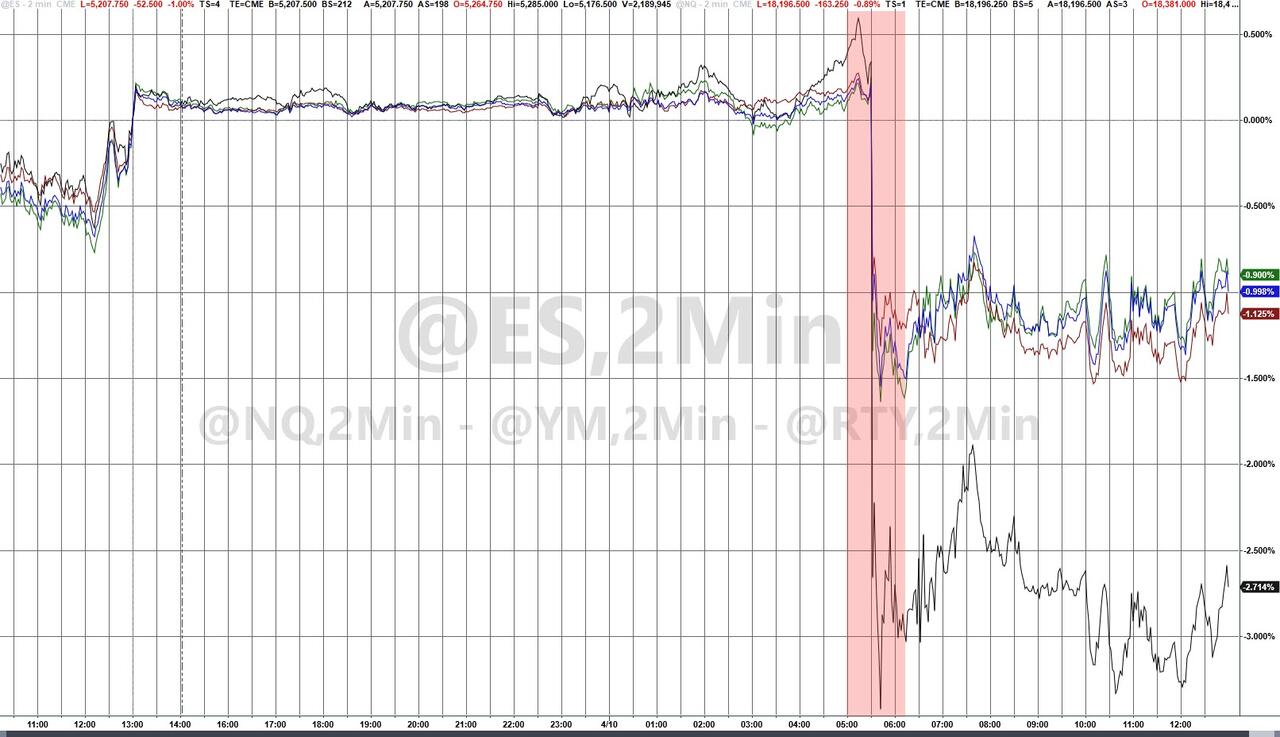
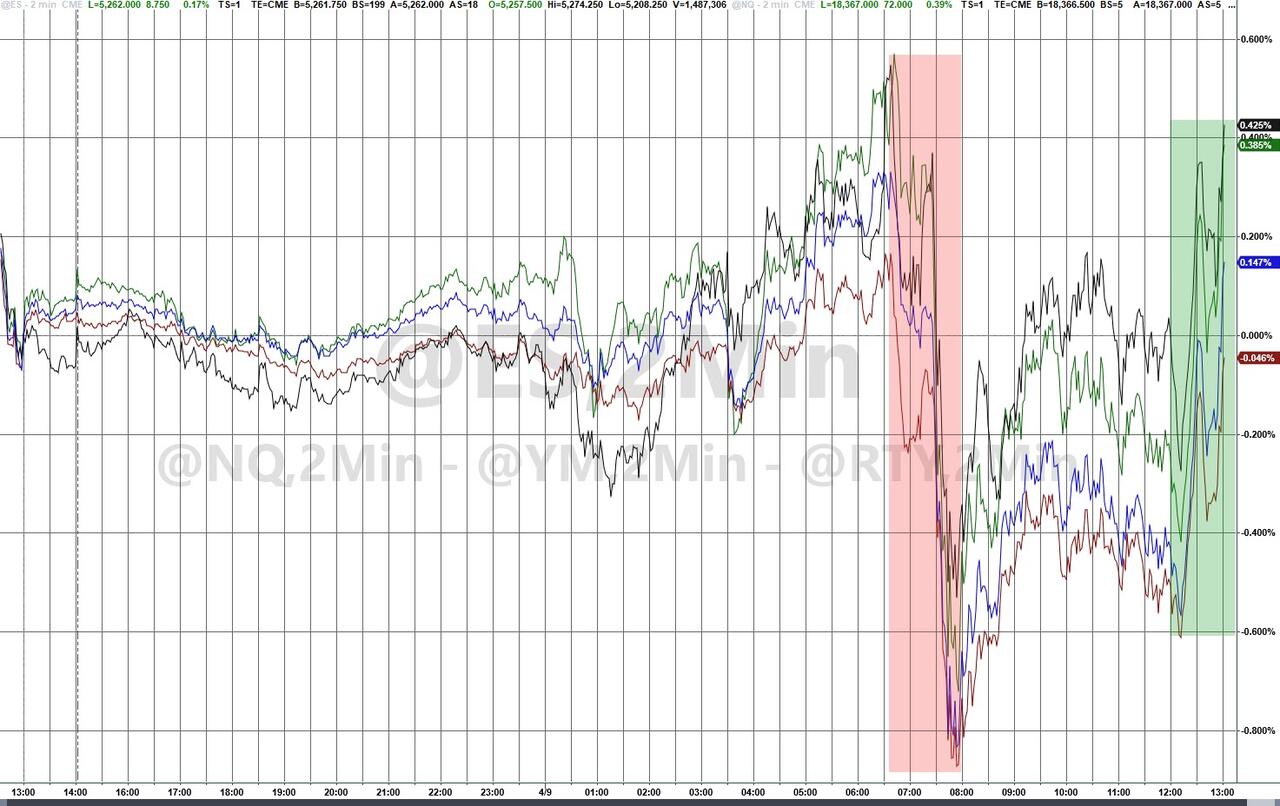
Today’s market revealed a downturn in the major indexes following the release of March’s inflation data, which exceeded expectations and may delay anticipated interest rate cuts by the Federal Reserve.
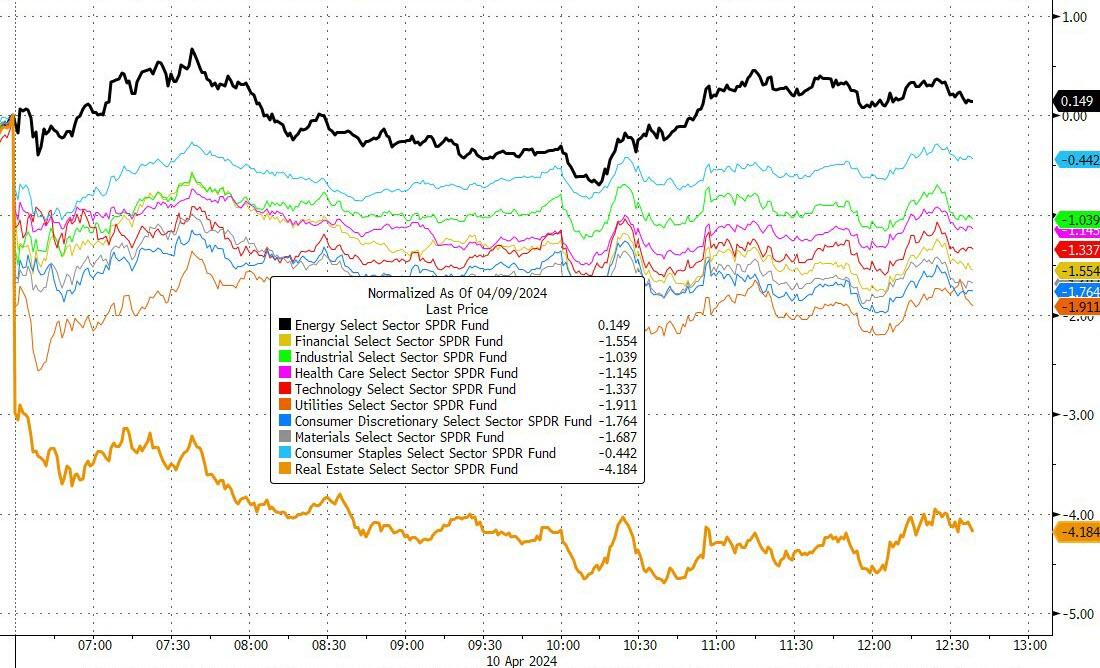
Energy was the only sector not to decline, with real estate experiencing over a 4% drop, the most significant loss of the day. After a strong start to the year, the S&P 500’s performance was flat in April, awaiting this inflation report.
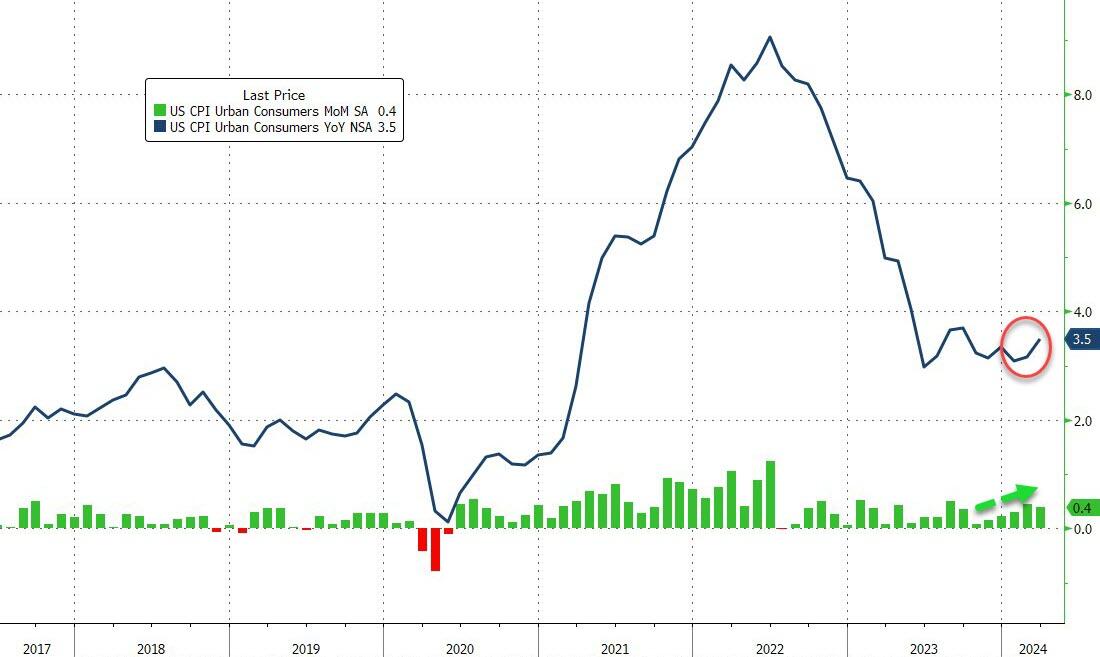
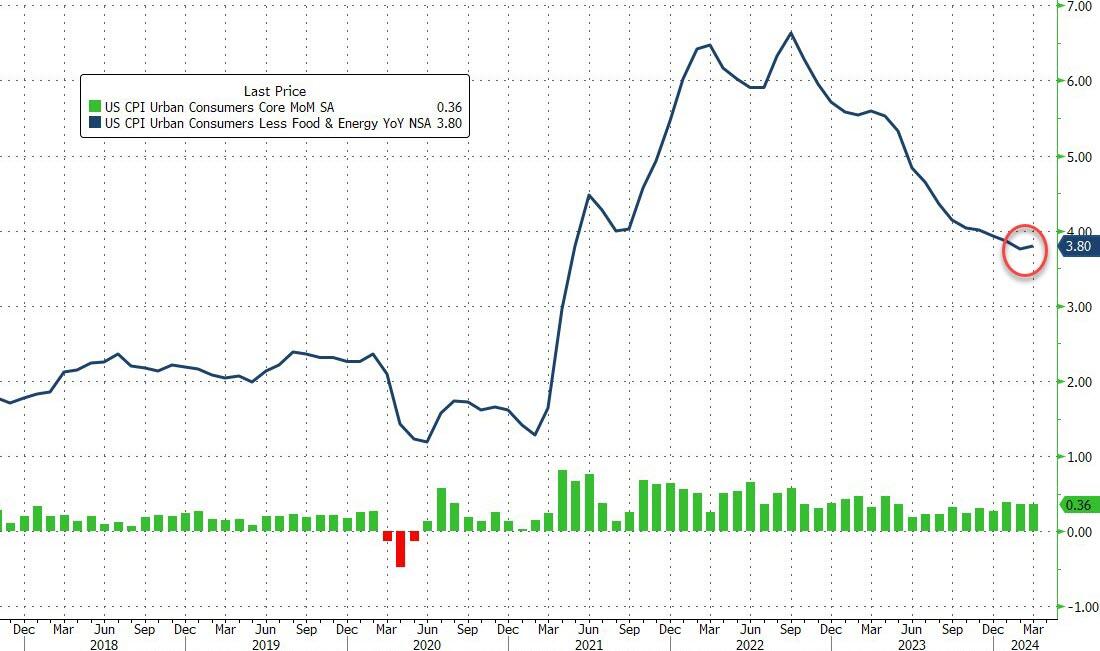
The Consumer Price Index (CPI) for March showed a 0.4% monthly increase and a 3.5% rise from the previous year, surpassing the predicted 0.3% and 3.4% increases. The core CPI, excluding food and energy, grew by 0.4% monthly and 3.8% annually, also above the 0.3% and 3.7% forecasts. In April, the CPI’s annual increase rate was 3.2% for all items.
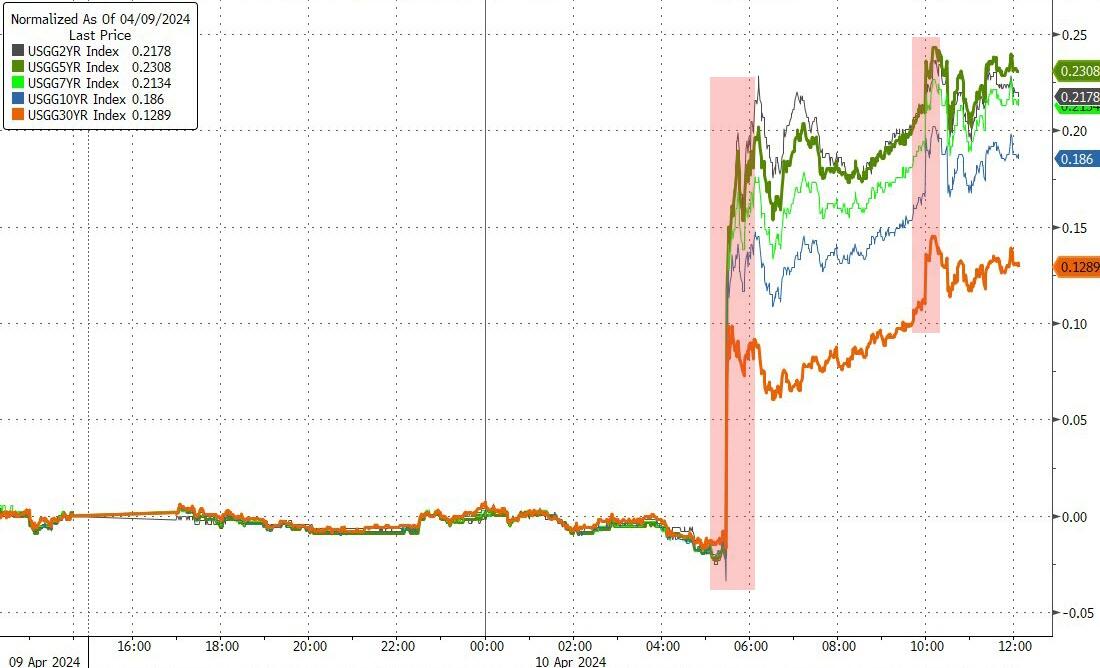
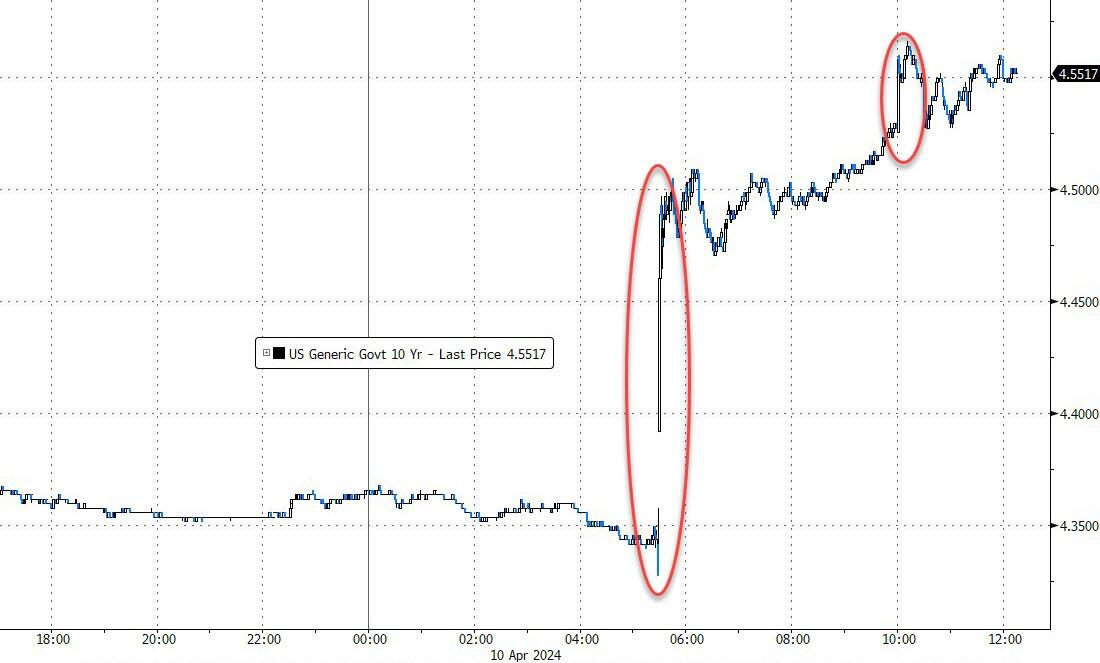
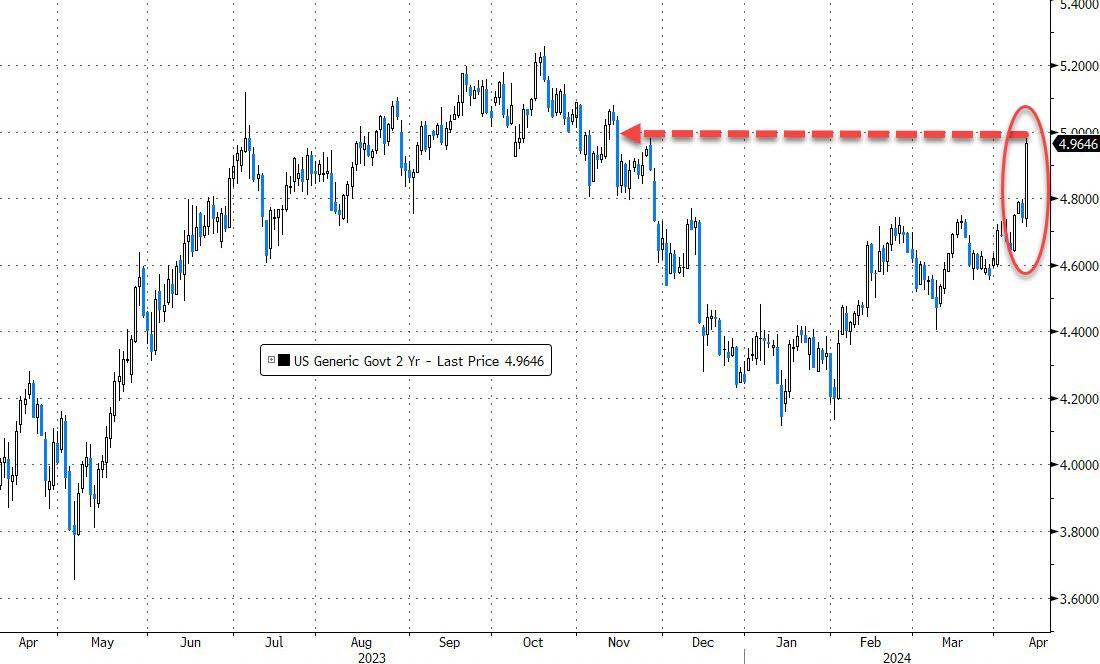
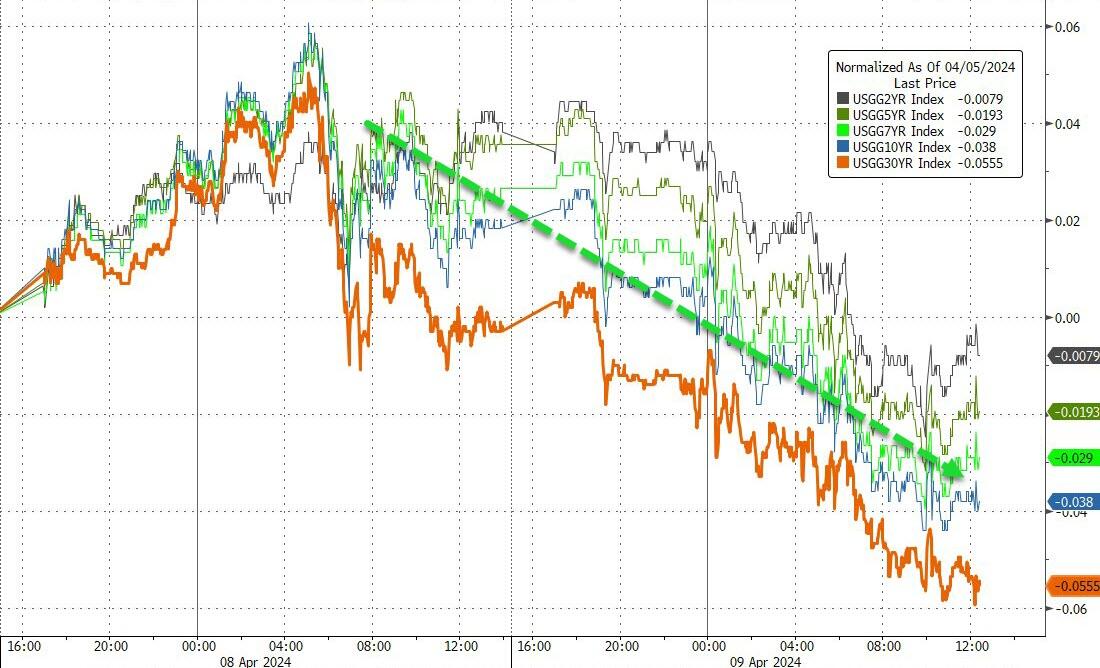
Bond yields rose sharply, with the 10-year Treasury yield climbing above 4.55%, indicating a reacceleration of the March CPI from the previous month and challenging the Federal Reserve’s goal for a 2% inflation rate. The 2-year Treasury yield reached nearly 5%.
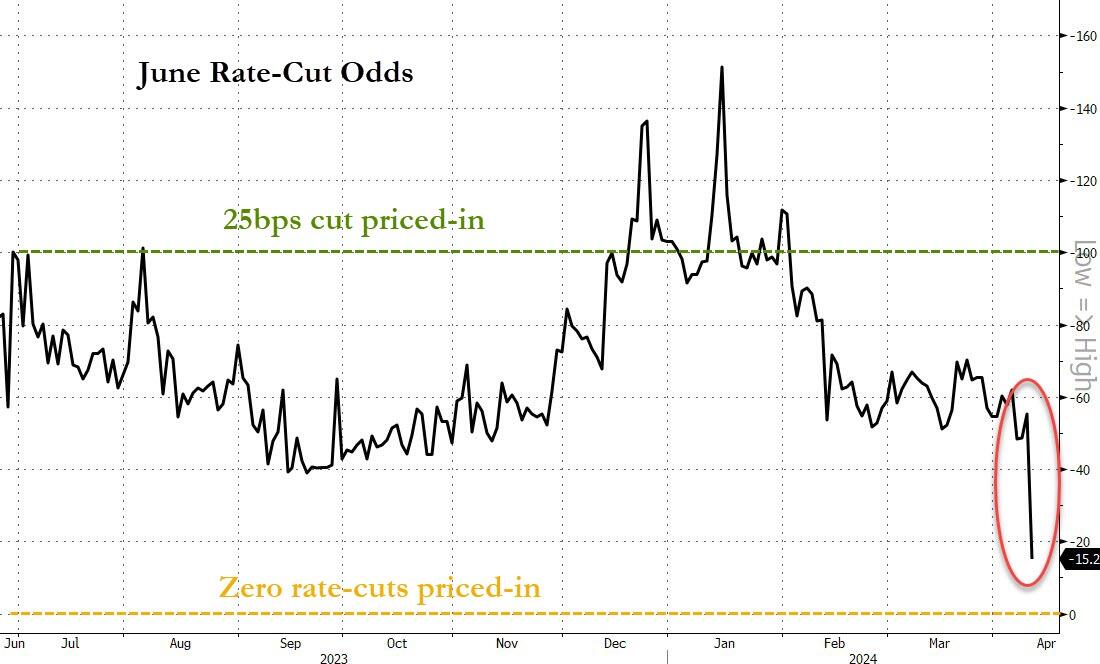
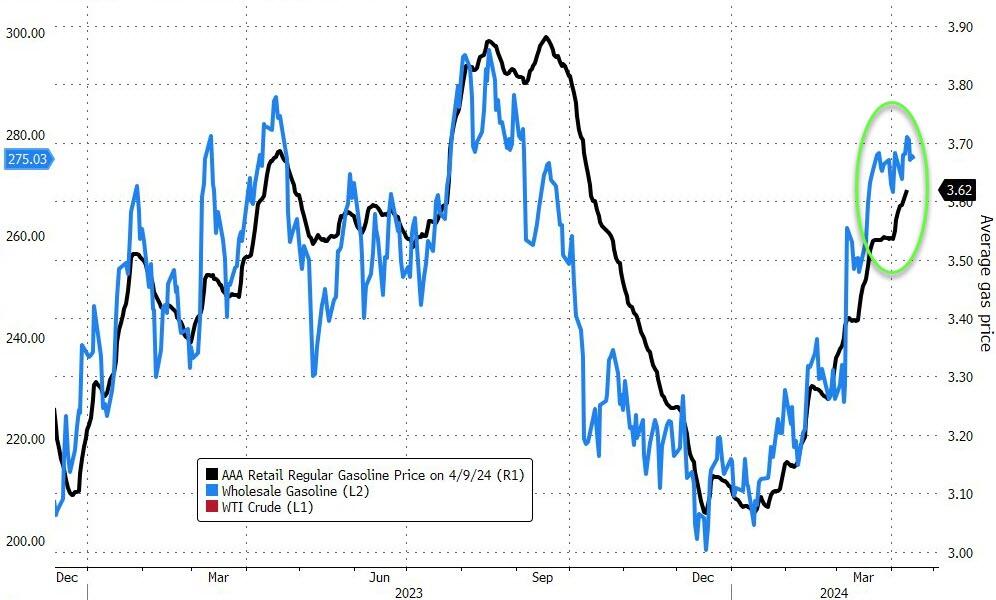
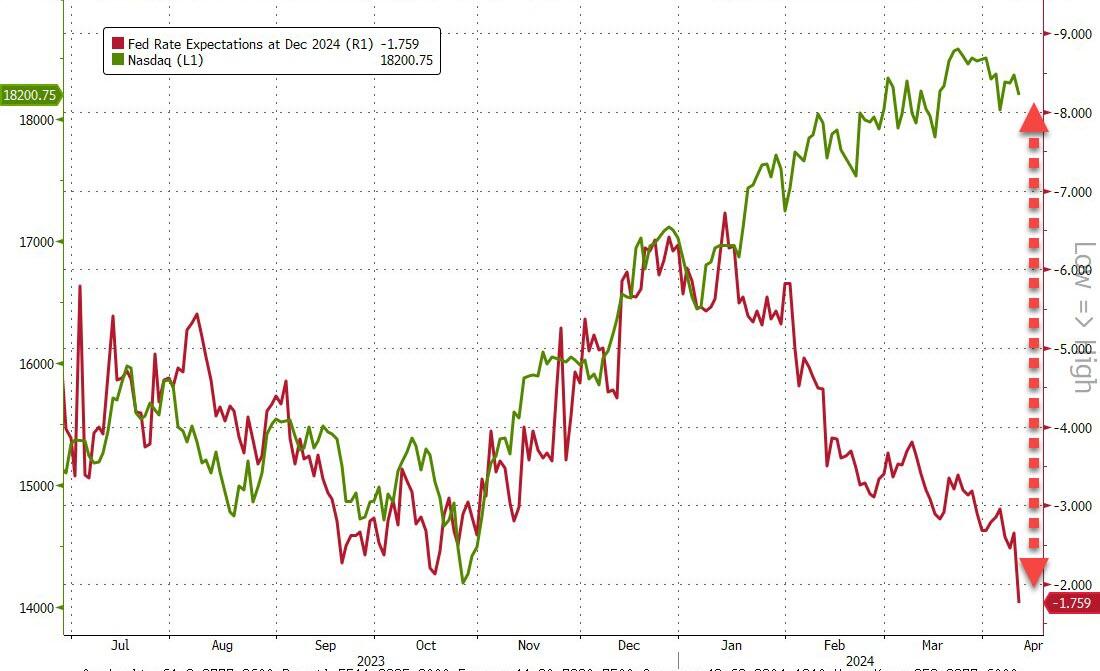
The current CPI report confirms a shift from disinflation to persistent inflation, a perspective I’ve long maintained. The probability of the Federal Reserve easing rates this year has diminished, with only a 20% chance of a rate cut in June. The most evident sign of ongoing inflation for many is at the gas pump.
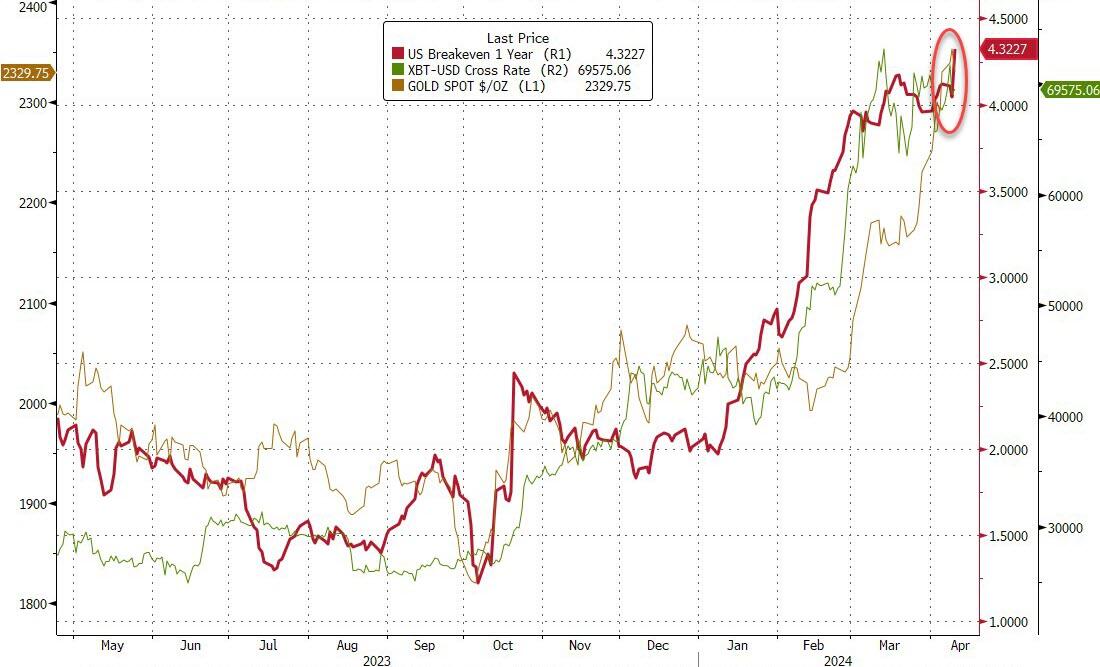
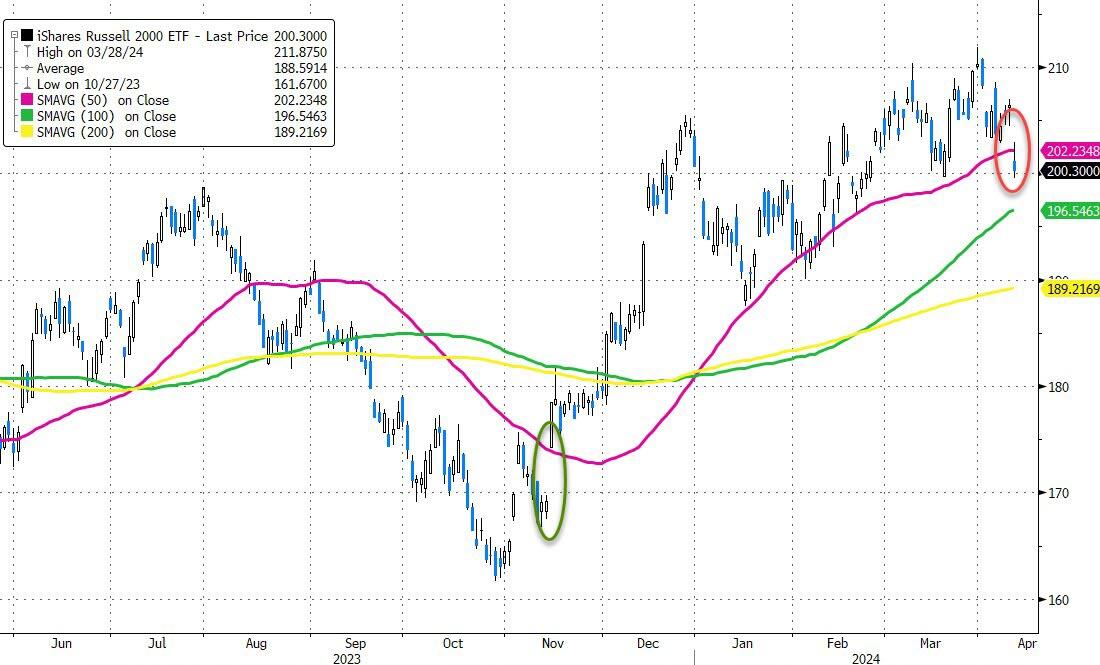
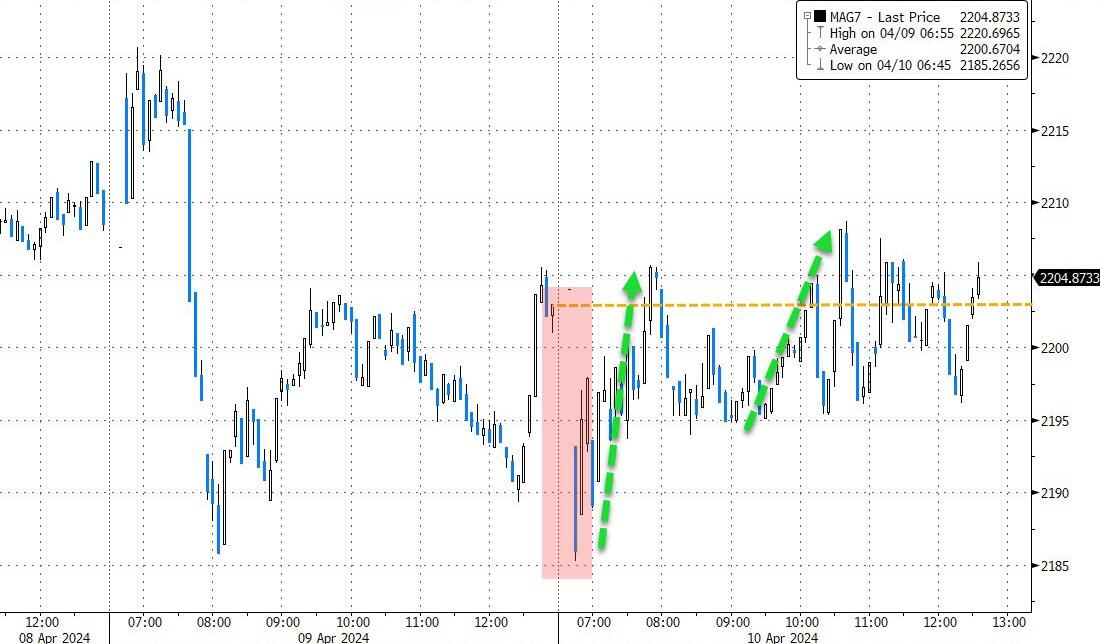
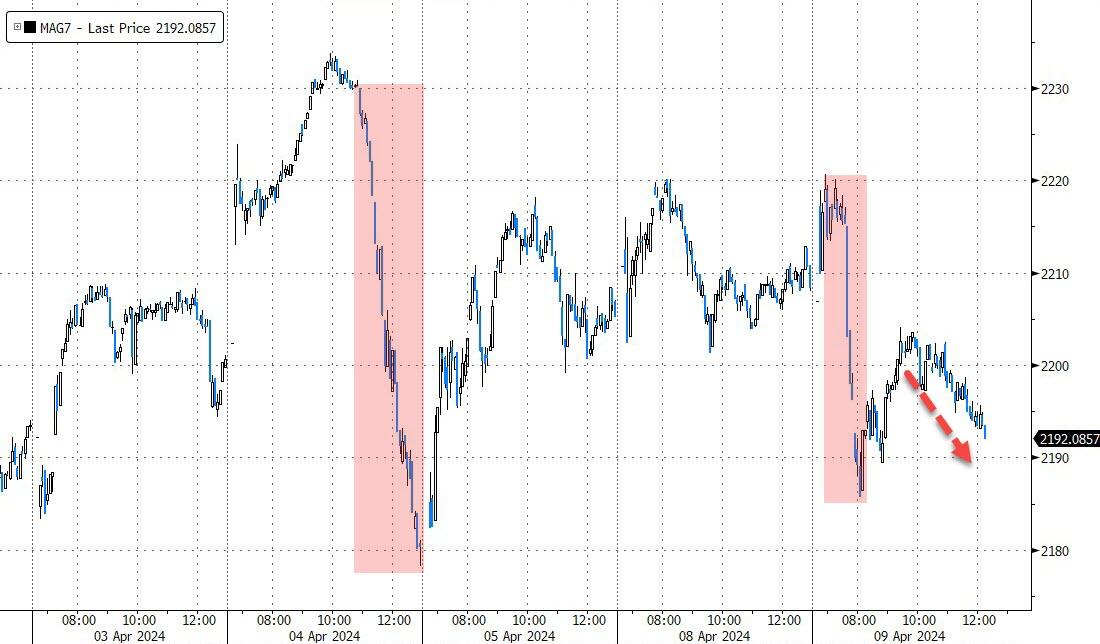
Inflation expectations have hit a new peak, the highest since June 2022. Small Caps suffered the most, falling below their 50-day moving average for the first time since November, while the MAG7 stocks remained stable despite initial losses.
Nvidia and Bitcoin emerged as alternative safety trades for this session. The dollar’s value increased, gold retreated from its continuous upward trend, and oil prices rose due to heightened geopolitical tensions, adding to the strain of higher gas prices.
As the market grapples with these challenges, one wonders how long it can endure the pressure of rising bond yields.
In a volatile trading session, the major stock indexes initially declined but ultimately recovered, as investors sought to regain optimism before the release of pivotal U.S. inflation data.
The early downturn lacked a clear trigger, suggesting that apprehension over the forthcoming Consumer Price Index (CPI) report dominated sentiment. However, strategic dip buying at lower prices helped the markets rebound by the close.
Chipmaker Nvidia saw its shares fall by 2.4%, while other prominent technology companies like Meta and Netflix also experienced declines of 0.6% and 1.6%, respectively.
The March CPI report, a critical indicator of inflation, is scheduled for release on Wednesday at 8:30 a.m. ET. Analysts anticipate a 0.3% rise in inflation for March compared to the previous month.
Investors are closely monitoring this data for hints about the Federal Reserve’s timeline for interest rate reductions. Currently, opinions are split on whether the Fed will lower rates in June.
The markets have been stagnant recently, reflecting concerns about the Fed’s resolve to decrease interest rates. An unexpectedly high CPI figure could trigger a market correction.
Market analysts believe that any significant deviation from expectations could cause market volatility. This is attributed to the current high valuations, which leave little room for error in economic data or geopolitical developments without causing rapid market selloffs.
Federal Reserve spokesperson Bostic’s mixed messages in the final minutes of trading did not cause a major stir, but they were interpreted positively by algorithmic trading systems, which helped lift the indexes from their lows. Despite this, the MAG7 stocks’ attempted rally ultimately failed.
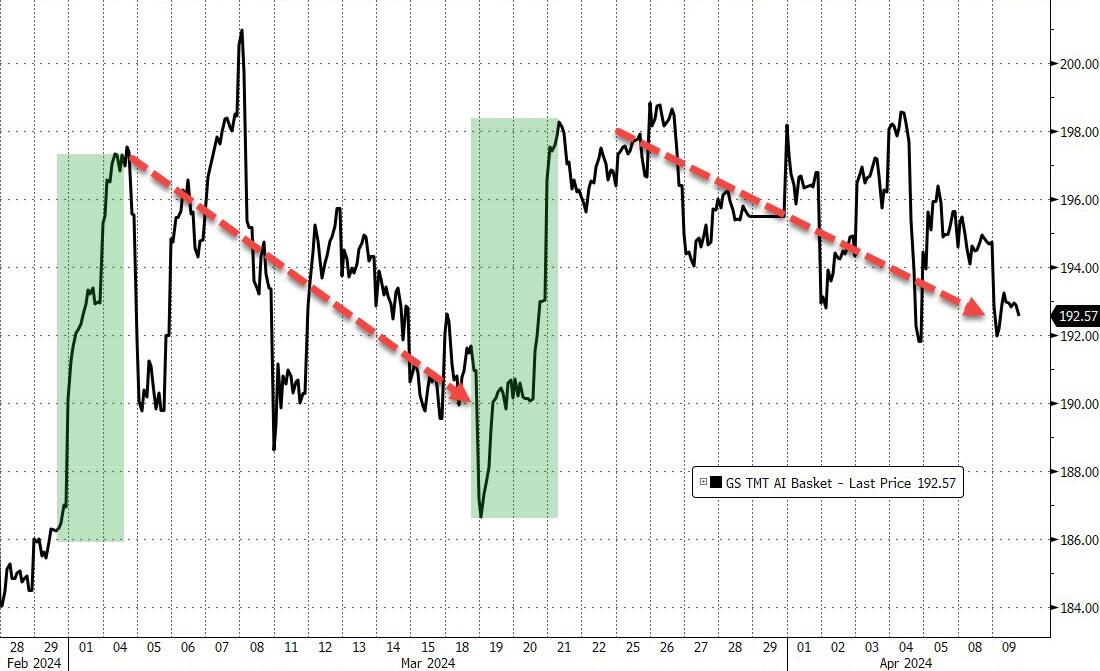
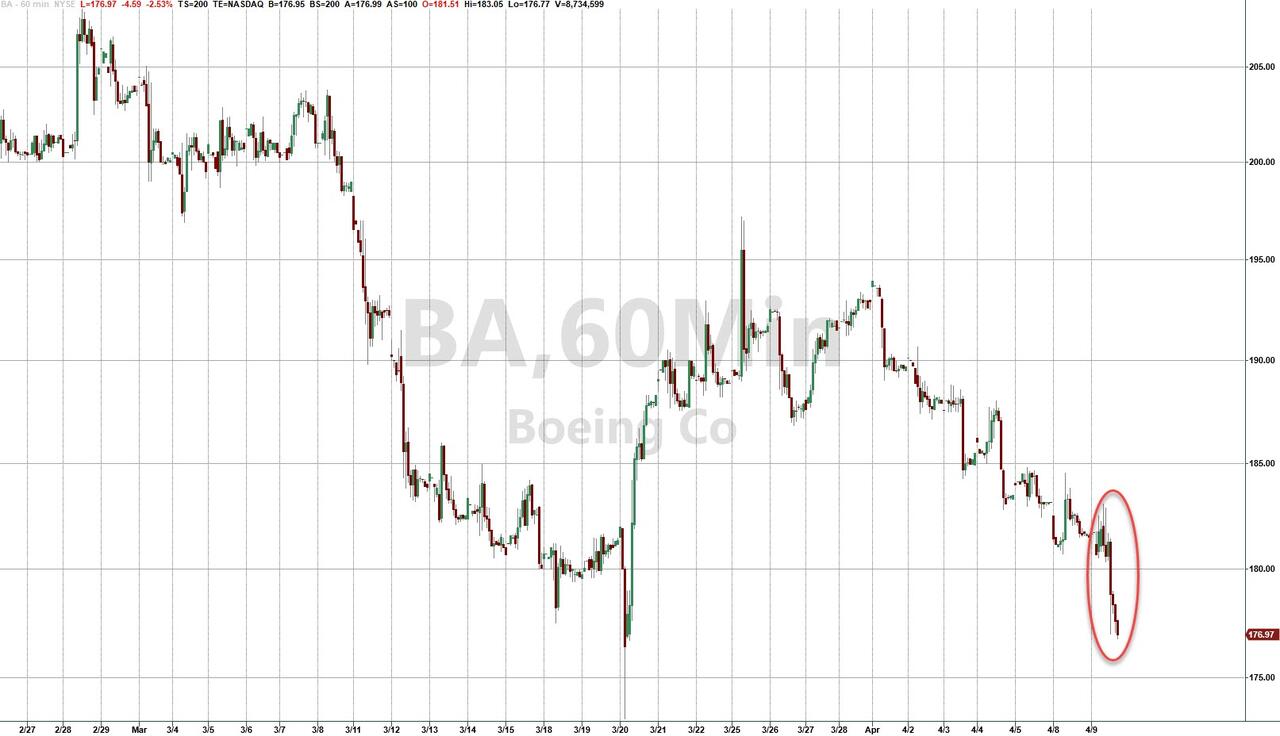
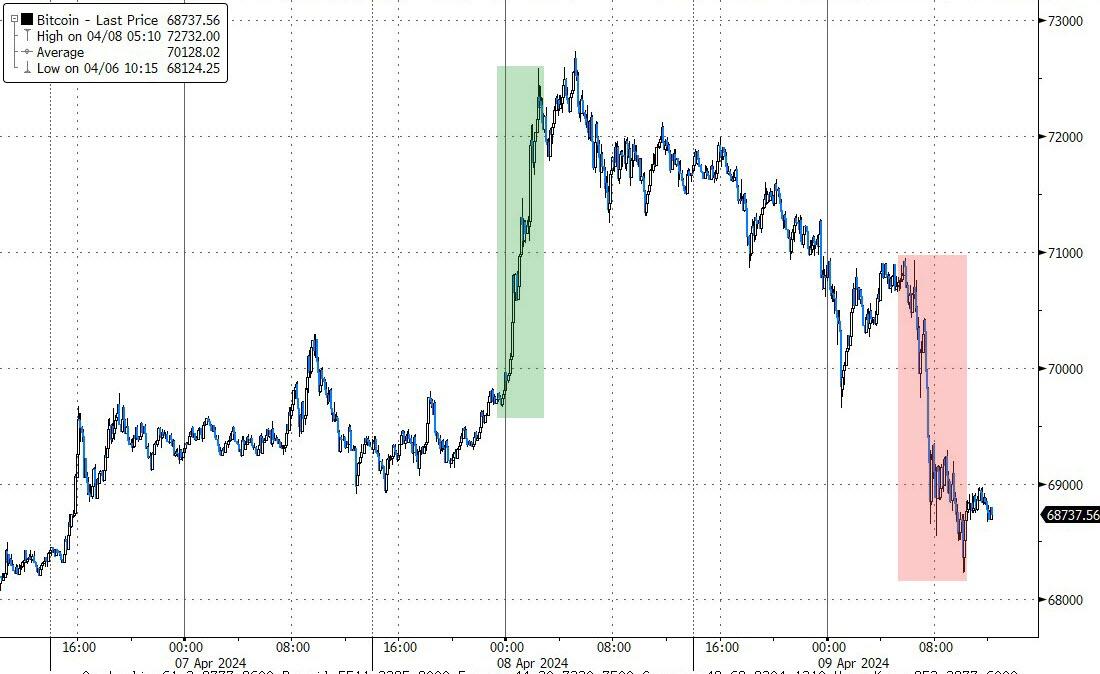
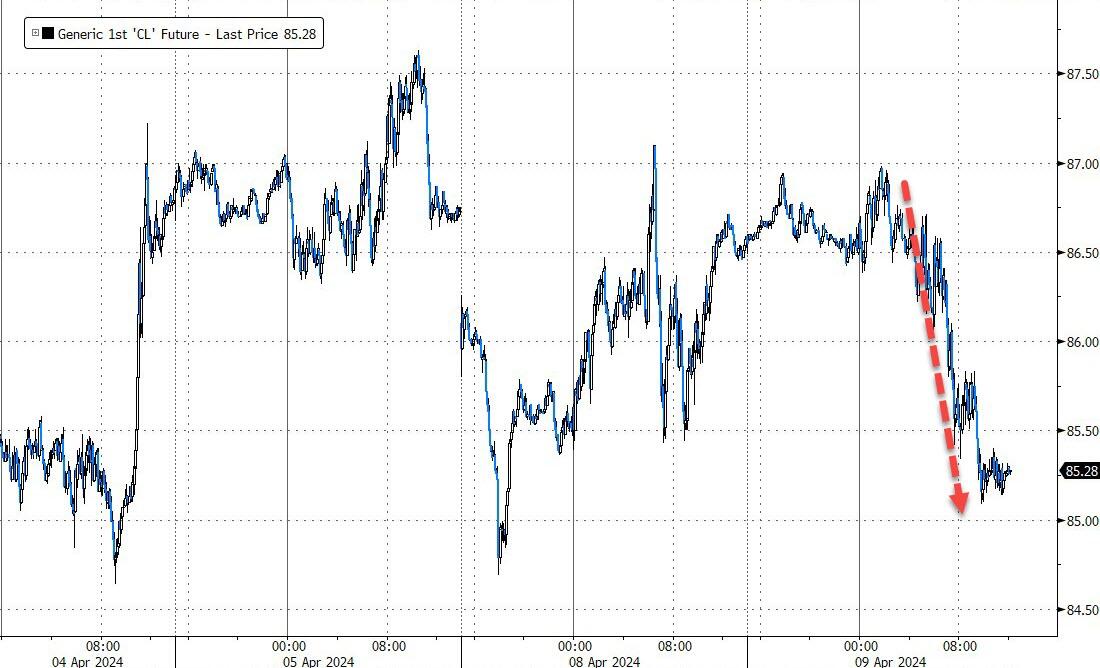
Broadly, the favored AI stocks have made no significant progress in the past six weeks. Meanwhile, Boeing’s decline continued, Bitcoin relinquished its recent gains, and crude oil struggled to maintain its position above the $85 mark.
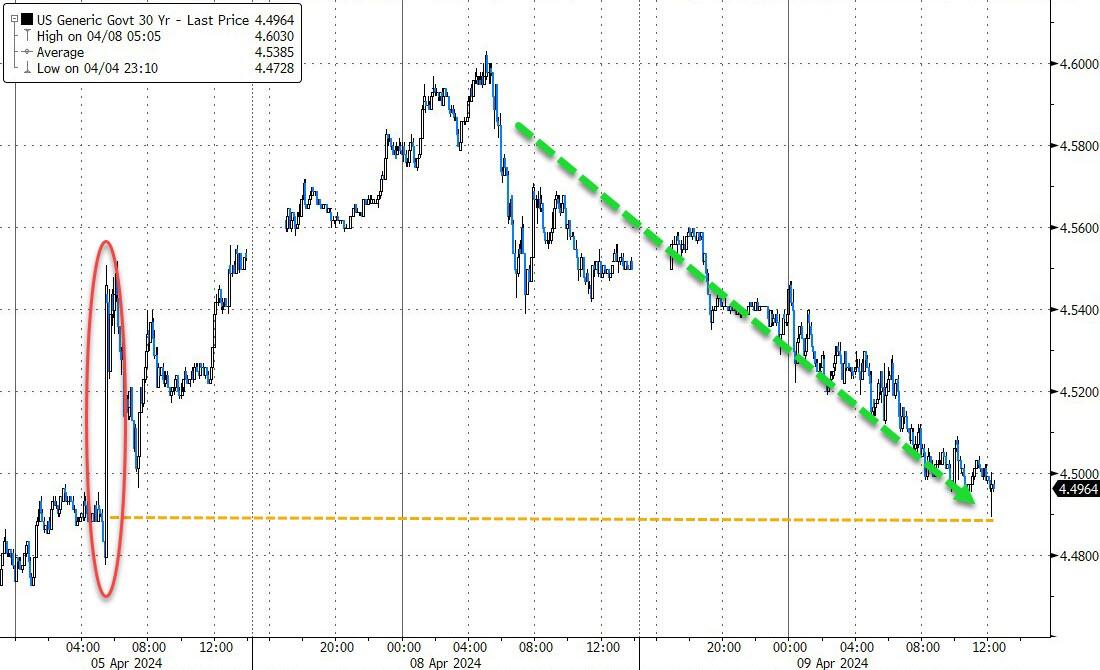
Bond yields fell, with the 30-year bond reversing its post-payroll increase. The U.S. dollar fluctuated but ended slightly higher. Amidst this uncertainty, expectations for a rate cut grew, and gold reached a new all-time high.
Will the upcoming CPI report clarify or compound the current market uncertainties?

