10 Investment Rules

Ulli Uncategorized Contact

MarketWatch featured an interesting article titled “Learn a lesson—before you get one.” It contained 10 investment rules to live by which, given the fickle and directionless nature of today’s market, may help you keep things in proper perspective by focusing on the big picture.

While most rules have some merit, I want to focus on only one (number 6), which seems to give investors the most trouble:

6. Fear and greed are stronger than long-term resolve

Investors can be their own worst enemy, particularly when emotions take hold.

Stock market gains “make us exuberant; they enhance well-being and promote optimism,” says Meir Statman, a finance professor at Santa Clara University in California who studies investor behavior. “Losses bring sadness, disgust, fear, regret. Fear increases the sense of risk and some react by shunning stocks.”

After grim trading days like Friday’s nearly 400-point tumble, coming after months of downward pressure on stocks, it’s easy to think you’re the patsy at this card table. To counter those insecure feelings, practice self-control and keep long-range portfolio goals in perspective. That will help you to be proactive instead of reactive.

“It’s critical for investors to understand how they’re cut,” says the Prudent Speculator’s Buckingham. “If you can’t handle a 15% or 20% downturn, you need to rethink how you invest.”

Please read the last paragraph again, which obviously refers to a buy and hold scenario. While every investment approach has its difficult periods, I have found that most clients struggle with the fact that portfolios will fluctuate. It’s a fact of life—live with it or don’t invest!

Some investment approaches, such as trend tracking, may keep you more above water during times of uncertainty, but draw downs of up to around 10% are within an acceptable range. Please note that I said acceptable, not likeable!

Buy and Hold scenarios will not only expose you to the above mentioned 15% to 20% downturns, but far worse. When the inevitable bear market strikes, and it will, pulling your portfolios down closer to the minus 50% area, you will suddenly realize that working with sell stops and suffering through a few whip-saws while seeing portfolio fluctuations in the 10% area is a far better choice.

No Load Fund/ETF Tracker updated through 6/19/2008

Ulli Uncategorized Contact

My latest No Load Fund/ETF Tracker has been posted at:

http://www.successful-investment.com/newsletter-archive.php

A break to the downside sent all major indexes further south generating a Sell Signal for all domestic equity funds.

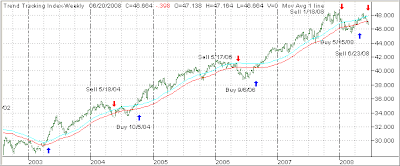
Our Trend Tracking Index (TTI) for domestic funds/ETFs broke decisively below its trend line (red) by -0.93% thereby ending this short buy cycle of 30 days:


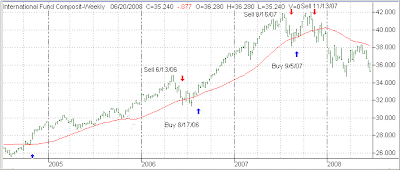
The international index dropped as well and now remains -7.63% below its own trend line, keeping us on the sidelines.


For more details, and the latest market commentary, as well as the updated No load Fund/ETF StatSheet, please see the above link.

Back Below The Domestic Trend Line

Ulli Uncategorized Contact

The domestic Trend Tracking Index (TTI) has been holding up better than the major indexes over the past few days, but Wednesday we headed again slightly below the long-term trend line.

As of yesterday, the TTI had dropped -0.16% below the line, but I will wait a few more trading days for further downside confirmation before issuing a domestic Sell signal. The culprits for this downward action were the financials along with evidence that ever rising oil prices are disrupting the economy.

Be that as it may, being stuck in the neutral zone requires us to wait until a price breakout to either side occurs before we can take further action. Many sectors and country funds have been zigzagging, which means many trends have come to an end or at least volatility has increased to such a point that staying away from these arenas appears to be the soundest course of action, at least for the time being.

My hedge against our long mutual fund positions is working well as the gains on one side more than offset the losses on the other.

The Importance Of Trading Volume

Ulli Uncategorized Contact

So you identified an up trend in a sector/country ETF and reviewed the momentum figures in the StatSheet to select a suitable candidate for your investment portfolio. What else do you need to do before placing your order?

You need to check the average volume figures especially if you are investing larger sums of money. In my advisor practice, this is an important step and reader Bruce had this to say:

First, I found you website a couple of months ago and have been following it closely ever since.I find it an absolutely superb resource!

Quite frankly, I would use it as a stand-alone resource if not for one thing…you do not include volume, which I consider a vital component.

For instance, DBO may be marginally better than USO, but DBO only trades 72,900 ATV as opposed to USO which trades 10,603,700 ATV.

Liquidity is a paramount consideration, especially when you get stopped out or the slippage will kill you.

Would you consider adding average trading volume (ATV) to your spreadsheets?

Bruce pretty much follows the same steps as I do. If find two ETFs with very similar technical indicators, but with huge differences in volume, I will always select the one with the highest liquidity. While this may not be as important if your order is for only $10k, it can have an effect nonetheless.

I have found that low volume ETFs tend to have higher bid/ask spreads, which means that you don’t get the best fill when buying or selling along with additional slippage due to lack of liquidity. This is most prevalent on down days when everyone heads for the exit at the same time.

While the weekly StatSheet is already packed with all the information I can cram in, adding a volume column, while helpful, is just not possible. I personally simply review Yahoo’s financial site, which gives me quick access to the volume information in a few seconds.

Reader Bruce’s second question addresses another important area. Here’s what he said:

Second, what protocols do you use to get back into an ETF or fund once you have been stopped out?

For instance, last week I got stopped out of SLX. But steel is quite strong and has a viable thesis forinvestment. At 103.34, it is still 7.96% off its high of 112.28, and its “M-Index” has been cut in half from 18 to 9. Although the trend line has been broken, there is strong resistance at the 100-101 level. It looks like a buy at this level to me.

Thank you for your hard work and superior information.

While it certainly has merit, I personally don’t look at resistance points as this is too much of a subjective opinion. Besides, resistance points are made to be broken. While this approach may work in bull markets, I personally never had much faith in buying at resistance points or entering on dips. My preferred way has always been to buy on breakouts, which supports the basic law of physics that a body in motion tends to stay in motion.

SLX still sits above its long-term trend line (39-week SMA) by some +17%, which is quite high. My view is that if you were in that trade and got stopped out at a profit, be happy. This is a very volatile sector and a 10% sell stop may get triggered in a hurry even when used based on closing prices only.

However, if you are an aggressive investor, you could re-enter when SLX breaks out to new highs again, which would be an indication that the major trend has resumed. While that goes against conventional wisdom, trend tracking is all about buying on price breakouts and not about buying on pullbacks. It goes without saying that a disciplined exit strategy is a must.

How Many Positions Should You Have?

Ulli Uncategorized Contact

As a follow up to yesterday’s post “When Should You Take Your Profits?” reader Dave had this question:

You have covered well the decision-making that goes in profit-taking and what I call “loss-reduction”.

What I am uncertain about is the number of positions one should hold at one time? Does it differ if you have a mixture of ETFs and Mutual Funds from an all-ETF or all-Mutual Fund?

No, it does not. Usually, if a beginning investor has less than $20k in his portfolio, maybe 1-3 positions in domestic and widely diversified international funds, when the respective Buy signals are in effect, is all that is needed to diversify. I don’t recommend sector exposure for a small portfolio.

I usually designate 8 to 10% of portfolio value to any one area. Let’s say we have a buy from our domestic TTI (Trend Tracking Index). I would initially invest 1/3 of portfolio value (allocated to 3 or 4 mutual funds/ETFs).

If the international TTI subsequently signals a Buy, I would to the same thing there, which leaves me with 1/3 in money market. If some sector or country funds are showing strong upward momentum, I would again designate 8 or 10% to any one area.

If sectors and country funds do not offer any opportunities, or volatility is too high, I will then allocate more into my existing holdings, provided they have gained some 5% in value. In other words, I will stay with the long-term trend until it ends and my sell stops are triggered.

When Should You Take Profits?

Ulli Uncategorized Contact

Reader Steve is still unclear about an important part of Trend Tracking, namely when to take profits. He writes as follows:

Thanks again for your great blog and newsletter.

You have really helped me improve my trading (and the way I look at markets). I have appreciated you reviewing your entry and exit strategies. I do have one question. When do you take profits?

I have had a few ETFs go quite a bit higher, then fall back to trigger my stop over the course of a couple of weeks. Looking back, I could see they were quite extended above their short term moving averages. When a fund rockets off, should I take some profits along the way? Or should I wait until it falls in momentum or triggers my stop? Any wisdom you can provide would be much appreciated.

Again, thanks for you generosity in sharing your experience.

The general idea is let your trailing stop loss be your guide when to get out, either to limit losses or to lock in profits. Here is how I have described it in more detail in my Investment Policy Statement under the “Risk” section:

With Trend Tracking, we set up a clearly defined risk limit. Upon executing the purchase of an investment, we immediately establish a trailing sell stop point of 7%. In other words, as prices rise, the stop loss point rises as well. This essentially fulfills 2 functions:

1. It limits our losses in case the trade goes against us, and

2. It locks in our profits if prices continue to rise until the trend ends

As you can see, Trend Tracking, along with the disciplined use of trailing sell stops, greatly reduces the risk.

For example, if we allocate 10% of portfolio value to a certain ETF, and prices decline right away and trigger our sell stop, our risk is to lose about 7% of the 10% investment. That means the effect on the total portfolio is about -0.7%. (Be aware, however, that the final price maybe slightly better or worse than the 7% loss objective due to market conditions.)

This sensible approach allows us to keep these losses small; they are not only part of investing but necessary in order for us to be prepared and ready to participate in the next major up trend whenever it presents itself.

Sometimes it may take several buys and sells, also called whip-saw signals, before the major trend establishes itself. Investor patience is a requirement!

In other words, if the trend continues your way to the upside, you trail your sell stops along with the rising prices until the trend eventually reverses and triggers your exit points. Using this method, you eliminate any emotional decision making and let the market tell you when it’s time to get out.