In regards to Sunday’s post titled “Opposing Viewpoint,” reader Tad had the following comments:
In regards to your Sunday post, I think PTTDX, or better yet HABDX, would be excellent choices when you issue sell signals for equities, especially for those who will not be aggressive enough to short, when and if that becomes the trend.
This gives you the best of both worlds, equities when they are trending up, and the stability of bonds when the trend is questionable or is going down for equities.
Having said that, Bill Gross, “The Bond King”, and in my opinion, one very smart man, has stated to sell bonds in what is surly going to eventually be a rising rate environment at some point, and at that point the demise of bonds to a lesser or greater extent depending on the duration.
In a rising rate environment, where the money supply is expanding rapidly, equities would seem to be the place to be, following the trend, of course. And equities in places where sovereign debt is not an issue, state debt is not an issue, county debt is not an issue and last but not least private debt is not an issue.
In other words, one would think to avoid the USA, and Western Europe, and buy Asia and Emerging Markets. I particularly like small cap Emerging Markets and Asia, due to the decreased volatility.
Currently, I own the following: TCEMX, WAEMX, WAIOX, MSMLX, QUSOX, ODVCX, FAIRX, AVALX, HRVIX. Contemplating: HWACX, MXXVX, TESGX
All with 7% trailing loss stops of course!
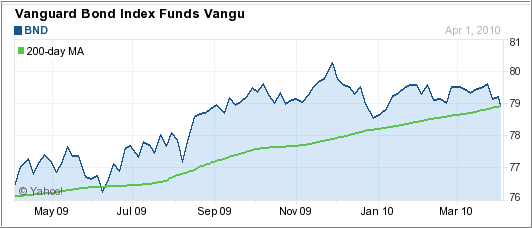
I want to hone in on Tad’s comment regarding the use of PTTDX/HABDX as a choice once a sell signal for equities has been issued. Both funds indeed held up pretty well during the 2008 massacre as you can see in this 2 year chart:
They dropped close to 10%, which is far better than many bond funds, although the total bond ETF BND showed even less volatility.
However, I want to warn against becoming complacent and expecting this same performance in the event the markets turn down again.
As I pointed out before, we may very well be at the tail end of low interest rates, which could potentially result in bond prices taking a beating as well. Recently bond guru Bill Gross of PIMCO announced their own lineup of equity ETFs, which could be interpreted as them seeing more potential in equities than in bonds. Or, they could be simply interested in gathering more assets from a different source.
Be that as it may, to guard against any other surprises, align yourself with the market trends and not news events or predictions.
Disclosure: No holdings in the funds mentioned above.