Snaking Higher

Ulli Uncategorized Contact


Right now, it appears that nothing can seem to end the persistent climbing of the major indexes. Yesterday was no exception as the markets ended up higher by a few points.

Energy and utilities provided a boost along with better-than-expected existing home sales for November. Of course, oil rising above $90/barrel for the first time in 2 years can hardly be a considered a positive. Neither can be an anemic GDP growth of 2.6% annualized for the quarter.

None of this appears to matter to the markets as confidence seems to have increased that 2011 will be a much better year economically speaking, which is expected to support higher stock prices.

The big neutralizer will be the stubbornly high unemployment rate despite stronger numbers in manufacturing along with elevated consumer spending. To me, real estate will continue its downward spiral for the simple reason that we’re stuck with this high unemployment number. After all, last time I checked, people buy houses and make mortgage payments with monies earned from real jobs and not from unemployment benefits.

How these positives and negatives will play out next year is anyone’s guess. Stay on top of the trends so you can easily spot reversals and take evasive action via your sell stops, which will help to protect your portfolio from extreme downside risk.

Holiday Cheers

Ulli Uncategorized Contact


Three things got the markets going early on yesterday. For one, there was some sigh of relief that dangers of another Korean shootout were laid to rest, at least for the time being. Second, rumor had it that N. Korea was showing willingness to let the United Nations inspectors monitor its nuclear program.

Third, but not least, in regards to the European debt crisis, Chinese Vice Premier Qishan said that the nation would “back measures aimed at stabilizing European counties struggling with debt.” At least for this moment in time, global issues were not on traders’ minds.

The markets inched higher and never looked back. My plan to liquidate one of our country ETFs did not work out as the emerging markets staged a nice rebound rally after seeming to have stalled for the past few weeks. For the time being, we will hold on to this position subject to our sell stop rules.

All major indexes have climbed to some pretty lofty levels when looking at the percentages they have moved above their respective trend lines. The S&P; 500, for example, has now reached a point that is 9.8% above its 200-day moving average. Last time this happened was in late April prior to the market heading sharply south and surrendering some 15% by early July.

I am not suggesting that a repeat is imminent, but I am saying that, based on emails from and phone calls with readers, some investor complacency has definitely set in again. It is for certain that the markets will correct again, we just don’t know the timing and magnitude of it.

Simply be aware and make sure you have your exit strategy planned and in place, so you don’t panic when the next correction strikes.

Leaving Blue Chips Behind

Ulli Uncategorized Contact


The Nasdaq quietly made a new 3-year high yesterday, but the Blue Chips were left behind as American Express and Boeing proved to be a drag on the Dow and prevented the index from climbing above the 11,500 level.

Interest rates were up slightly, as were gold and oil. The Euro slumped heavily vs. the Swiss Franc and also lost ground against the dollar as Moody’s downgraded some of the Irish debt.

This week will be a short one as all markets will be closed on Friday. I would expect activity to slow down quite a bit as we closer to Thursday. While I will not initiate any new positions, I will continue to track all exit points. Actually, one of our country fund holdings hit its sell stop right on the money today but failed to break through it.

I’ll look at the opening activity tomorrow and will, barring any sudden upside move, liquidate the position.

Going Separate Ways

Ulli Uncategorized Contact


Ever since the Fed implemented the latest round of Quantitative Easing early in November, stocks and bonds have gone in different directions. The 3-months chart above shows the SPY (S&P; 500) vs. IEF, the 7-10 Year Treasury ETF.

Both hit their respective tops simultaneously (vertical arrow), after which bonds reversed direction and slid as interest rates rose. The stock market, as represented by the S&P; 500, dropped initially as well, but found some support and managed to maintain upward momentum although at a slower pace.

Nevertheless, despite having crept higher, stocks seem to have stalled even as economic numbers improved. The concern now is if interest rates continue to head higher at the pace of the past few weeks, stocks will be affected negatively.

We’ve seen emerging markets not only stall as well but come sharply off their highs made in early November. Some are now within striking distance of their trailing sell stops.

Based on reader emails over the weekend on the topic of sell stop percentages, here are the numbers again as I use them in my advisor practice:

For widely diversified domestic and international mutual funds and ETFs, I apply trailing sell stops of 7%. For more volatile sector and country ETFs, I use 10%—both are soft sell stops. That simply means that they are based on closing prices only and not intra-day market activity.

Sunday Musings: Thoughts On Inflation And Deflation

Ulli Uncategorized Contact

The prospect of inflation, along with the destruction of the dollar, seems to be on many readers’ minds. Frank’s question is very typical:

I have been reading your newsletter for over 2 years, and I enjoy your comments. I have one question and it is a big one do you think we are really heading into deflation or will inflation finally kick in?

While I am not an economist, I have some thoughts on the topic. Keep in mind that after the greatest real estate/credit bust the world has ever seen we have moved into unchartered territory.

To me that simply means that any sudden government or Fed action/intervention can have unintended consequences that can change previous assumptions. Case in point is the recent implementation of QE-2 (Quantitative Easing) in early November designed to stimulate the economy and keep interest rates low. Well, that did not work out too well as interest rates have been on a rising trajectory.

Given the current environment, I see more deflationary forces than inflationary ones. This does not mean it might not change in the future, especially with the Fed being hell-bent on producing inflation.

If I look around, I see nothing but red numbers on every level of government. Many states, cities and municipalities are not able to fulfill their obligations including pension plan promises; more layoffs are virtually a guarantee. I expect a host of cities to default and/or go through bankruptcy proceedings in order to reorganize with the purpose of reducing debt and obligations.

Looking over to Europe, the situation looks equally dire, if not worse, with debt problems being the center point of endless government meetings. All of these issues are deflationary in nature.

To be clear, if you follow sound Austrian economic principles, inflation is defined as the expansion of money supply and credit, with deflation being the opposite. Most readers, however, only look at price levels to define these terms. That’s incorrect, as prices are the effect and not the cause.

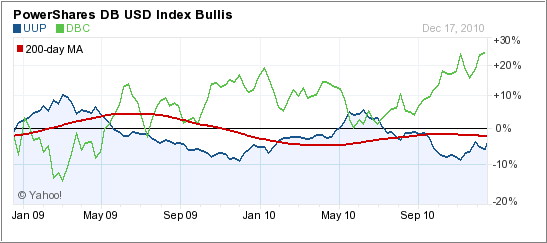
Talking about prices, there is an interesting play between the dollar and commodities. Most days, they move in opposite direction, as a weaker dollar is considered inflationary. Take a look at the following 2-year chart:


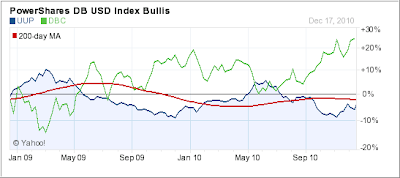
It shows the bullish dollar (UUP) compared to the commodity index (DBC). Their opposite price movements are clearly demonstrated. So, if you are worried about a declining dollar, DBC should be a part of your portfolio.

As I have posted before, the dollar has been the favorite whipping boy of the world for quite some. However, as soon as a crisis develops somewhere, everybody wants to own the dollar—don’t write it off yet.

Some economies are clearly overheating and are experiencing their own not yet admitted real estate/credit bubble. China, Canada and Australia come to mind. They are facing economic circumstances somewhat similar to what we witnessed around 2007. While inflation is an issue in these countries, it may not be once the bubbles burst.

At this time, I see no inflation on the horizon here in the U.S. I believe that we are following the footsteps of Japan, as we are attempting to solve our debt issue in the same manner that they did (stimulus attempts, creation of zombie banks, etc). Nothing was learned from the fact that stimulus programs don’t work in the long run and Japan, 20 years after their real state bust, has clearly proven that.

Disclosure: Holdings in DBC

More Trend Line Talk

Ulli Uncategorized Contact

In “Reader Question: More On Sell Stops,” reader Jon responded by saying the following:

If you buy only when the index cuts above the trend line and sell when it cuts below it you will, by definition, realize profits equal to the increase in the trend line between these two moments in time!

While that is correct if in fact the trend lines are sloping up, they sometimes continue to head south before heading higher, especially after a large correction. Reader Richard shared these thoughts:

Regarding today’s blog on Sell Stops, there is another reason to not base a Sell Signal on a major trend line. In my experience, when a price curve pierces a major trend line from below, thereby generating a Buy Signal, the trend line almost always still will be sloping downward, and, because the trend line is a relatively long-term moving average, the trend line will continue to slope downward for some time before turning upward.

If an equity’s price would turn downward during the meantime, and if the equity’s price would cross the trend line from above, thereby generating a Sell Signal, the trend line probably will be lower than it was when the Buy signal was generated, thereby resulting in a loss for that trade cycle. Therefore, relying on a major trend line as a Sell Signal would work only when Buy/Sell cycles would be of relatively long durations (which of course cannot be determined in advance).

The market meltdown of 2008, and the subsequent recovery in 2009, is a good example to demonstrate what Richard is talking about. The chart below shows a snapshot in time of the Domestic Trend Tracking Index (TTI) and its buy signal effective 6/3/09:


The trend line (red) was still in correction mode when the price line (green) crossed above it and generated a new Buy. It took about another 4 months before the trend line reversed direction and recovered enough to follow the price line higher.

My experience shows that you need to have at least a 6 months period from a buy to a potential Sell if you are relying on the upward sloping trend line to bail you out.

I have found it much easier and effective to use the upside crossing of the trend line as a Buy point only, while downside protection should be accomplished via your trailing sell stop points.