Hedging: Reader Q & A

Ulli Uncategorized Contact


Reader Sig had this comment after reading my new e-book “The Simple Hedge Strategy:”

First let me thank you for your continued effort to educate and inform us neophytes. I really appreciate your efforts on our behalf.

My question is this: I have found there is a 90 day holding period on most mutual funds. Am I correct, and if so, how does that work with this hedging information?

Yes, that is correct. Most brokerage firms have a 90-day holding period. That does not mean you can’t make adjustments to your mutual funds, but you will be charged for it. With most brokerage firms that should not have other dire consequences, such as you being considered a frequent trader.

All investment advisors usually rebalance once a quarter. However, the brokerage firm will charge them (and you) an early redemption fee if executed within 90 days. In the case of my custodian (Schwab), that would be $50 per mutual fund adjustment. If you run into problems with rebalancing by using the buy-and-hold superpowers (Vanguard and Fidelity), I suggest you move your account elsewhere.

There are 2 ways to get around the early redemption problem altogether when using my hedge strategy:

1. Make your rebalance adjustment with the short position (SH), and you will only pay the ETF trading fee, which in most cases is around $12.95.

2. Use only ETFs, if that is your mode of operation, and you won’t have to deal with that issue at all.

I think these ideas will help you work around those common mutual fund limitations.

Sunday Musings: Still Not Getting It

Ulli Uncategorized Contact

Despite last year’s (and this year’s) market collapse there are still plenty of writers, brokers and others who simply don’t get it. They have stuck to their proven method of losing a large amount of their portfolio value in record time due to, well, sheer ignorance.

Reader GH had this to say on the subject:

You simply must visit this page and ponder the nonsense.

Here’s an example: “…if you’ve not already proven that you can time the market effectively and consistently beat these passive strategies, then you have no excuse but to implement them until you do.”

Farrell and his followers never give up.

I have always chuckled about the “lazy portfolios” over the years, since they too ignore the fact that bullish portfolios will get killed in a bear market—no exceptions. MarketWatch continues to waste readers’ time by featuring the returns of those portfolios as shown in the following table:


If you are a buy and hold investor, you have now earned the right, if you had invested in these portfolios, to pound your chest and proudly declare having outperformed the S&P; 500.

Such perverse opinions are passed down from Wall Street. Some genius in the past figured out that, as a fund or money manager, all you have to do is outperform the S&P; 500, and you are a winner. The fact that you still lost some 33% is really immaterial; your investors are sure to forgive you.

Until the public finally wakes up to the fact that they are getting shafted over and over and start voting with their feet by leaving, it’ll be business as usual.

In a sense, we are our own worst enemy since deep down we’re always eager to accept something for nothing. Lazy portfolios promote that theme and, until people are willing to step up to the plate by taking responsibility, considering pros and cons of various investment approaches, they will always be left holding the empty investment bag when the bear rears its ugly head.

A Big Picture View

Ulli Uncategorized Contact


[Click chart to enlarge]

With the markets having plunged at an unprecedented rate over the past year, it helps to look at things in a historical context to see if any parallels exist.

The chart above does a fine job of showing were this current decline ranks in terms of past market disasters. I have featured it before, but it now has been updated through 3/5/09. It’s courtesy of Doug Short, and I appreciate the efforts that went into producing this gem.

To me, there are only 2 lines of interest at this particular time. The gray line, which shows the effects of the crash of 1929 and the superimposed blue line, which demonstrates the drop of the current bear market.

The similarities are striking although the 1929 the initial crash happened much faster than the current one. What turned out to be devastating back then was the rebound after the initial -47.9% drop, which lured many investors back into the market believing that the bull had returned with full force.

That wrong assumption turned out to be deadly for those holding on to their positions for dear life until there was not much left when the bear made its final curtain call after having destroyed the Dow by -89.2%.

Looking at the current bear (blue), which is showing losses of -56.4%, it becomes clear that the bottom may not have been reached. Nobody knows for sure, but those continuing to cling to their buy-and-hold philosophy have learned nothing from history (and bear markets) and may be destined to repeat it.

No Load Fund/ETF Tracker updated through 3/5/2009

Ulli Uncategorized Contact

My latest No Load Fund/ETF Tracker has been posted at:

http://www.successful-investment.com/newsletter-archive.php

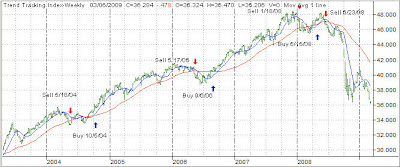
Despite feeble rebound attempts, the major indexes ended sharply lower as the bear dug in deeper. Our Trend Tracking Index (TTI) for domestic funds/ETFs remains below its trend line (red) by -12.84% thereby confirming the current bear market trend.


The international index now remains -23.22% below its own trend line, keeping us on the sidelines.


For more details, and the latest market commentary, as well as the updated No load Fund/ETF StatSheet, please see the above link.

Reader Help Requested

Ulli Uncategorized Contact

I am continuing with a research project and would like to ask for your help. If you have ever used a no load Growth & Income mutual fund, with at least a 4% dividend yield, please share the ticker symbols with me.

It does not matter that this fund may have lost big last year, as long as it is no load and widely available at major brokerage firms.

Either post the ticker symbols in the comment section or send me an email to: ulli.niemann@gmail.com.

Thanks.

Looking For Support

Ulli Uncategorized Contact

With the markets having matched the lows made in 1996, and the S&P; 500 closing below the 700 level a couple of days ago, the question remains where the next support, which may provide a temporary bottom, is.

In times like this, it pays to look at technical support and resistance levels for the various indexes. Let’s focus only on the widely followed S&P; 500 and review what MarketWatch had to say in “Further losses likely before the next major low:”

After concluding its worst six-month span since 1932, the Dow Jones Industrial Average has broken into the 6,000s to start March.

This places the blue-chip benchmark and the S&P; 500 at less than half their record highs established 17 months ago, and based on the current backdrop, further losses are likely before a sustained upturn.

Beginning with the S&P; 500, its hourly chart details the past three weeks (see chart in article).

With this week’s downturn, the index has broken decisively under the November low of 741, notching its worst close since October 1996.

From current levels, first resistance holds at 729 — matching the bottom of Monday’s gap — and is followed by more significant overhead around 741.

Meanwhile, the S&P;’s 10-year view is even uglier.

In its case, the S&P; closed Monday on the 700 mark representing a nearly 10% break below the 2002 low. (Again, this chart doesn’t include the March price action).

Looking ahead, the index faces major resistance spanning from 741 to 768, bracketing the November low and the 2002 trough.

Conversely, notable downside targets fall out as follows:

1. S&P; support around 680. The May, June and July 1996 peaks each fell within five points of this level.

2. S&P; support at 600. The January 1996 low held at 597, and the July 1996 low came in at 605.

Based on the current backdrop, an eventual retest of the S&P; 680 area looks increasingly likely.

There you have it. What this simply means is this. If a rally materializes, expect it to run into resistance at the 729 level; if that gets pierced, then watch out for the 741 level.

On the downside, support may kick in at around 680 and, if that is taken out, we may be looking at 600, which many forecasters have called to be the ultimate bottom.