ETF/No Load Fund Tracker Newsletter For Friday, August 26, 2011

Ulli ETF Tracker Contact

ETF/No Load Fund Tracker StatSheet

————————————————————-

THE LINK TO OUR CURRENT ETF/MUTUAL FUND STATSHEET IS:

https://theetfbully.com/2011/08/weekly-statsheet-for-the-etfno-load-fund-tracker-newsletter-updated-through-8252011/

————————————————————

Market Commentary

Friday, August 26, 2011

ONE WEEK DOES NOT MAKE A MONTH

Finally, after 4 weeks of losses, the major market ETFs managed to pull out a win, although it was marked by the usual amount of volatility during which the bears easily could have taken over. Nevertheless, this week, the bulls prevailed.

With only 3 trading days left in the month of August, the markets will have to take off in a straight line to make up the S&P’s monthly loss of -8.90%.

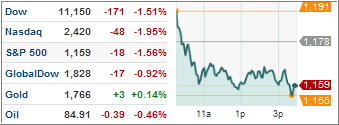
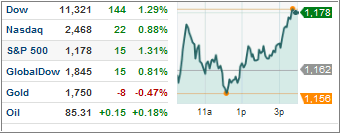
Today was not smooth sailing, despite the close to the upside, as the Dow swung wildly within a 352 point trading range. Stocks got hammered early on during the Bernanke speech after which the rebound started, and we went straight up from there.

With Bernanke not making any new stimulus commitment, and postponing any further action until the September meeting, the markets really had nothing to go by. Although, to me it seems that a lot of shorts were caught having to cover as the markets headed higher, which may have contributed to this strong rebound.

Not helping was the revised 1% GDP second quarter estimate (down from 1.3%), which confirms the economy is stalling at best, and this year’s growth is the worst since the recovery began in mid 2009. Additionally, consumer sentiment fell to its lowest level since November 2008 supporting my long held view that the consumer is very concerned about the state of economic affairs.

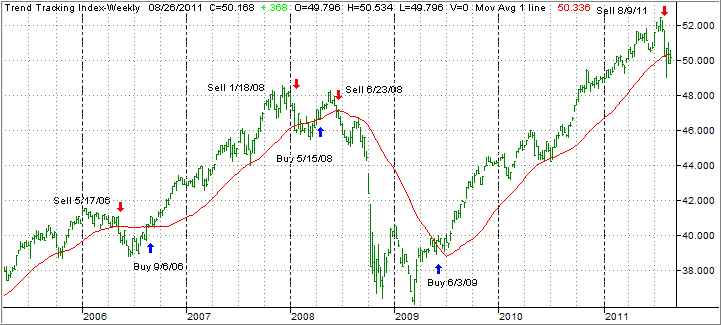
Our Trend Tracking Indexes (TTIs) improved their positions and are hovering above and below their respective trend lines as follows:
Read More

Weekly StatSheet For The ETF/No Load Fund Tracker Newsletter – Updated Through 8/25/2011

Ulli ETF StatSheet Contact

ETF/Mutual Fund Data updated through Thursday, August 25, 2011

If you are not familiar with some of the terminology used, please see the Glossary of Terms.

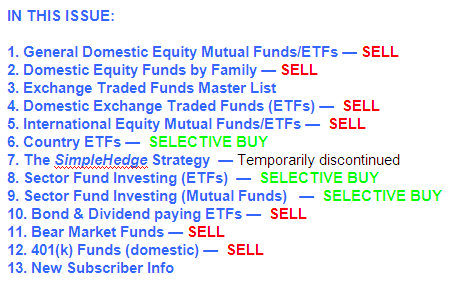
1. DOMESTIC EQUITY MUTUAL FUNDS/ETFs: SELL — since 8/9/2011

The domestic TTI broke through its long-term trend line generating a Sell for this area effective 8/9/2011. Over the recent past, we’ve seen the TTI hovering slightly below and above this dividing line between bullish and bearish territory. I will not issue a new Buy signal until this index has clearly pierced the trend line to the upside and has remained there for a few trading days.

As of today, our Trend Tracking Index (TTI—green line in above chart) has broken back below its long term trend line (red) by -0.26%.

Read More

Major Market ETFs Head Back South Again

Ulli Market Commentary Contact

After 3 up days, the short-term trend abruptly reversed, and the major market ETFs slipped based in part on speculation that Fed chief Bernanke’s widely anticipated announcement tomorrow may not include a major stimulus idea.

If so, that lack of action could further accelerate the downward momentum and confirm the current bearish market tendencies.

Read More

High Volume ETFs On The Cutline – Updated Through 8/24/2011

Ulli ETFs on the Cutline Contact

Despite the rebound of the past 2 days, we’re still down about -1.34% from last week as measured by the S&P 500. This continued slippage is reflected in the Cutline report, as there are currently only 13 ETFs positioned on the bullish side, while 76 still hover below the line and in bear territory.

To repeat, the High Volume ETF Cutline report includes all ETFs above and below the cutline (trend line). To clarify, High Volume (HV) ETFs are defined as those with an average daily volume of $10 million or higher.

These ETFs are generated from my selected list of some 90 that I use in my advisor practice. It cuts out the “noise,” which simply means it eliminates those ETFs that I would never buy because of their volume limitations.

Take a look at the most recent table:

Read More

Equity ETFs Propel Higher During Last Hour

Ulli Market Commentary, Uncategorized Contact

Meandering around he unchanged line was the theme of the day until the last hour, when the bulls shifted into high gear and propelled equity ETFs to a third gain in a row supported by a better than expected durable goods order report.

Additionally, with the beating of the financial stocks over the past few months, there may have been some inkling that a potential bottom was in, after the 18% drop since

April and that in general stocks were cheap. Support for the S&P 500 is lurking at the 1,120 level, which has been touched seven times since August 8.

The whipping boy of the past couple of days was predominantly gold as the precious metal came sharply off its highs by some 5% today. No surprise there, since any asset class that rallies over 25% in less than 2 months is clearly subject to a correction.

Margin calls for buyers at higher prices may have played a role in the sudden pullback while central banks around world remain buyers of gold.

In regards to PRPFX, as well as its ETF equivalent, it was a down day as most of its components headed south, including bonds, gold, real estate, Swiss Frank and silver. It was just one of those days to serve as a reminder that there is no such thing as a perfect investment.

Our hedge has moved slightly into negative territory as the matrix shows:

Read More

7 ETF Model Portfolios You Can Use – Updated through 8/23/2011

Ulli Model ETF Portfolios Contact

Despite yesterday’s rally, the S&P 500 remains down by -2.6% from last Wednesday’s ETF Model Portfolio report.

As a result, some portfolios fell as well, but only slightly, while others bucked the trend and rose. The reason for the rise of most portfolios is that we have been stopped out of those holdings that are very volatile, which gives us a little more stability in this current environment.

Our #1 Trend Tracking Portfolio showed the largest percentage gain, despite some drag on our short component, as the markets rallied yesterday. Going the opposite way was the #7 portfolio, which is the top performer YTD, but seems to lag during sudden rallies.

Take a look at this week’s numbers:

Read More