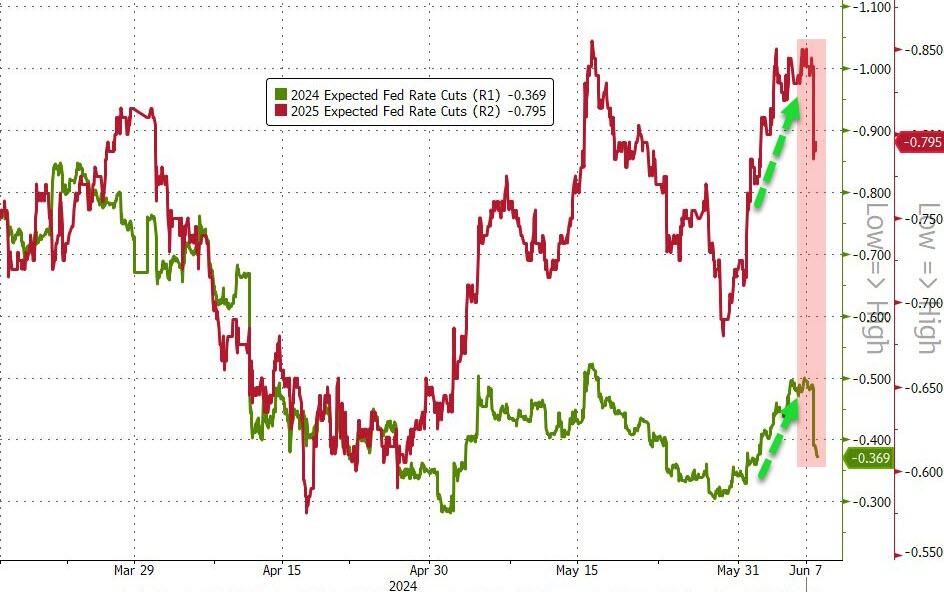
With the much-anticipated jobs report out of the way, but Wall Street still pondering its implications, the new focus is on the Fed’s interest rate decision and last month’s inflation data.
Both are due out Wednesday with the CPI potentially being a crucial point for market direction. Especially, after Friday’s allegedly strong jobs report, the Fed might continue its present policy of “higher for longer” and not cave in to Wall Street’s relentless hopes of lower rates.
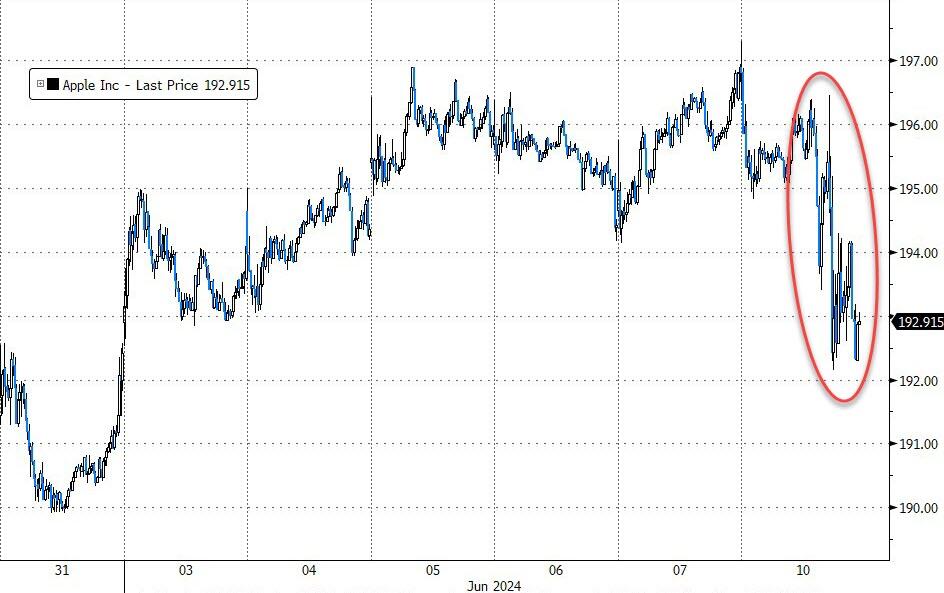
Elsewhere, traders were also watching for any earthshaking new announcements from Apple’s Worldwide Developers Conference, as to any market impacting software products. In the end, their AI message was a somewhat of a disappointment, which was reflected in their stock back peddling.
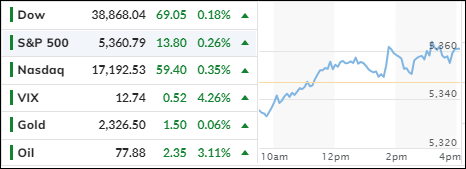
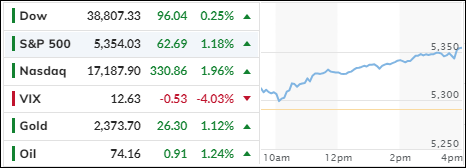
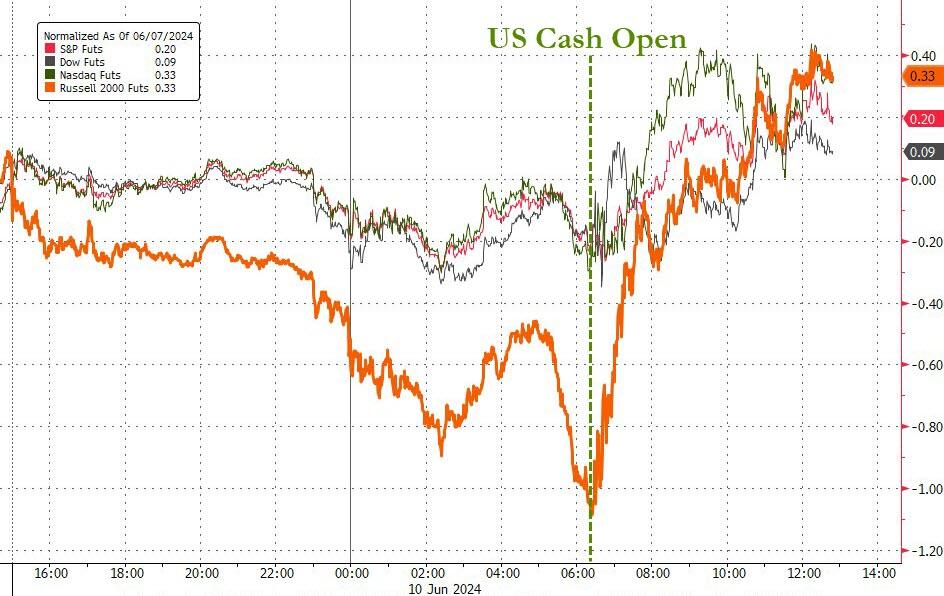
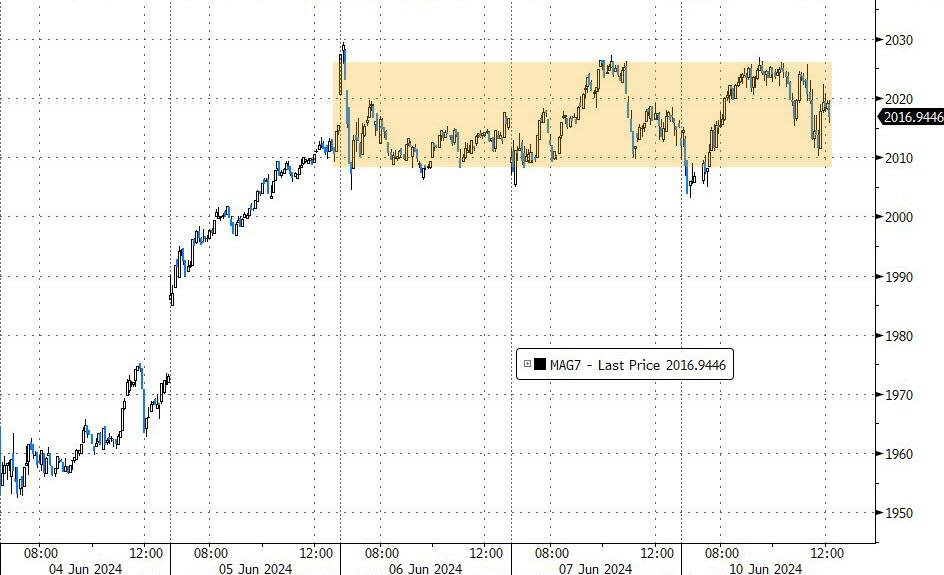
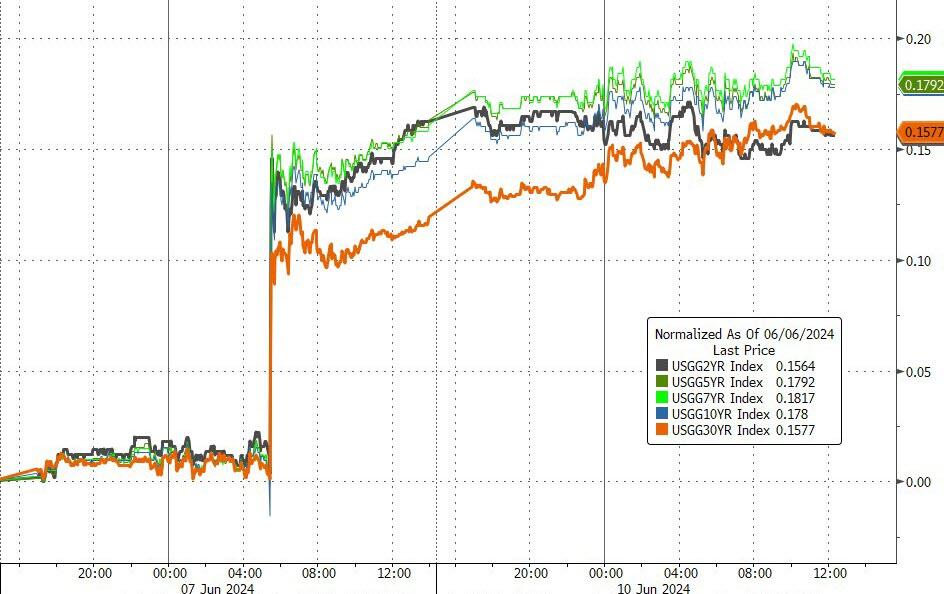
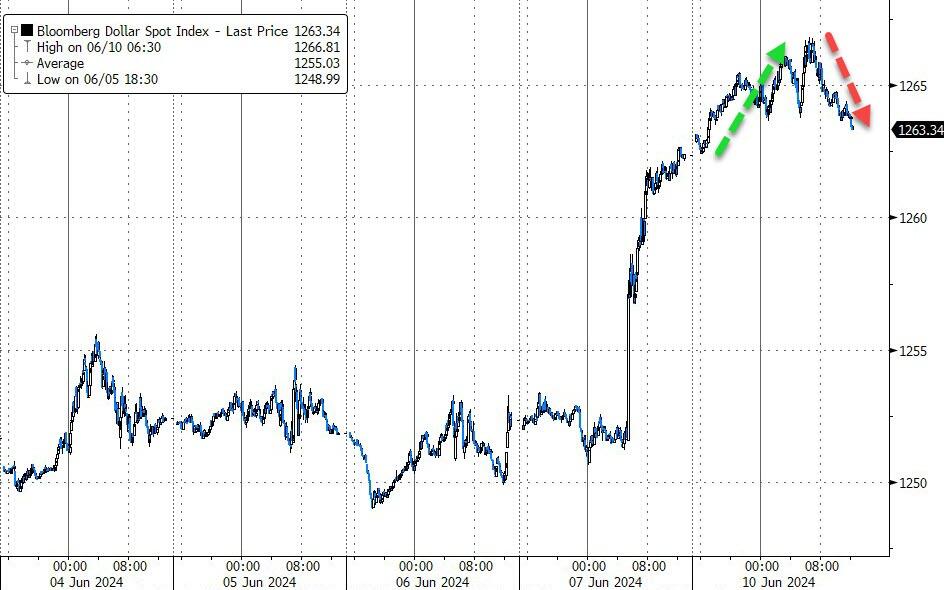
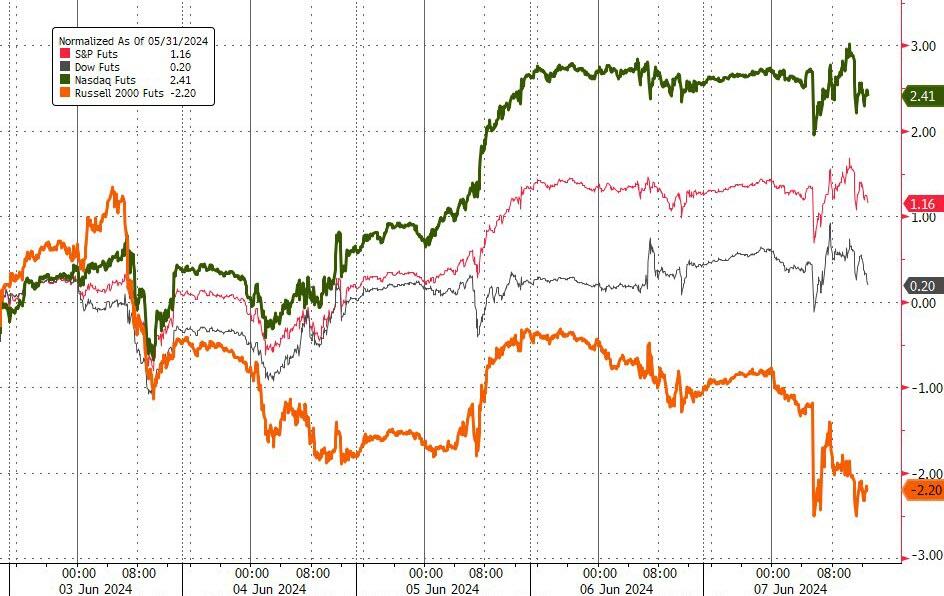
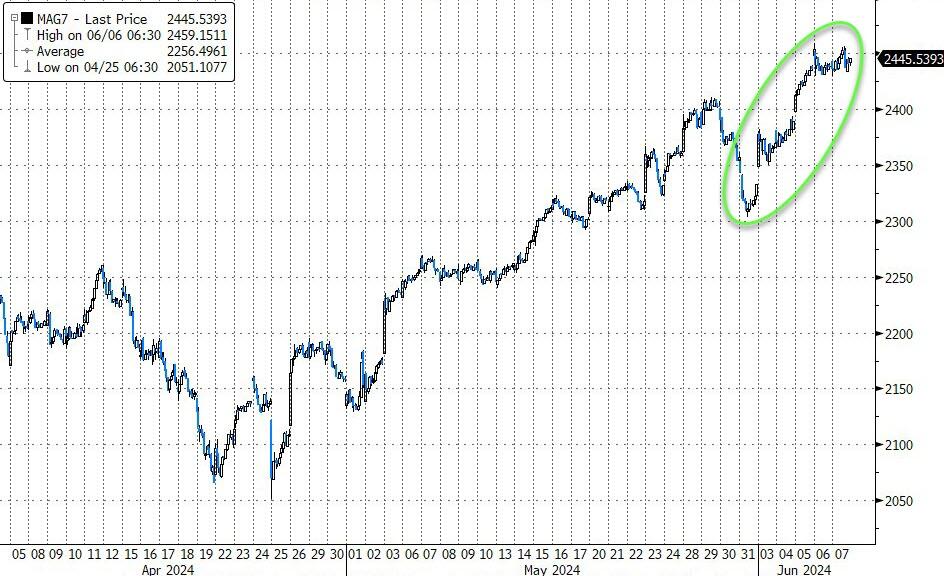
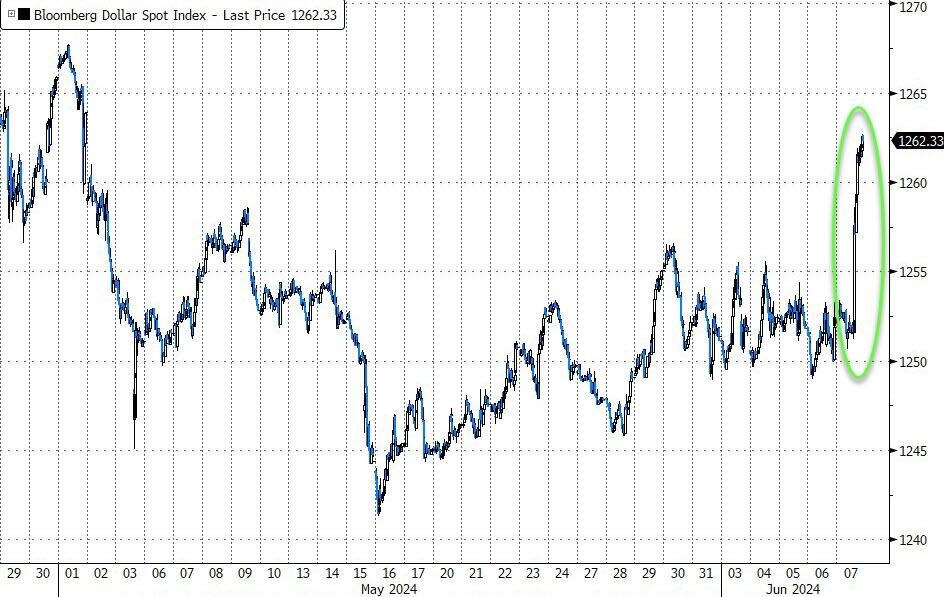
After overcoming an initial drop, the major indexes recovered and scored moderate gains across the board, despite the wild ride Small Caps participated in. The MAG7 group went sideways, bond yields crept higher, and the dollar bounced and trounced but closed up.
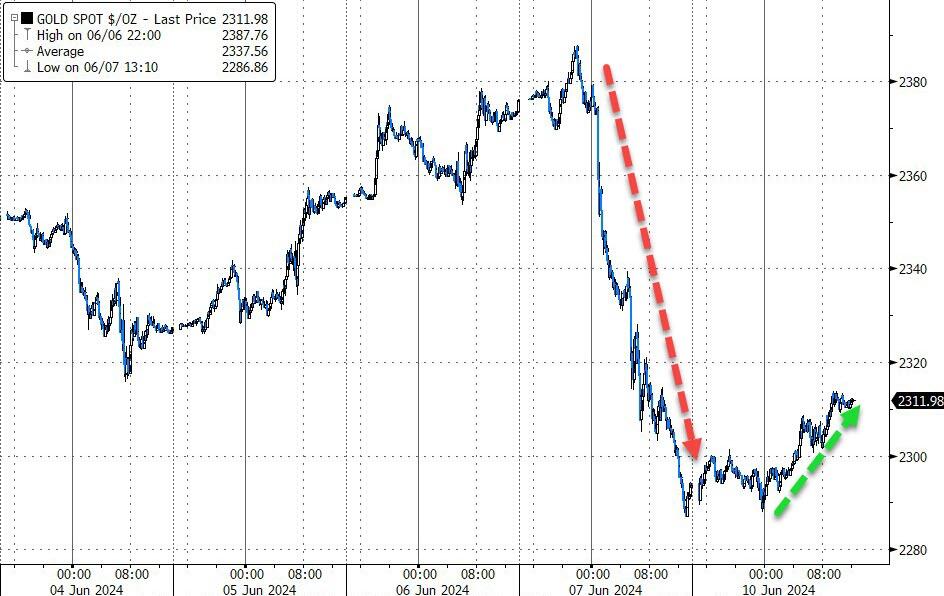
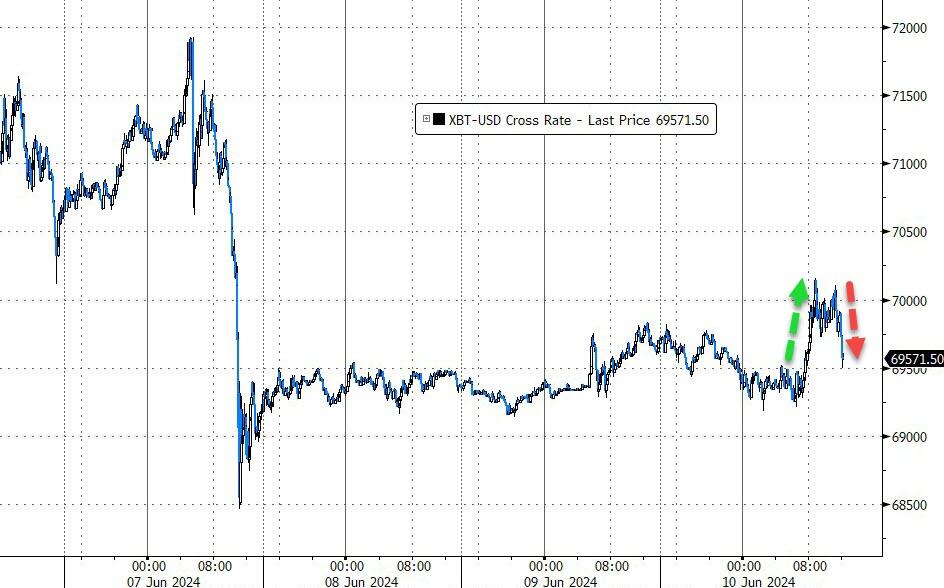
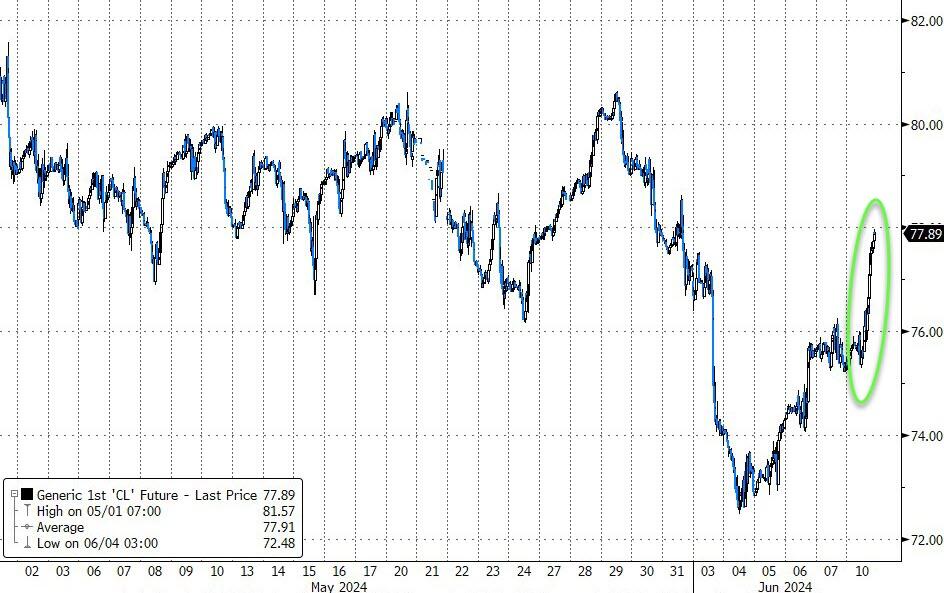
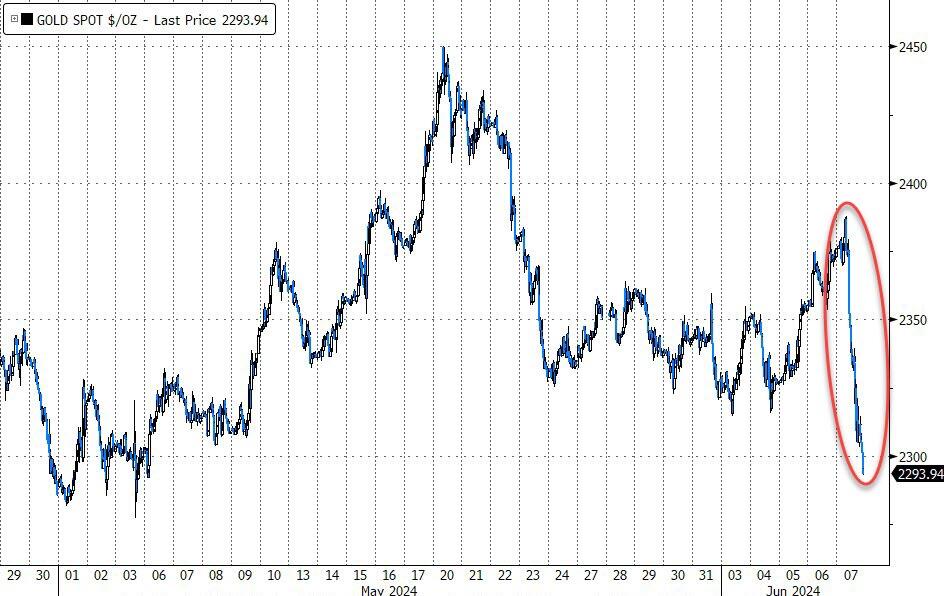
Gold found a bottom and rebounded, Bitcoin rallied to $70k but pulled back, while crude oil built on recent bullish sentiment and added over 3% but fell just short of reaching $78.
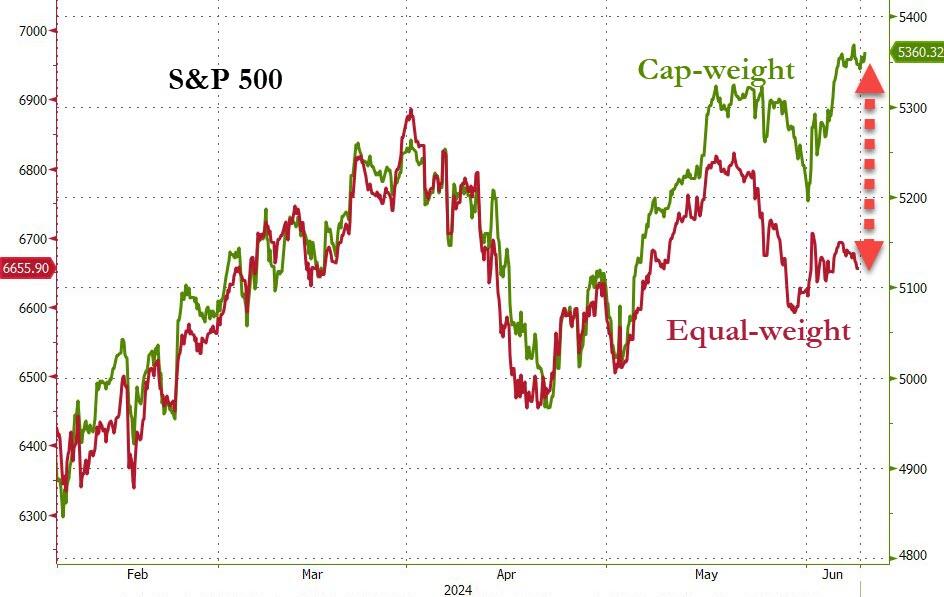
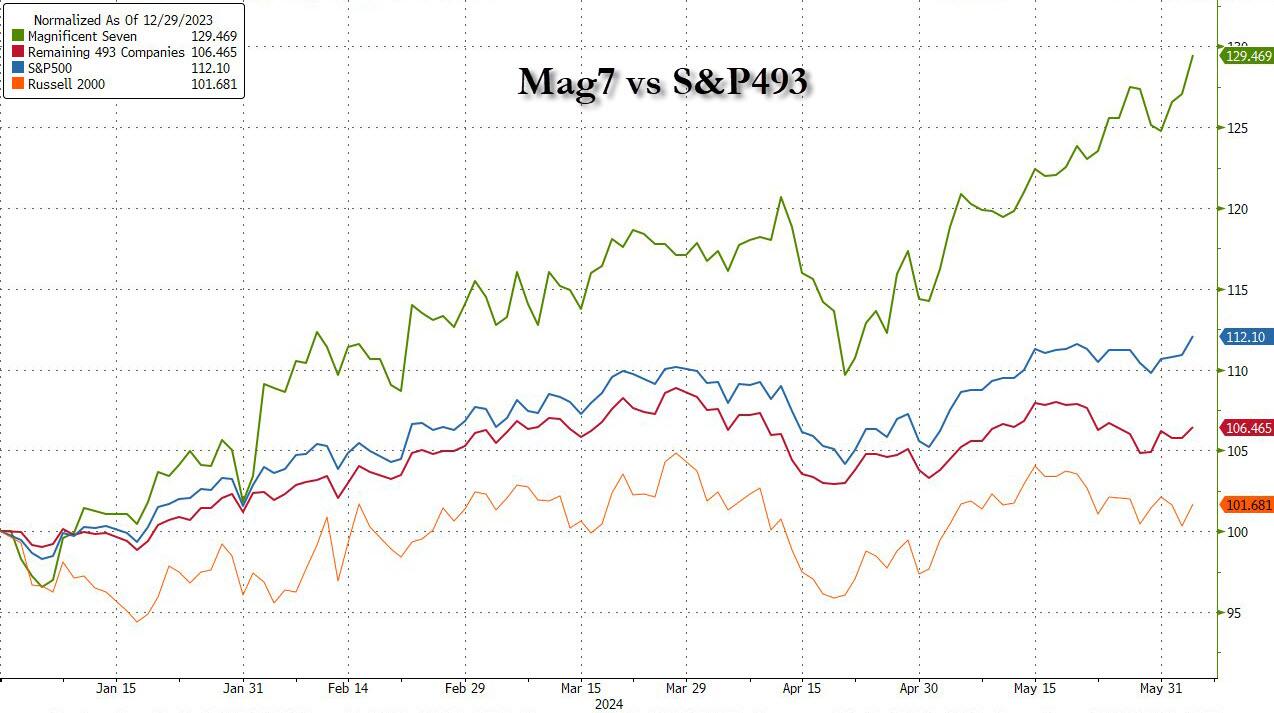
Another divergence could signal trouble for the markets, as ZH pointed out, when looking at the S&P 500, namely the Cap-weighted vs. the Equal-weighted version. This is the largest gap since the peak in 2008/09.
Do you want to know which ETFs are hot and which ones are not? Then you need my High-Volume ETF Cutline report. It tells you how close or far each of the 311 ETFs I follow is from its long-term trend line (39-week SMA). These are the ETFs that trade more than $5 million a day, so they are not some obscure funds that nobody cares about.
The report is split into two parts: The winners that are above their trend line (%M/A), and the losers that are below it. The yellow line is the line of shame that separates them. You can see how many ETFs are in each group and how they have changed since the last report (268 vs. 266 current).
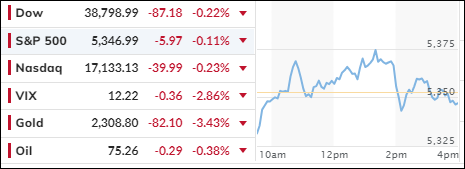
STRONG JOBS REPORT SHAKES RATE CUT DREAMS, BOND YIELDS LEAP
[Chart courtesy of MarketWatch.com]
Moving the markets
Traders’ dreams for an interest rate cut were dashed this morning, as the jobs report came in stronger than expected. Nonfarm payrolls allegedly increased by 272k last month, considerably above expectations of 190k and April’s 175k. Oddly enough, the unemployment rate increased to 4%.
Wall Street had been wishing for weak numbers in anticipation that the Fed might step in and loosen up its interest rate policy. This stronger performance will likely limit them in following the footsteps of the Bank of Canada and ECB, unless other pertinent data point to more widespread economic difficulty.
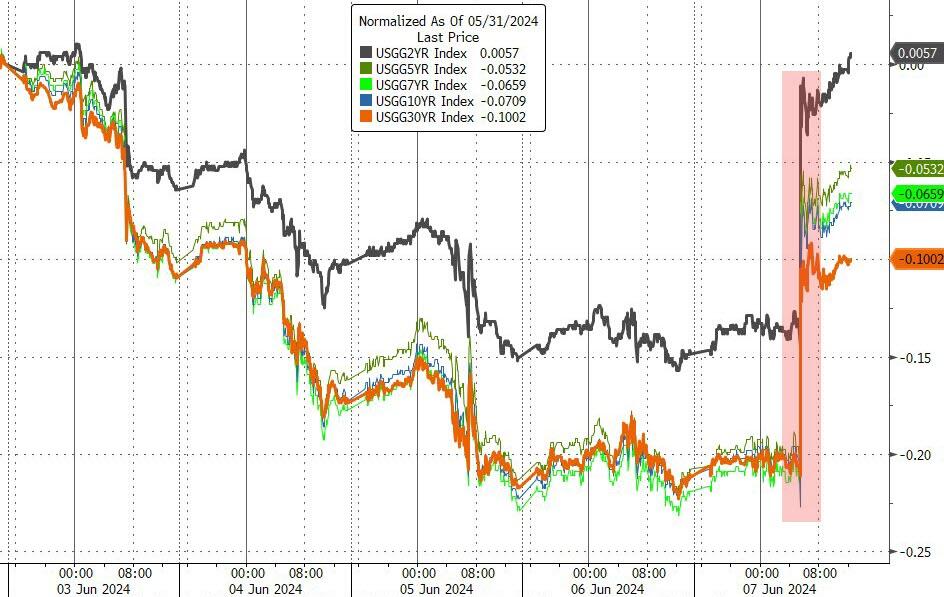
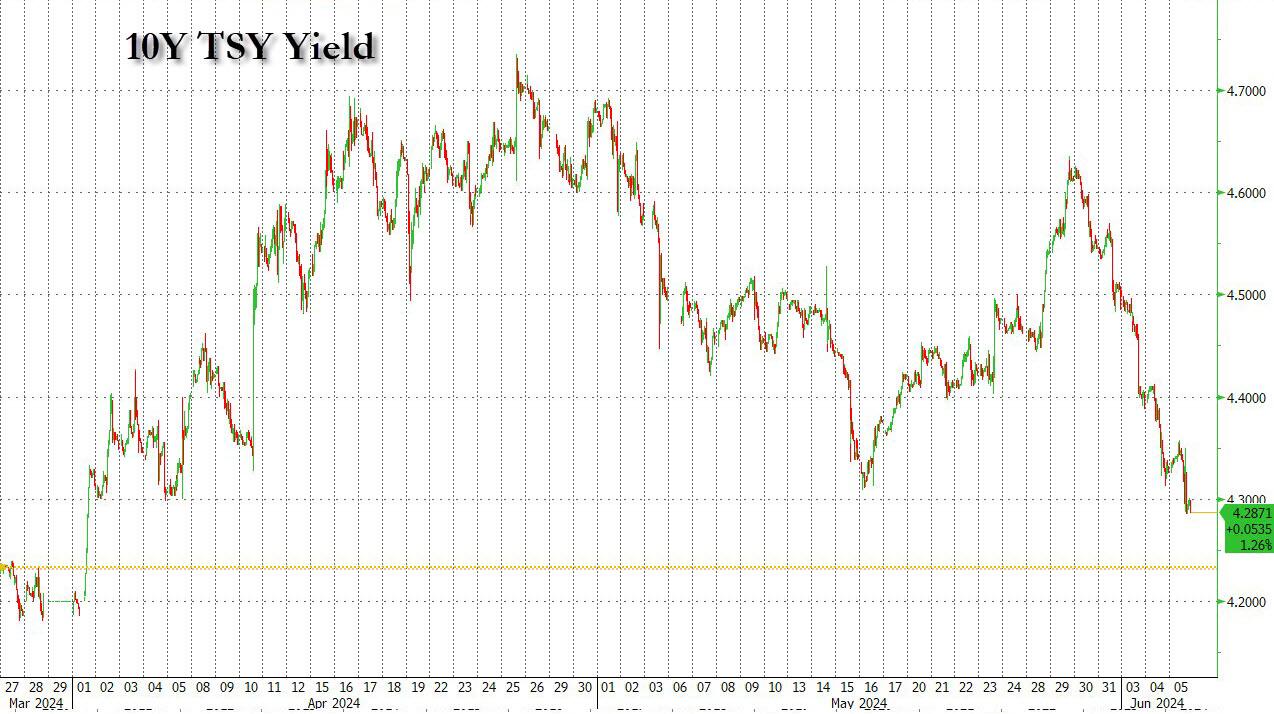
Bond yields surged on the news with the 10-year up some 14 basis points to 4.44%. Despite the disappointment, bullish sentiment prevailed with the major indexes recapturing their unchanged lines, vacillating around them but then dumping into the close.
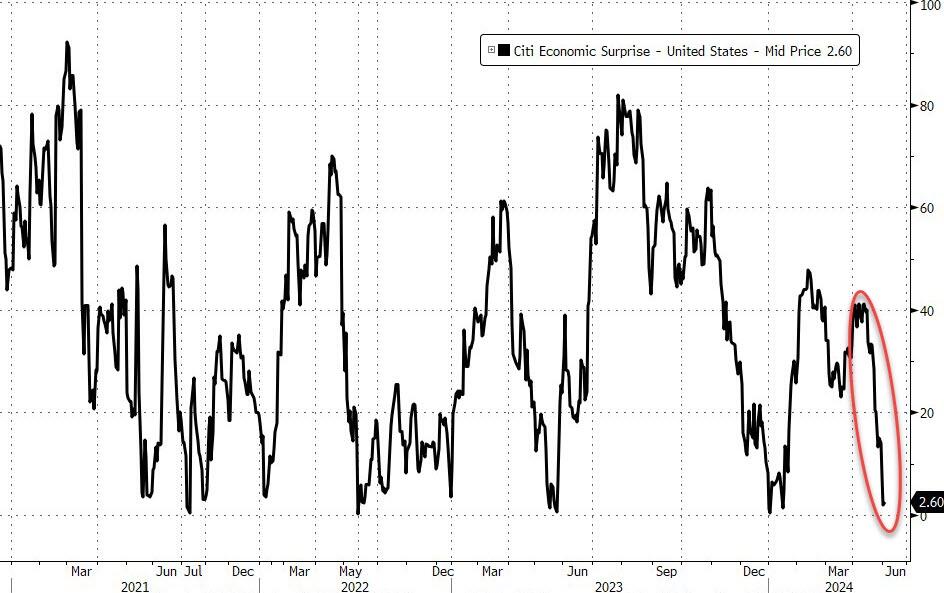
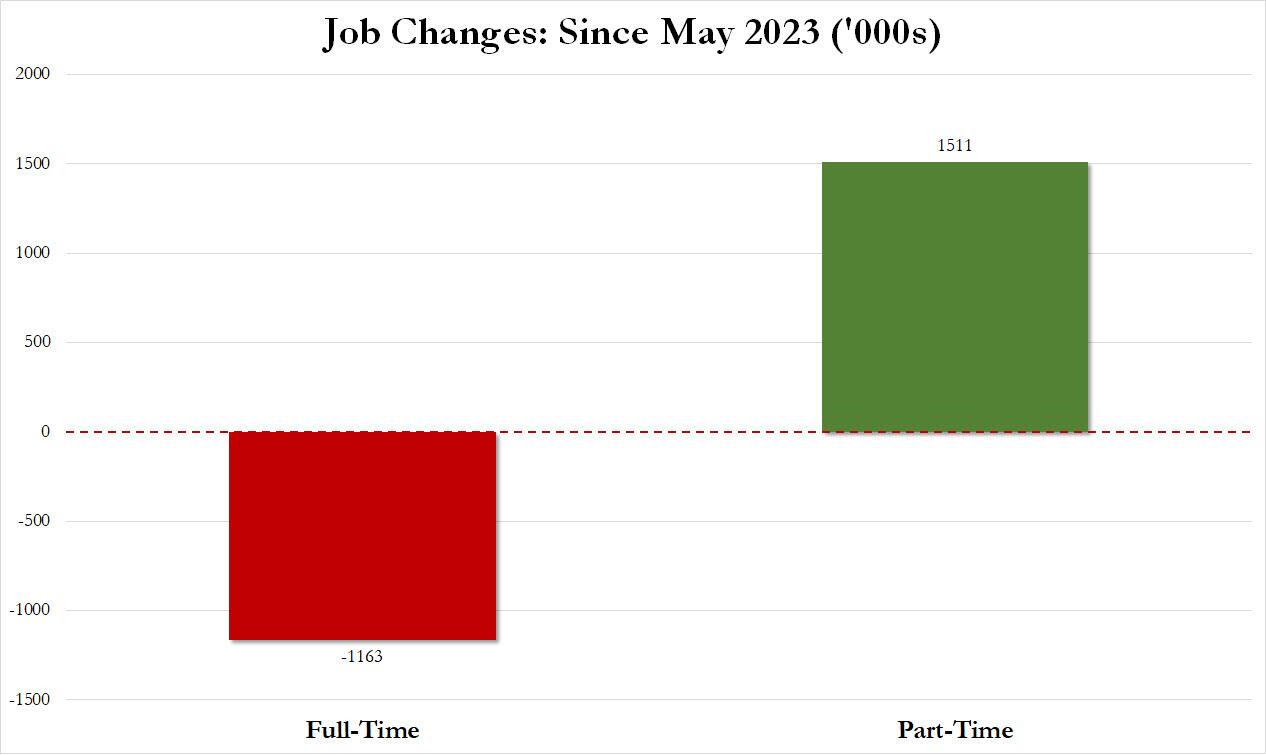
Overall, weaker than expected economic data pulled the Citi Economic Surprise index lower, making today’s payrolls report an outlier and questionable. Looking under the hood, it turned out, as ZH reported, that in the past year 1.2 million full-time jobs have been lost and replaced by 1.5 million part-time jobs.
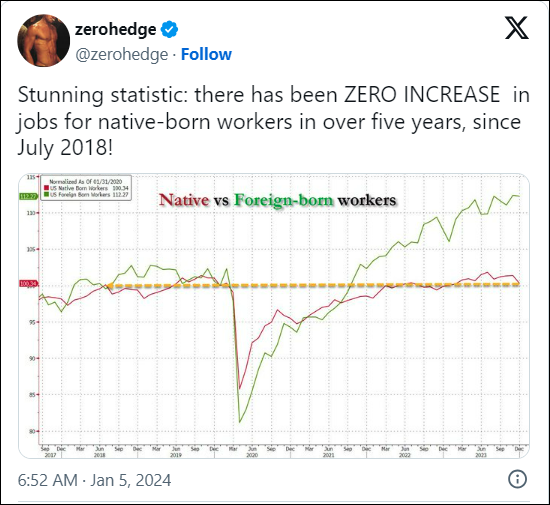
As far as the month of May 2024 is concerned, 625k full-time jobs were lost in one month, replaced by 286k part-time. And, as I reported yesterday, the change in employment since December 2019 looks like this.
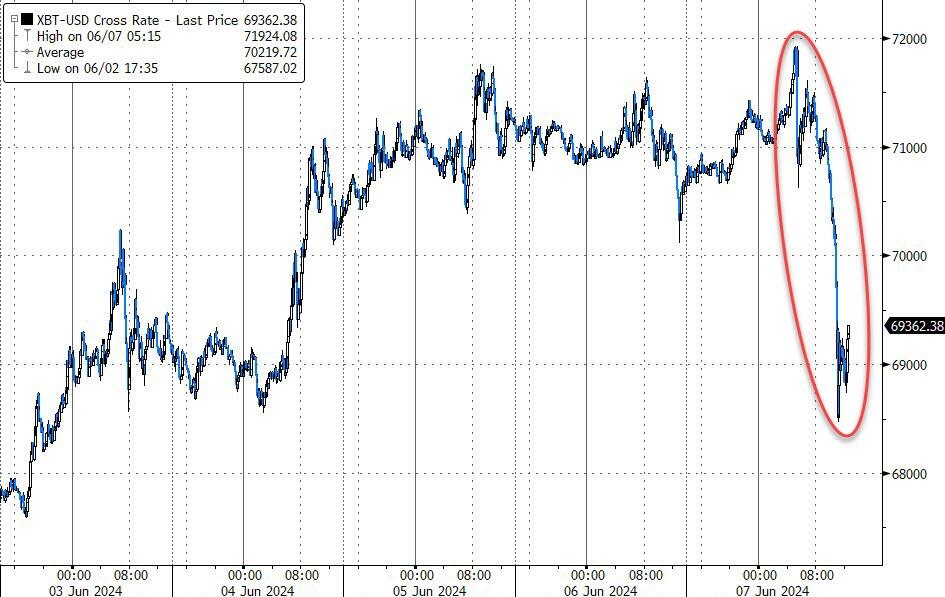
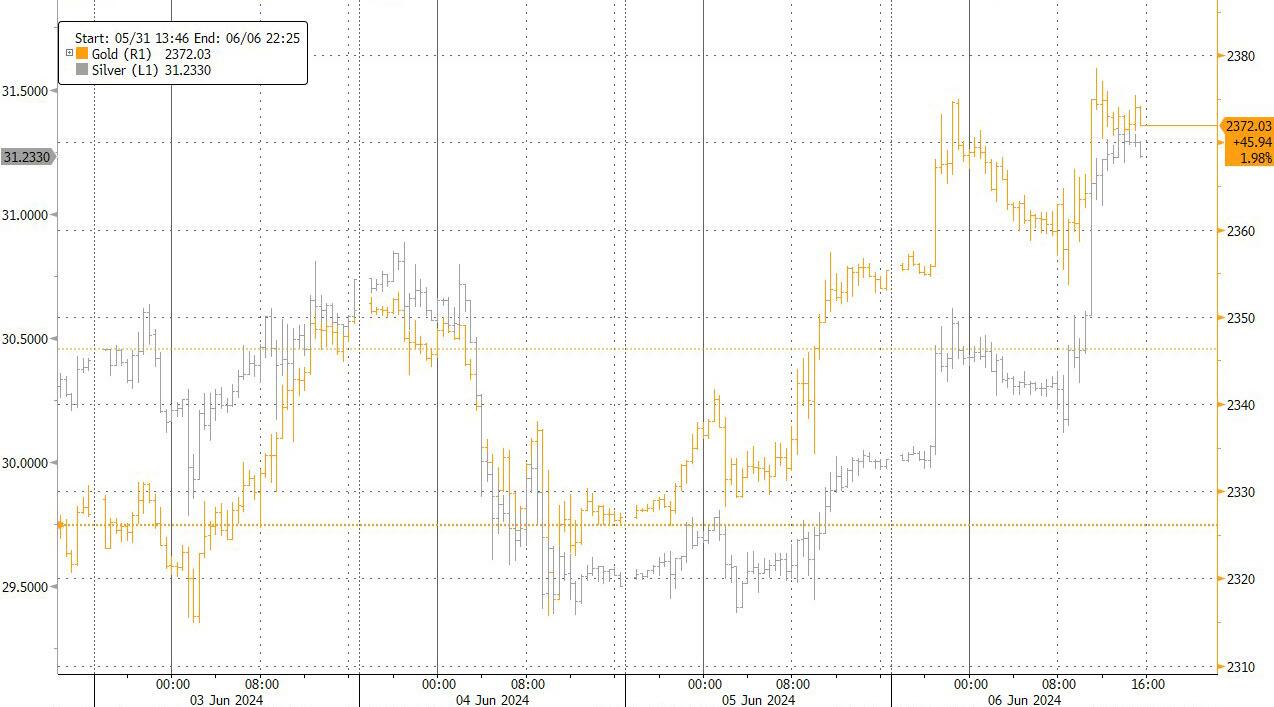
Bond yields, after slipping for 4 days, spiked today, which propelled the dollar higher, but pulled the rug out from under gold, which headed back down to its early May lows. Bitcoin followed suit and surrendered its gains from the last few days.
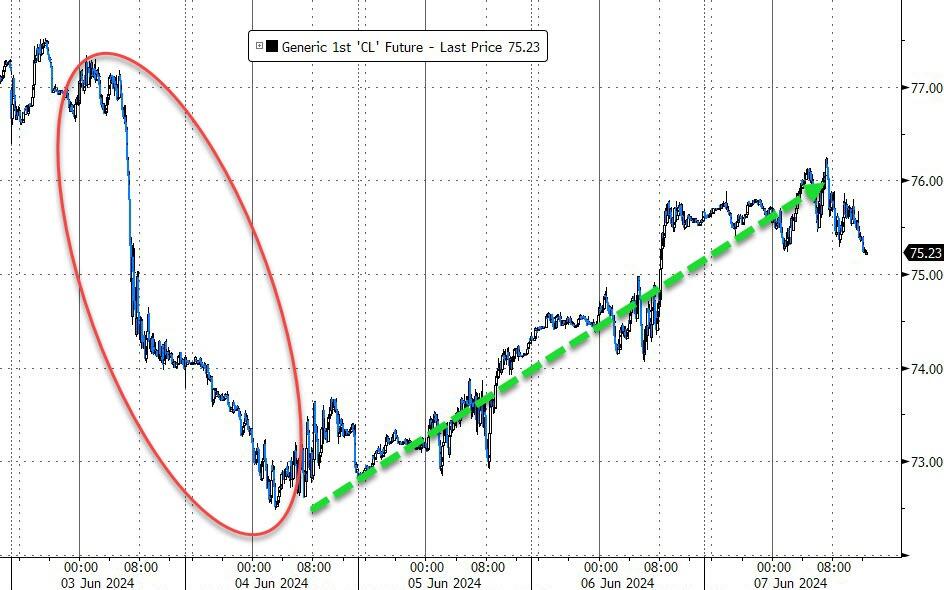
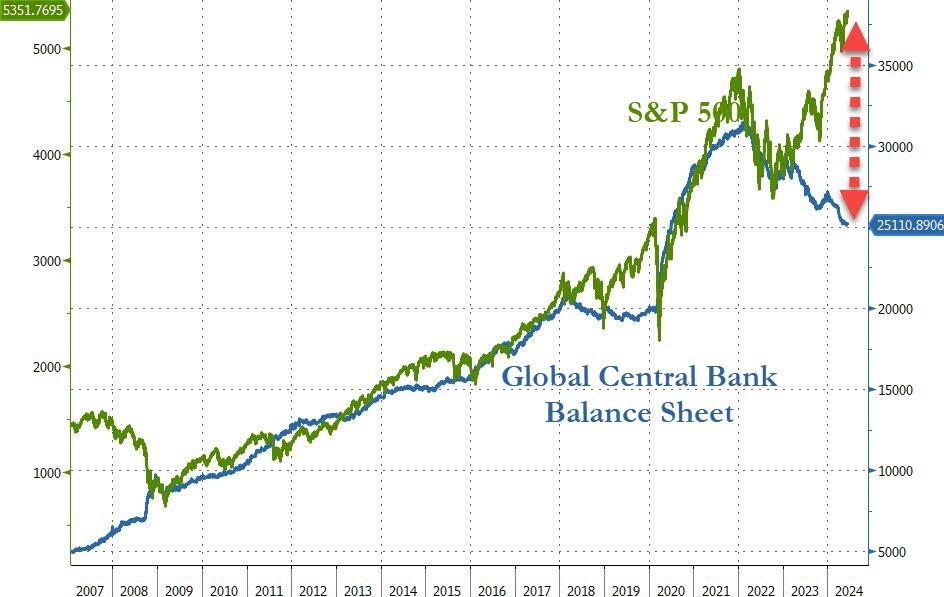
Crude oil prices recovered from Monday’s dump, but global liquidity seems to have disappeared and created an untenable situation, as this chart demonstrates.
Out of the 1,800+ ETFs out there, I only pick the ones that trade over $5 million per day (HV ETFs), so you don’t get stuck with a lemon that nobody wants to buy or sell.
Trend Tracking Indexes (TTIs)
These are the main indicators that tell you when to buy or sell Domestic and International ETFs (section 1 and 2). They do that by comparing their position to their long-term M/A (Moving Average). If they cross above, and stay there, it’s a green light to buy. If they fall below, and keep going, it’s a red light to sell. And to make sure you don’t lose your shirt if things go south, I also use a 12% trailing stop loss on all positions in these categories.
All other investment areas don’t have a TTI and should be traded based on the position of each ETF relative to its own trend line (%M/A). That’s why I call them “Selective Buy.” In other words, if an ETF goes above its own trend line, you can buy it. But don’t forget to use a trailing sell stop of 12%, or less if you’re feeling nervous.
If some of these words sound like Greek to you, please check out the Glossary of Terms and new subscriber information in section 9.
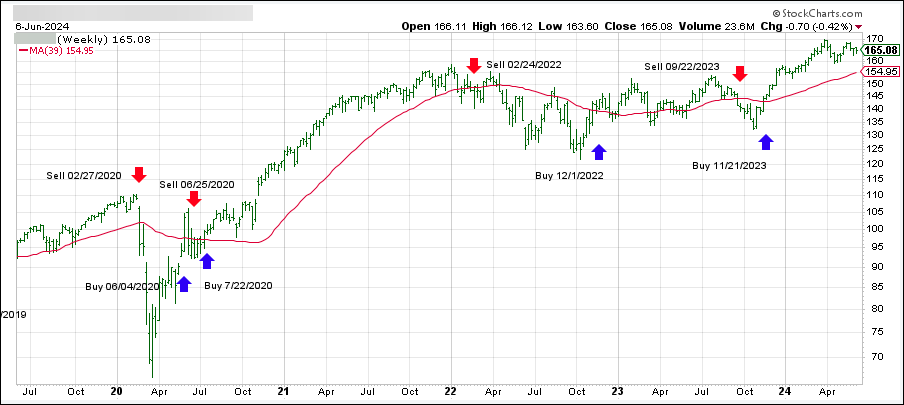
DOMESTIC EQUITY ETFs: BUY— since 11/21/2023
Click on chart to enlarge
This is our main compass, the Domestic Trend Tracking Index (TTI-green line in the above chart). It has broken above its long-term trend line (red) by +6.88% and is in “Buy” mode as posted.
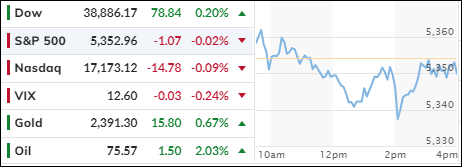
The markets predominantly trod water after the S&P’s fresh record close, with traders’ eyes now focused on tomorrow’s jobs report.
Friday’s non-farm payrolls report for May will be analyzed carefully, because any weakness in the labor force will freshen hopes that the Fed might indeed cut rates. Expectations are for 190k in new jobs created.
Optimism prevails on Wall Street that the economy is still doing well, despite much evidence to the contrary. A cooling job market will be hard to reverse once it starts, which is why traders believe a rate cut is on the horizon.
More pressure will be on the Fed after the Bank of Canada cut rates by a measly 0.25%, which was followed this morning by the ECB. That tiny reduction appears to be more like a market pleasing goodwill gesture rather than a serious effort. Remember, all Central Banks are walking a tightrope, because lowering rates to save failing economies will stoke inflationary fires.
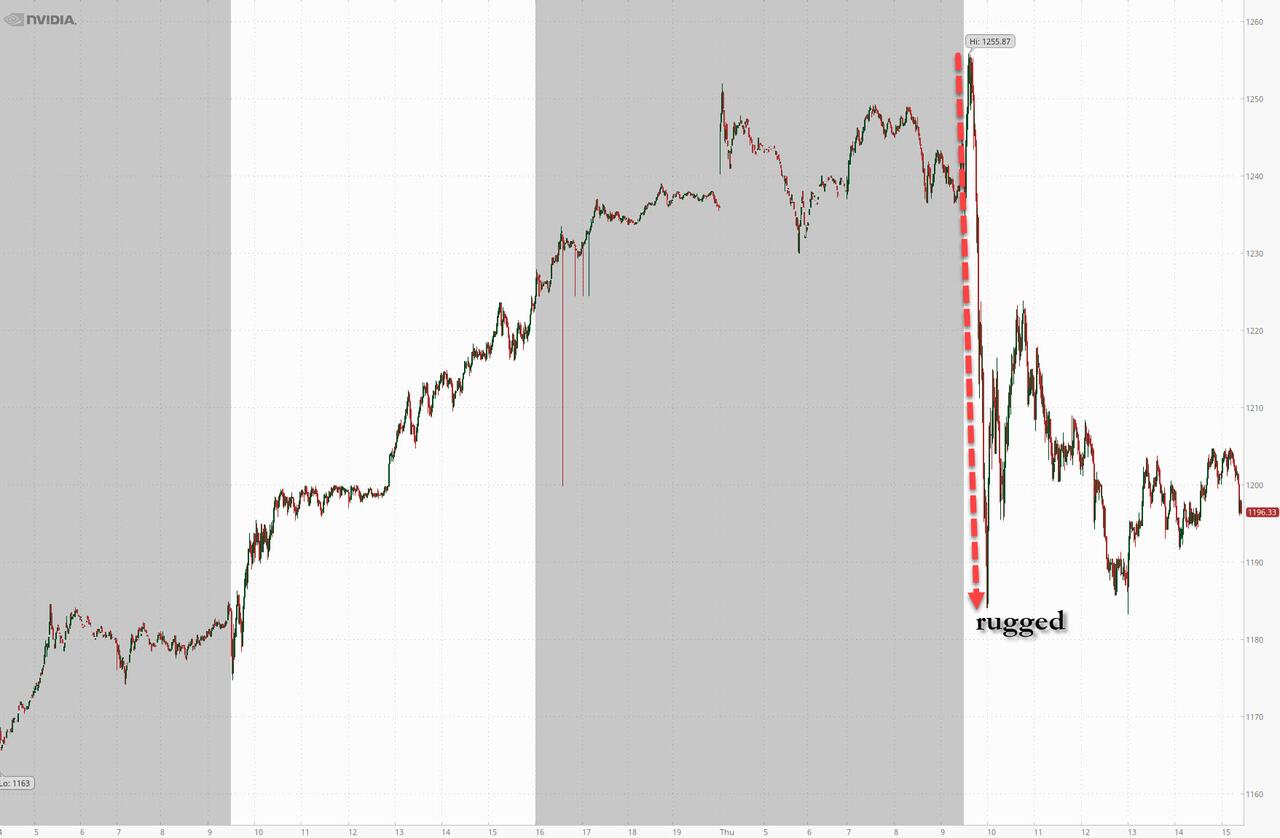
Tech darling Nvidia’s upward momentum got crushed during this session, with the company losing some $175 billion in market cap. Gold and silver picked up on the BoC and ECB rate reductions and continued their upward swing.
In terms of the US Labor market, which has been horrendously weak, it was now confirmed what ZeroHedge pointed to a more than a year ago, namely that all the job growth in the past few years—drumroll—has gone to illegal aliens.
I leave it up to you to ponder this chart and arrive at your own conclusions:
Continue reading…
2. Current “Buy” Cycles (effective 11/21/2023)
Our Trend Tracking Indexes (TTIs) have both crossed their trend lines with enough strength to trigger new “Buy” signals. That means, Tuesday, 11/21/2023, was the official date for these signals.
If you want to follow our strategy, you should first decide how much you want to invest based on your risk tolerance (percentage of allocation). Then, you should check my Thursday StatSheet and Saturday’s “ETFs on the Cutline” report for suitable ETFs to buy.
3. Trend Tracking Indexes (TTIs)
The ECB followed in the Bank of Canada’s footsteps and lowered its main interest rate by 0.25% as well. The major indexes traded sideways, with tomorrow’s potentially market moving jobs report lurking on deck.
Our TTIs offered a mixed picture, as the international one advanced, while the domestic one slipped slightly.
This is how we closed 06/06/2024:
Domestic TTI: +6.88% above its M/A (prior close +7.08%)—Buy signal effective 11/21/2023.
International TTI: +9.29% above its M/A (prior close +8.89%)—Buy signal effective 11/21/2023.
All linked charts above are courtesy of Bloomberg via ZeroHedge.
———————————————————-
WOULD YOU LIKE TO HAVE YOUR INVESTMENTS PROFESSIONALLY MANAGED?
Do you have the time to follow our investment plans yourself? If you are a busy professional who would like to have his portfolio managed using our methodology, please contact me directly to get more details.
Nvidia’s jump to a new record, while conquering the $3 trillion market cap, sparked bullish sentiment, at least in the Dow and S&P 500, both of which headed higher right after the opening bell. The latter scored a new all-time high late in the session, as the 10-year yield slipped to 4.29%.
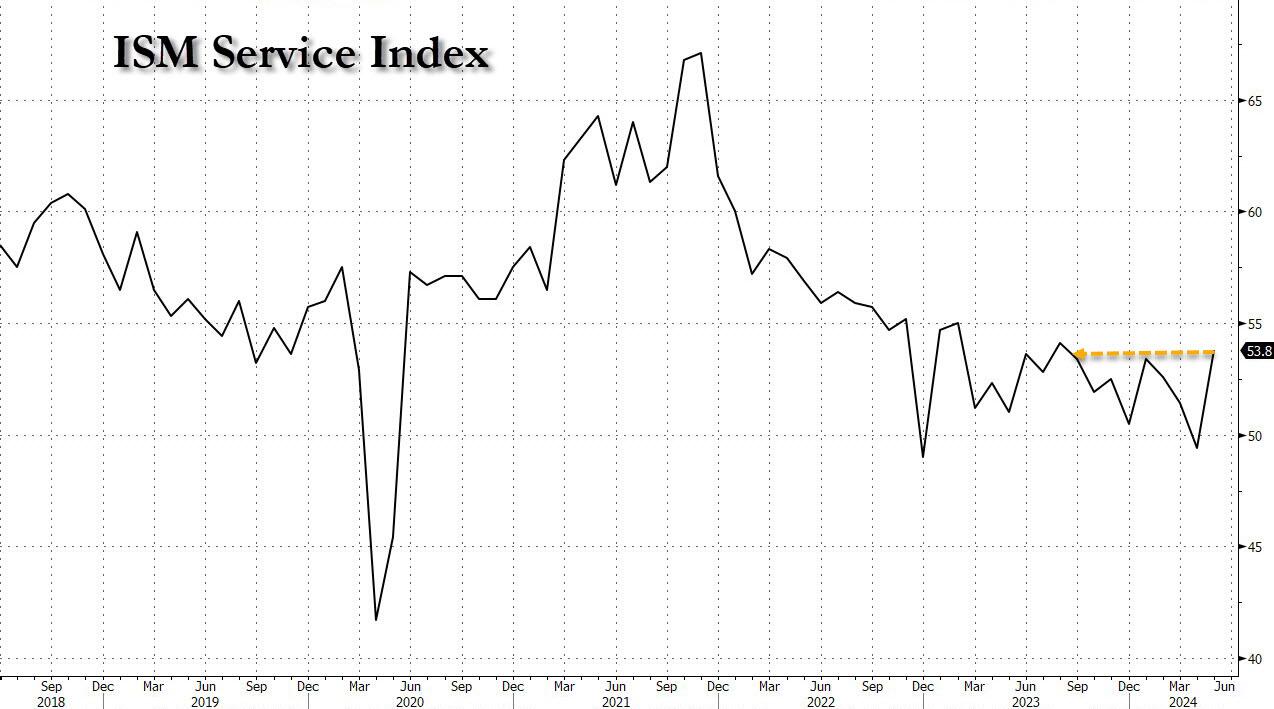
With traders looking everywhere to find new evidence that would convince the Fed to finally lower rates, weak labor market data was their next focus. ADP showed that hiring slowed to 152k jobs in May, which was far below expectations of 175k.
Offsetting those numbers were new data points from the services sector, as that area increased to 53.8, more than the expected 50.7 figure. Next up tomorrow will be weekly jobless claims and Friday’s all-important May employment report.
While the S&P and Nasdaq spurted ahead over 1%, broader gains were more moderate, as concerns remained that a weak economy could signal an unstoppable slowdown and overcome the benefits of a rate cut.
However, oethe Bank of Canada took the lead by cutting its rate for the first time in 4 years by 0.25% to 4.75%, despite a very sticky inflation rate of 2.7%. Very likely, the ECB will follow suit tomorrow. The reason is not that inflation has been licked, it’s that economies are faltering and quickly descending into recession territory—or worse.
ZH reminded us that most of the gains in equites have come from the MAG7 stocks, which are up 30% YTD. Compare that to the S&P’s 13%, while the S&P 493 is up only 6.5%. This chart demonstrates that owning the broad market was not the best choice. Ah yes, the benefit of hindsight.
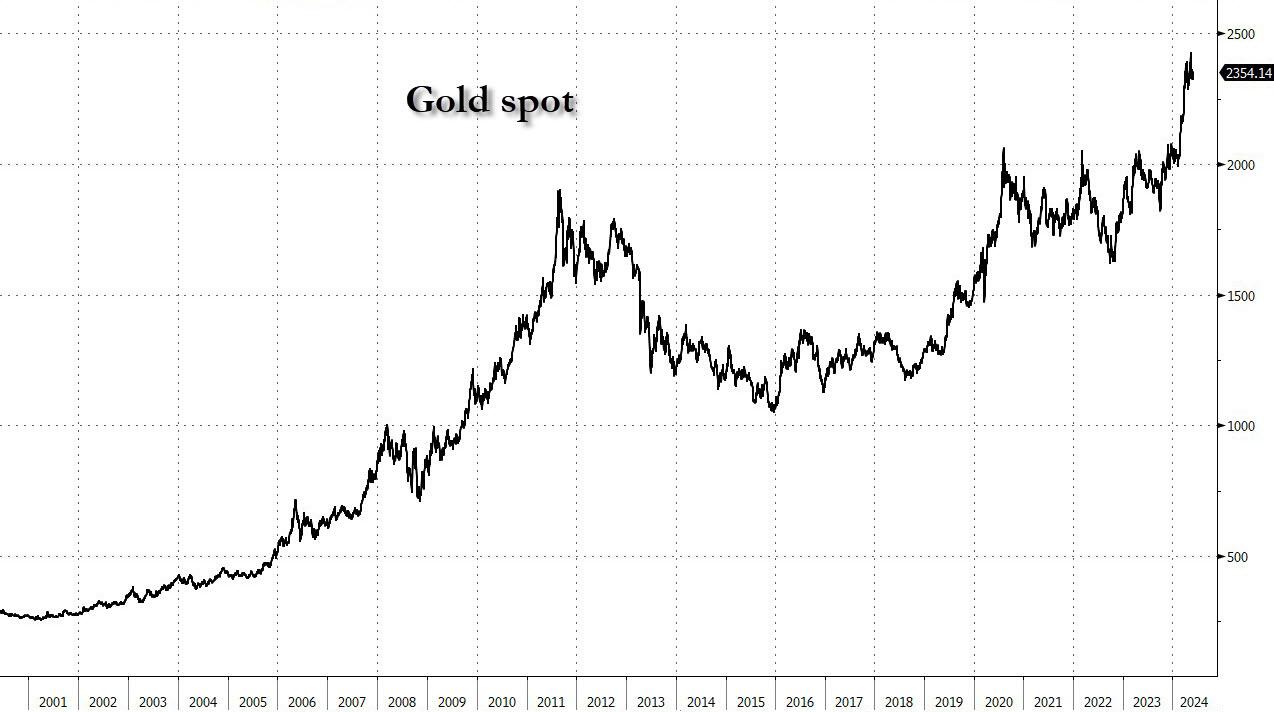
Gold, after its recent pullback, showed signs of life again and looks to be approaching its all-time highs. As is Bitcoin, which also hovers within striking distance.

