Weekly StatSheet For The ETF/No Load Fund Tracker Newsletter – Updated Through 12/29/2011

Ulli ETF StatSheet Contact

ETF/Mutual Fund Data updated through Thursday, December 29, 2011
If you are not familiar with some of the terminology used, please see the Glossary of Terms.


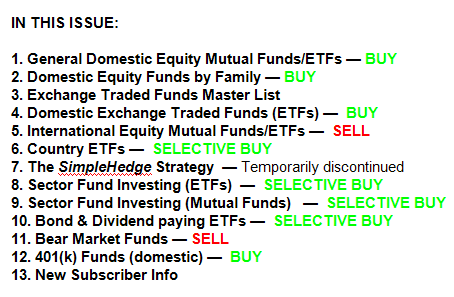
1. DOMESTIC EQUITY MUTUAL FUNDS/ETFs: BUY — since 10/25/2011
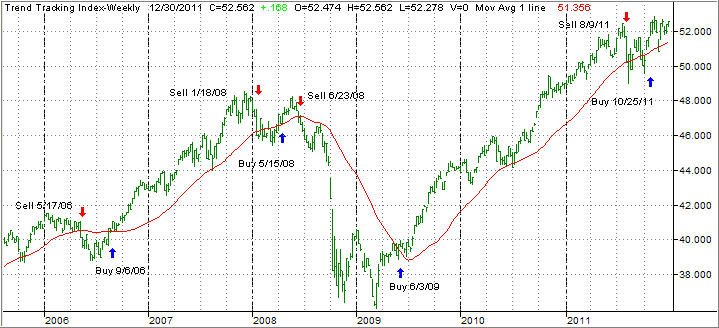
The domestic TTI broke through its long-term trend line generating a Sell for this area effective 8/9/2011. Over the recent past, we’ve seen the TTI hovering slightly below and above this dividing line between bullish and bearish territory. The clear break to the upside occurred on 10/24/11 and, effective 10/25/11, a new Buy signal for domestic equities is in effect.

As of today, our Trend Tracking Index (TTI—green line in above chart) has broken above its long term trend line (red) by +1.89%. Be sure to tune into my blog for the latest updates.
Read More

Equity ETFs Swing Up Again, But Europe’s On the Rocks

Ulli Market Review Contact

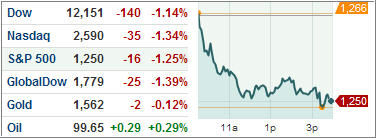
[Chart courtesy of MarketWatch.com]

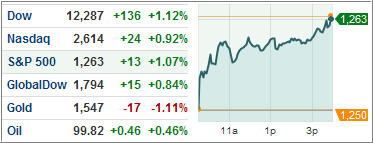
The S&P 500 rose 1.07% after yesterday’s losses despite prevalent signs of weakness in Europe.

The Euro was essentially unchanged at $1.30/Euro while the U.S. 10-year Treasury yielded 1.90%. Also, gold hit its lowest mark in 6 months as the dollar has strengthened.

In U.S. economic data, existing home sales rose in November while there was greater business activity, but jobless claims rose slightly more than expected. However, I don’t see signs of a full stage recovery yet.

There needs to be a long-term trend of housing and employment improvement before we see the economy turn around. And as of now, the emergence of any positive trend remains to be seen.

Read More

Reality Finally Sets In For Major Market ETFs

Ulli Market Review Contact

[Chart courtesy of MarketWatch.com]

All the Christmas goodies have seemed to wear off as attention once again turned to the dire state of the global economy. The S&P 500 had a decent sized drop of 1.24% while European and Asian indices also headed south.

The Euro went to a new 11-month low against the dollar, falling to $1.29/Euro. Commodities also took a hit as oil dipped below $100 and gold crossed under the $1,600 mark.

Just when it looked like risk was withering away, the 10-year Treasury yield sank, ending at 1.91%. Meanwhile, the Volatility Index rose 7.30%, indicating that more volatility might be headed our way. It looks like negative 2012 expectations are finally setting in.

Read More

7 ETF Model Portfolios You Can Use – Updated through 12/27/2011

Ulli Model ETF Portfolios Contact

This is the last ETF Model Portfolio report for 2011. I will rebalance as necessary effective 12/30/11 and will determine the exact allocation next weekend.

While the past week sported an upswing in the markets, it barely got the S&P 500 to the breakeven point for the ear. In the end, 2011 did nothing to help your portfolios grow as continued global uncertainties unleashed a wildly swinging market, which ended up returning to the unchanged line.

Our sell stops were only of limited value, as a sharp correction did not occur even though it appeared to be a distinct possibility on several occasions. Of course, Europe’s expert can kickers managed to avoid disaster by coming up with more ingenious ways to delay the inevitable.

Even though I will rebalance the ETF Model Portfolios, I do not recommend starting the year 2012 with fully invested positions as none of what ails Europe has been resolved and may come back to haunt the markets.

On the other hand, the major indexes may hang their hat on the fact that domestically we’re better off right now than the rest of the world with the result that upward momentum may continue. Personally, I believe it’s a better call to only conservatively participate in any upward swings as the ongoing downside risks should not be underestimated.

Take a look at the latest update:

Read More

Post-Xmas Coma Leads To ETF Inactivity

Ulli Market Review Contact

[Chart courtesy of MarketWatch.com]

In a relatively low volume day, market action was more or less at a minimum. The S&P 500 was essentially flat, bumping up a smidge of 0.01%. The Euro against the dollar is $1.31/Euro and the 10-year Treasury dropped to 2.01%. In commodities, gold is still off its high sitting just above $1,600 while oil broke above $100.

A sign of fear in the European banking system, banks deposited over $535 billion with the ECB, a record amount. Despite efforts by the ECB to boost liquidity and spur lending, many financial institutions still view lending as much riskier than camping their money with the ECB.

Not only will this hurt the credit market, but businesses of all sizes will feel the hurt as well. Although Europe is reaching deep into its toolbox, finding the right tool to solve its financial woes is becoming increasingly difficult.

Read More

ETFs/Mutual Funds On The Cutline – Updated Through 12/23/2011

Ulli ETFs on the Cutline Contact

Below are the latest ETF Cutline reports, which show how far above or below their respective long-term trend lines (39 week SMA) my currently tracked ETFs/MFs are positioned.

The first report covers the ETF Master List from Thursday’s StatSheet and includes 398 ETFs, of which currently 107 (last week 48) of them are hovering in bullish territory.

The second report includes only High Volume ETFs. To clarify, High Volume (HV) ETFs are defined as those with an average daily volume of $10 million or higher.

These ETFs are generated from my selected list of some 93 that I use in my advisor practice. It cuts out the “noise,” which simply means it eliminates those ETFs that I would never buy because of their volume limitations. Only 16 ETFs (last week 8 ) have managed to hang on in bullish territory after the recent volatility.

The third report covers Mutual Funds on the Cutline. There are currently 176 (last week 37) above the line and 685 below it out of the 861 that I follow.

Take a look:

1. ETF Master Cutline Report

2. ETF High Volume Cutline Report

3. MF Cutline Report