Reader Joao has been watching our Trend Tracking Indexes (TTIs) for some time now and had this to say:
I am observing your TTIs very carefully, and plan to take action when you recommend.
I have a question however on the slope of the TTI: how relevant is this slope (as compared, for instance, to a 200 day moving average)? Looking at the US domestic TTI, the slope is now tending downwards for the first time in several years (since 2003).
Would this signify a down trending (bear) market, and therefore, should one not take “shorts” in tune with the falling market rather than go long when the index line goes above the TTI line? I am saying this on the assumption that you’d concur with the strategy of investing “with the trend” … and if the trend is sloping down, then why go long?
On this assumption, when the TTI gave the latest sell signal on June 23, shorting the S&P; (for instance) would have probably been a profitable venture and would have been “investing with the trend”.
Same comment would apply to the international TTI, which has had a downward sloping TTI line for the whole of 2008 … if we take a long position when the composite index (the green line) goes above the TTI, would this not be a sort of “fool’s rally” in a bear market trend?… until the TTI line has at least flattened out, one should not take a long position … is my interpretation incorrect?
Thanks for your insights; I am trying to get a better understanding of your proprietary TTI system.
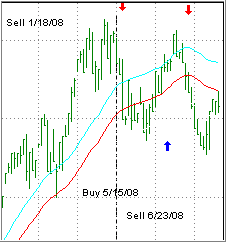
Let’s take a look at a blown up portion of the domestic TTI to better understand what Joao is saying:
Since our Sell signal on 6/23/08, the trend line (red) has been in fact sloping down confirming that we are indeed in a bear market. As you can also see, prices (green bars) have been on the rebound and may very well break through the trend line to upside into neutral territory. I define the neutral territory as an area between the long-term trend line (red) and a point, which is 1.5% above it (blue). Once prices pierce the blue line, a new domestic buy signal is generated.
To answer Joao’s question, I have to say that in the past 20 years I have not found that a buy signal generated via the piercing of a falling trend line vs. the piercing of a rising trend line has shown any different results.
Sure, a falling trend line would support a bearish viewpoint; however, you still need to apply caution when entering short positions. Why? Bear market rallies are a powerful counterforce to be reckoned with. If you had any short positions initiated based on our last Sell signal, you most certainly would have been stopped out had you worked with a sell stop (which is a must).
Looking at the big picture, I suggest you review my post “Is Short Selling Worth It,” which makes the argument based on a lot of research that, in the long run, short selling may not add as much to your bottom line profits as you think.

Comments 1
Many thanks. Also the write up on short selling is great.