Our International Trend Tracking Index (TTI) signaled a buy on 5/11/09, which was followed by the Domestic TTI’s move into buy mode effective 6/3/09.
As is often the case, just because long-term trend lines are crossed to the upside, it does not mean all is smooth sailing from there. The markets had a 4-week sell off before resuming their respective up trends. Many sell stops were triggered as the major indexes retreated and then recovered.
Yes, that constitutes a whip-saw signal, which is the price we pay from time to time in order not to go down with the masses when the markets head south. It appears that, at least for the time being, the uptrend is back intact. With that comes the potential decision as to whether you want to jump back in or simply keep those positions that were not affected by the sell stop.
There is no right or wrong, it simply depends on your personal preference along with your risk tolerance. I added some positions earlier in the week by selecting funds/ETFs that have held up well during the recent sell off.
How?
Now that I have the benefit of hindsight, I went back to the beginning of the domestic Buy cycle date and analyzed which funds/ETFs were not affected by the recent pullback. The tool I use is my own indicator, which is referred to in the StatSheet Glossary of Terms as MaxDD% (Maximum DrawDown percentage)
Here’s the definition:
If you were to go the beginning of a buy cycle and measure DD% (shown in the StatSheet table) for a given fund every trading day, and then select the worst (largest) DrawDown number, you would have the information that I call MaxDD% (Maximum DrawDown Percentage).
This allows me to look back at anytime and see which funds have held up best and never hit our 7% sell stop. Those are the ones with a low MaxDD% (low volatility) number and may be among my primary selections for the next Buy cycle.
To be clear, this does not guarantee that, during the next downturn, these funds will not trigger their sell stops. However, I believe that my chances are enhanced, by using funds with a little less volatility, to possibly avoid another whipsaw.
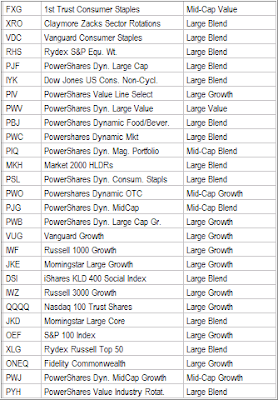
The list below features those domestic ETFs, whose sell stop point of 7% never got triggered during the recent market downturn:
In the following table, I have mixed in mutual funds and ETFs with a MaxDD% of less than 7% since 6/3/09:
As I have noticed in the past, and recent market behavior confirmed this again, there are far more mutual funds than ETFs that that have better resisted market corrections such as the last one. My guess is that sometimes active management does pay off.

Comments 2
Ulli,
Is there software available for calculating Maximum Drawdown?
Thanks
Starbright,
No, not that I know of. I am not even sure if anyone uses this indicator.
Ulli…