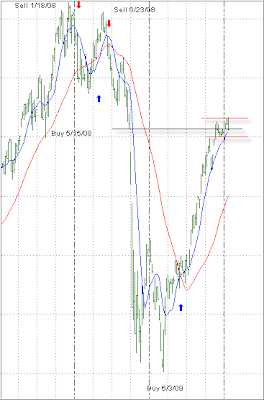
On December 9, 2009, I posted in “Tough Overhead Resistance” that the TTI had closed the 2 exhaustion gaps made in 2008. This coincided with continued resistance of the 1,100 level of the S&P; 500. Here’s the TTI chart I posted back then:
While the S&P; 500 has pierced the 1,100 mark, that level still appears to be a tough one to overcome as continued selling has met break out attempts. Here’s the updated TTI chart:
As you can see, prices have been bouncing around the black line (closing of the gap) in a sideways pattern (between the parallel red lines). All sideways patterns will come to an end sooner or later and a breakout will occur. The longer this pattern continues, the more severe the breakout will be.
The unknown is the direction of the breakout. We could easily head back into bear market territory or move towards the highs of last year. My guess is as good as anybody else’s, but if I had to make a choice, I believe the odds of a move to the downside have increased sharply.
This is why I keep pounding on the same theme over and over that you need to have your exit strategy in place should the downside be the direction the market decides to take.

Comments 1
I had to get out of several positions on Friday already. EWP, EWZ, FXI stopped out at 10% from when I bought. It's more fun watching new highs, but it does feel good having an exit strategy.