
[Chart courtesy of MarketWatch.com]
- Moving the market
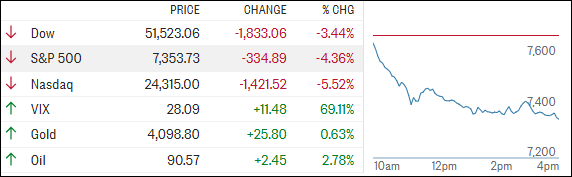
What a difference a day makes. Yesterday’s euphoric rally turned into today’s sharp reality check, with the major indexes giving back gains in a hurry.
The Nasdaq led the retreat as traders continued rotating out of technology and AI-related names and into the relative safety of consumer staples, utilities, and energy.
The AI trade took it on the chin for a second straight session. Nvidia and Broadcom both dropped 9%, Oracle joined the slide, and Qualcomm’s earnings beat was overshadowed by cautious guidance, sending the stock down 13%.
The semiconductor space was hit especially hard, with the SOXX ETF tumbling 11%. Even Tesla, SpaceX, and Nvidia found themselves in double-digit or near double-digit decline territory, proving that market favorites can fall out of fashion just as quickly as last year’s meme stocks.
Away from technology, there were a few signs of resilience. Energy held up well as crude oil reversed course and climbed back above $90 a barrel, while consumer staples and utilities attracted defensive money.
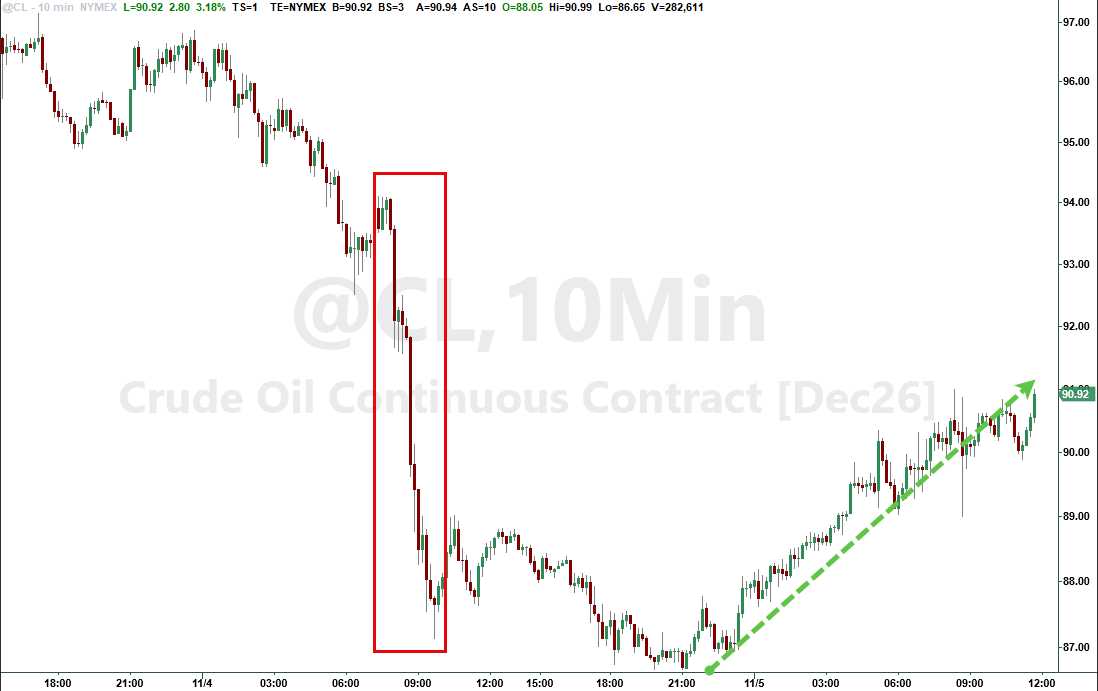
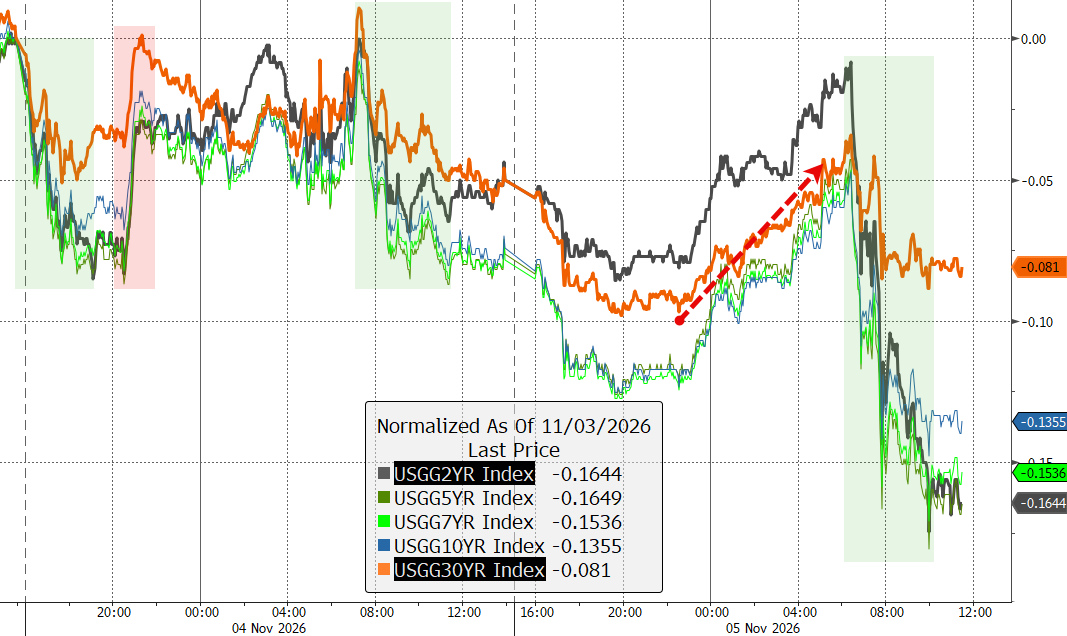
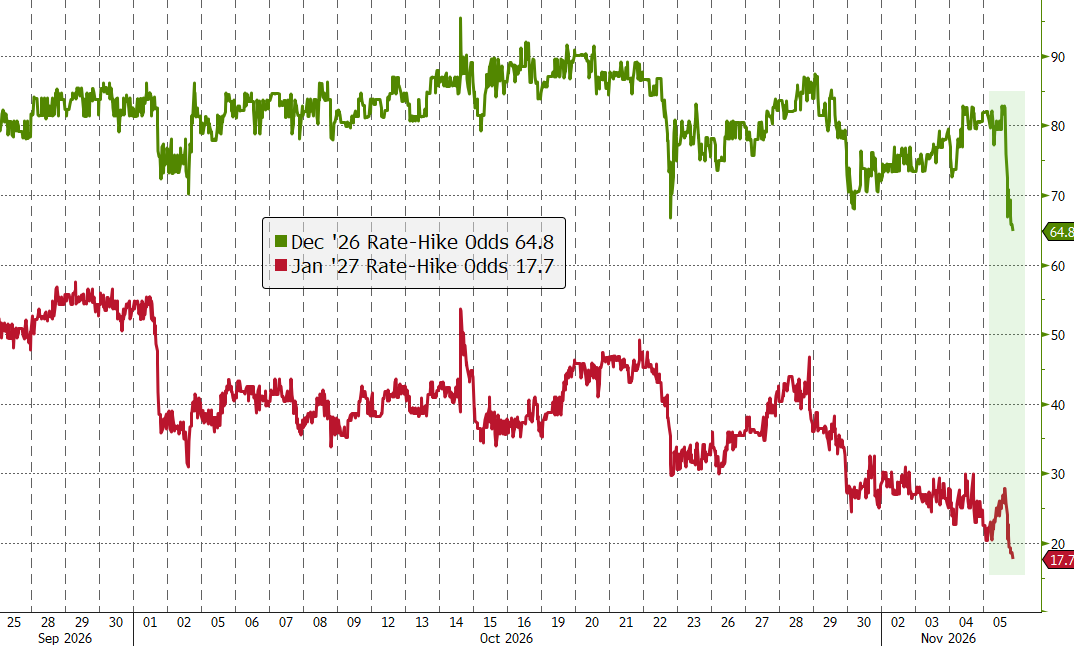
Bond yields moved lower, rate-hike expectations eased, gold caught a bid, and Bitcoin apparently decided it preferred yesterday more than today.
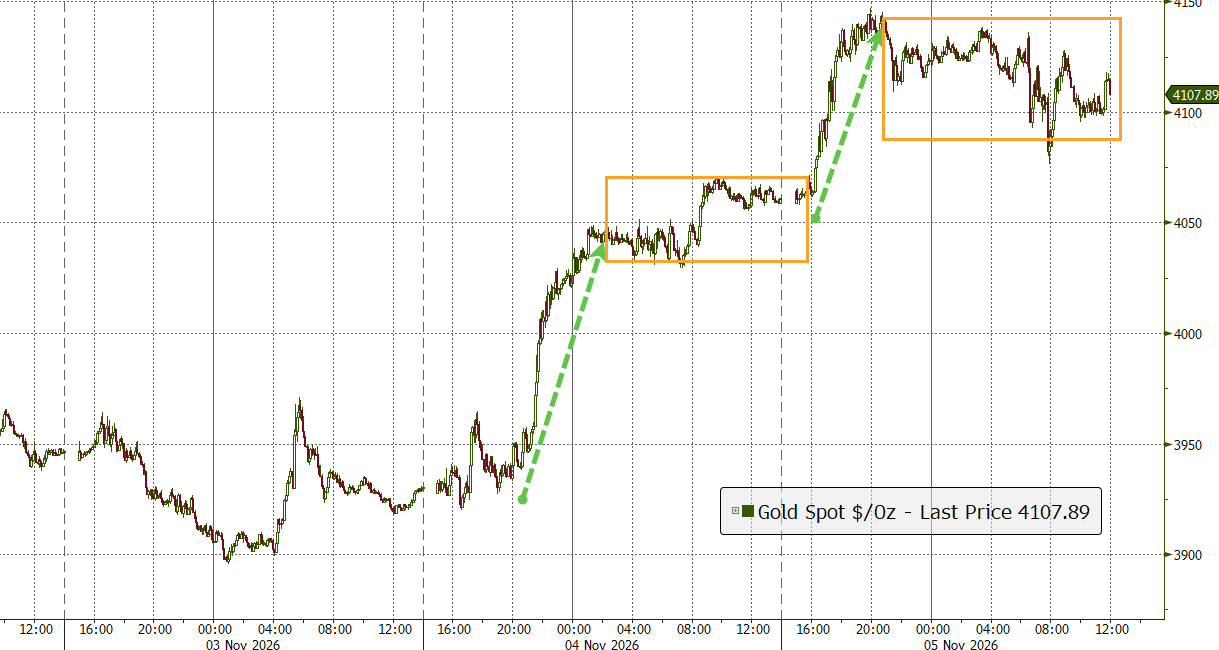
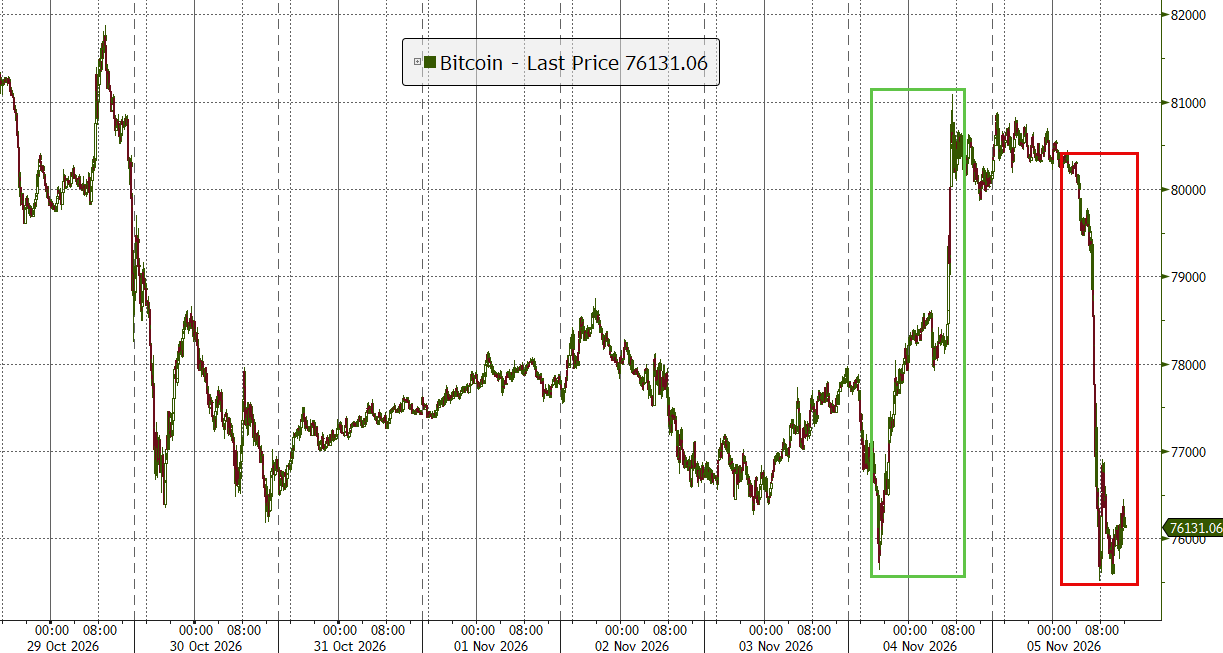
Yesterday traders couldn’t click the buy button fast enough. Today they seemed reluctant to click much of anything.
The market’s message was clear: leadership is shifting, and investors are reassessing risk.
The only question now is whether this is a healthy rotation or the start of something bigger, so where could the next leadership group emerge from?
2. Current domestic “Buy” Cycle (effective 5/20/2025); International “Buy” Cycle (effective 5/8/25)
Our domestic bullish cycle that began on November 21, 2023, concluded on April 3, 2025, following a market downturn triggered by President Trump’s tariff policy announcement.
This development caused significant declines across major indexes and broader market indices. However, markets subsequently rebounded, culminating in a new domestic “Buy” signal taking effect May 20, 2025.
Concurrently, our International Trend Tracking Index (TTI) experienced parallel volatility. On April 4, 2025, it breached critical thresholds, prompting a “Sell” recommendation. This position reversed as global markets recovered, with the International TTI regaining sufficient momentum to issue a new “Buy” signal effective May 8, 2025.
3. Trend Tracking Indexes (TTIs)
The market came in wearing yesterday’s gains like a rental tux and returned them before lunch.
Sellers stayed in control all day, pushing the major indexes lower, while the usual dip buyers were nowhere to be found.
One bright spot was gold, which managed to finish in the green despite giving back some of its intraday pop.
Our TTIs weren’t immune to the selling, but they held up noticeably better than the broader market, which is exactly what you like to see when Mr. Market is having one of his grumpy days.
This is how we closed 11/05/2026:
Domestic TTI: +4.72% above its M/A (prior close +7.98%)—Buy signal effective 5/20/25.
International TTI: +3.14% above its M/A (prior close +4.93%)—Buy signal effective 5/8/25.
All linked charts above are courtesy of Bloomberg via ZeroHedge.
———————————————————-
WOULD YOU LIKE TO HAVE YOUR INVESTMENTS PROFESSIONALLY MANAGED?
Do you have the time to follow our investment plans yourself? If you are a busy professional who would like to have his portfolio managed using our methodology, please contact me directly to get more details.
Contact Ulli