
[Chart courtesy of MarketWatch.com]
- Moving the market
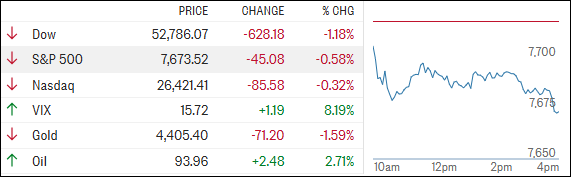
Stocks came out of the gate on the wrong foot and never really found their balance, as traders spent the day weighing escalating Middle East tensions against this week’s all-important inflation reports.
Rising oil prices stole the spotlight, with crude extending its rally and reminding everyone that inflation may not be quite finished with us yet.
That puts Thursday’s PPI and Friday’s CPI reports squarely in focus. A hotter-than-expected CPI number could complicate the Fed’s path and reignite rate hike concerns, which is exactly what traders seem to be pricing for at the moment.
Adding to the list of worries, fresh trade tensions between the U.S. and Canada didn’t do sentiment any favors.
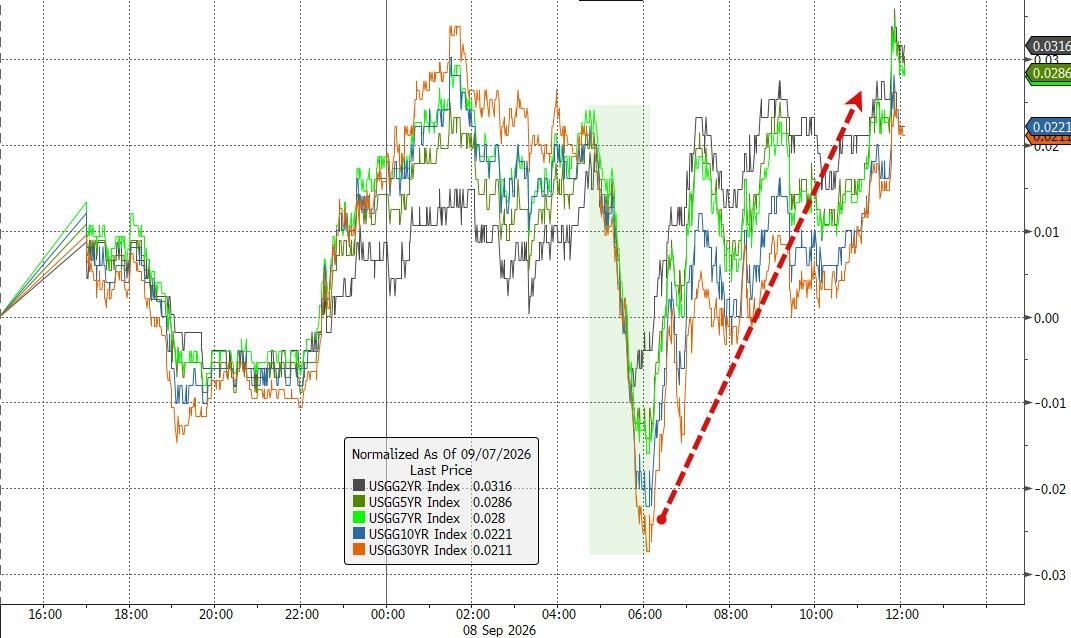
By the closing bell, stocks were firmly in the red as higher oil prices and rising bond yields kept pressure on risk assets.
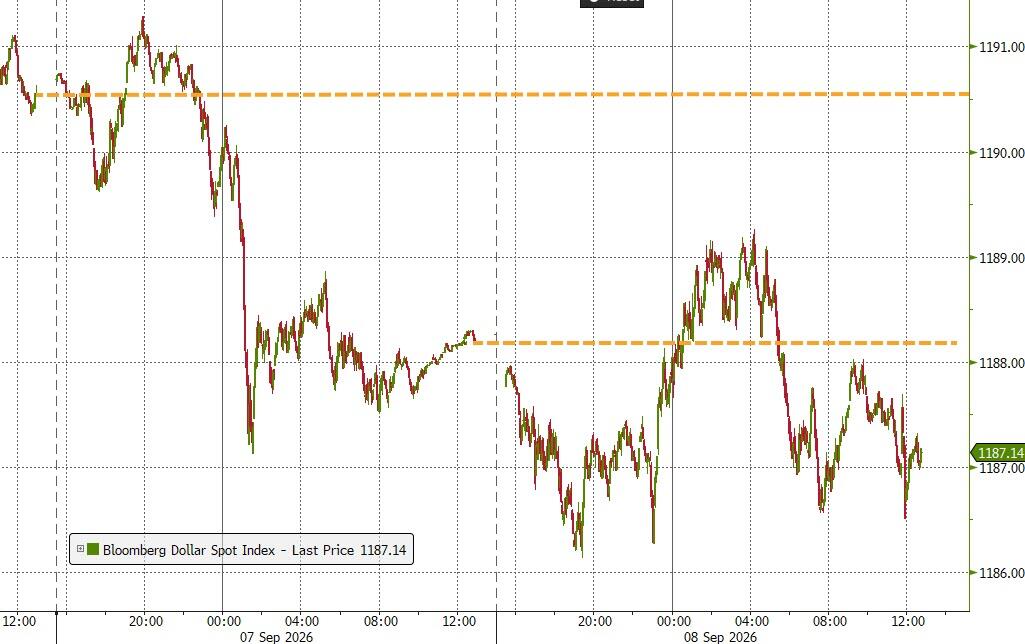
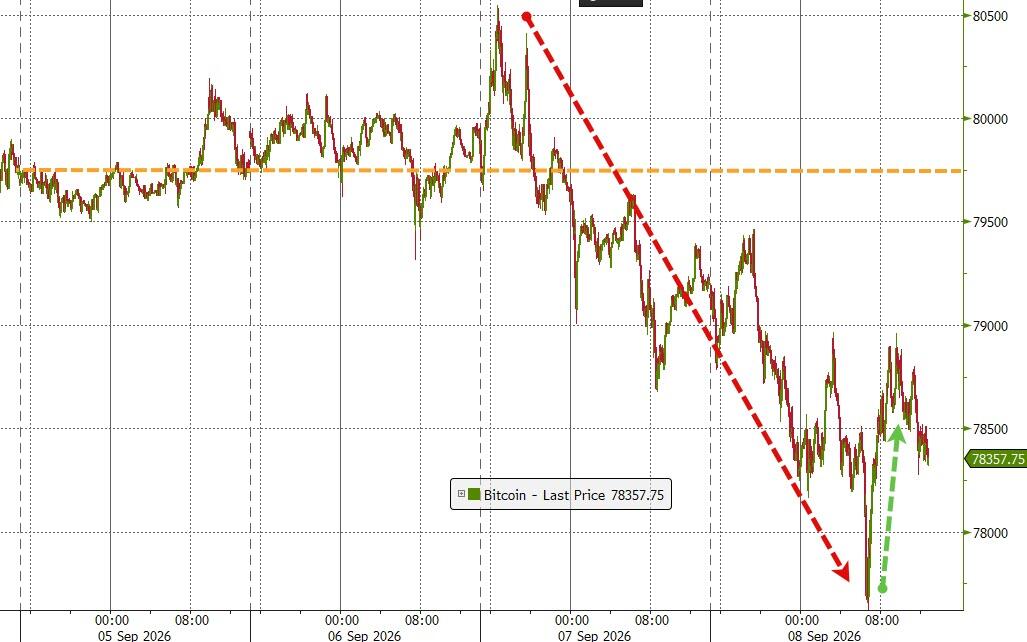
The dollar drifted modestly lower, while bitcoin took investors on its usual roller-coaster ride before finishing below Friday’s close.
It was one of those sessions where caution was in demand and optimism felt a little overpriced.
The big question now: will inflation data calm investors’ nerves, or have the bears finally regained control of the narrative?
2. Current domestic “Buy” Cycle (effective 5/20/2025); International “Buy” Cycle (effective 5/8/25)
Our domestic bullish cycle that began on November 21, 2023, concluded on April 3, 2025, following a market downturn triggered by President Trump’s tariff policy announcement.
This development caused significant declines across major indexes and broader market indices. However, markets subsequently rebounded, culminating in a new domestic “Buy” signal taking effect May 20, 2025.
Concurrently, our International Trend Tracking Index (TTI) experienced parallel volatility. On April 4, 2025, it breached critical thresholds, prompting a “Sell” recommendation. This position reversed as global markets recovered, with the International TTI regaining sufficient momentum to issue a new “Buy” signal effective May 8, 2025.
3. Trend Tracking Indexes (TTIs)
The bears had the wheel from the opening bell to the close as escalating tensions in the Middle East kept traders in a risk-off mood.
Stocks spent the day in retreat, and there was hardly anywhere to hide as metals and bitcoin joined the slide. Copper, however, didn’t get the memo, bucking the trend with a respectable gain.
Our TTIs weren’t spared either, with both moving lower. The domestic model took the bigger hit, while the international side showed a bit more resilience.
Not exactly the kind of diversification lesson we’d put in a brochure, but that’s how markets like to keep us humble.
This is how we closed 09/08/2026:
Domestic TTI: +6.33% above its M/A (prior close +7.44%)—Buy signal effective 5/20/25.
International TTI: +6.99% above its M/A (prior close +7.12%)—Buy signal effective 5/8/25.
All linked charts above are courtesy of Bloomberg via ZeroHedge.
———————————————————-
WOULD YOU LIKE TO HAVE YOUR INVESTMENTS PROFESSIONALLY MANAGED?
Do you have the time to follow our investment plans yourself? If you are a busy professional who would like to have his portfolio managed using our methodology, please contact me directly to get more details.
Contact Ulli