
- Moving the market
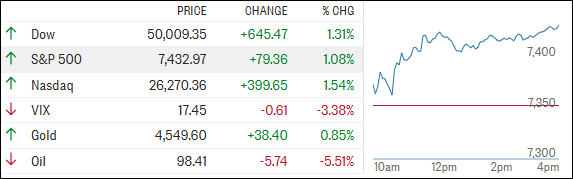
Stocks got off to a solid start, with the major indexes moving higher early on, helped in part by a pullback in oil prices.
Traders were also positioning ahead of Nvidia’s earnings report after the close—a key event for the AI trade and overall chip demand. Nvidia shares were already edging higher ahead of the release, showing how much attention this name still commands.
It makes sense, too. One analyst noted that Nvidia alone has driven roughly 20% of the S&P 500’s gains this year—and nearly as much of its projected earnings growth—so whatever comes out of that report has the potential to move the entire market.
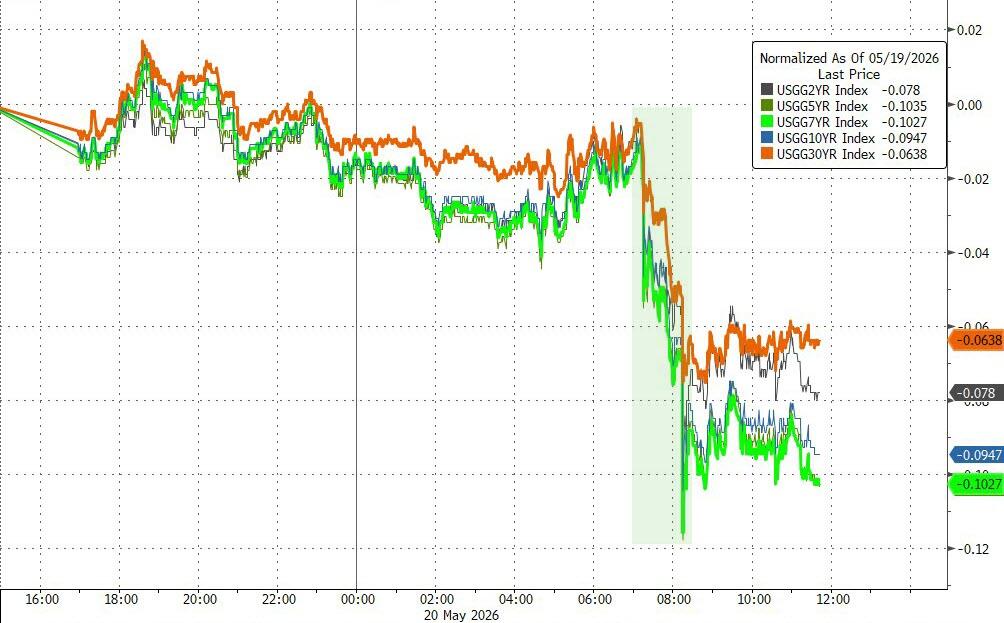
That’s especially important given the recent backdrop. Rising bond yields had pressured stocks over the last few sessions, with the S&P 500 and Nasdaq logging three straight declines.
The 30‑year yield even briefly topped 5.19%, its highest level in nearly 19 years, as inflation worries and uncertainty around the U.S.–Iran situation kept investors on edge.
But today, the tone flipped. Yields backed off sharply, oil prices dropped, and markets caught a strong bid after comments from Trump suggesting the U.S. may be in the “final stages” of negotiations with Iran.
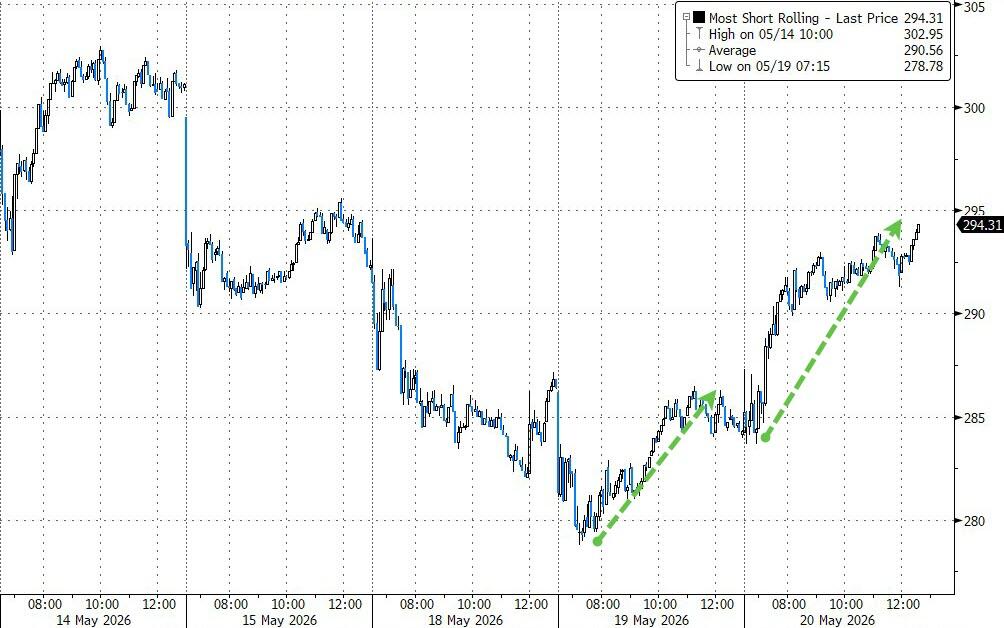
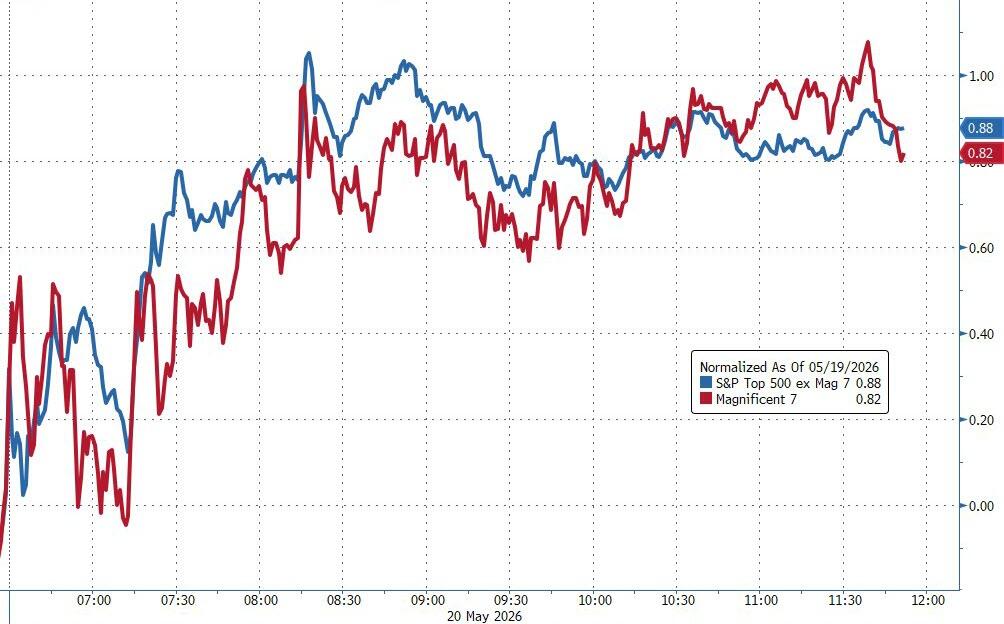
Small caps led the charge, staging an impressive 2.5% rebound as yesterday’s short squeeze carried over. This time, though, the rally had better participation, with both the Magnificent 7 and the broader S&P 493 moving higher together.
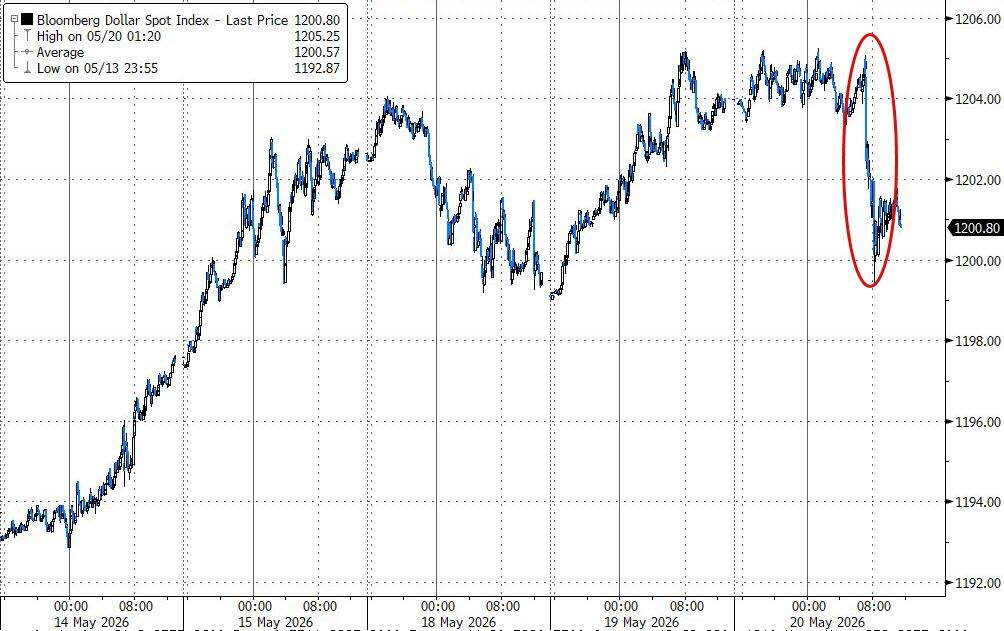
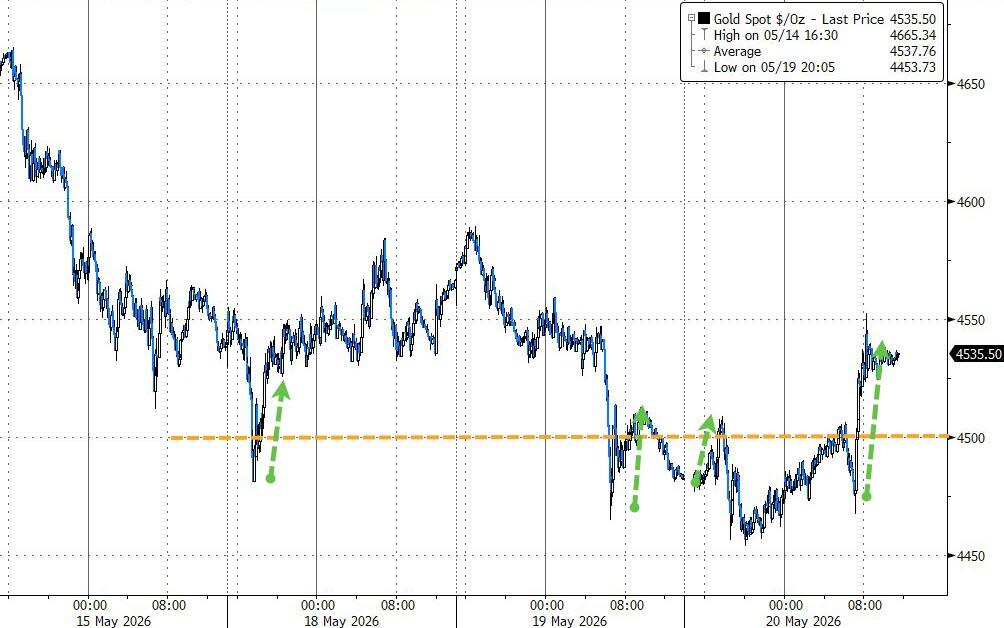
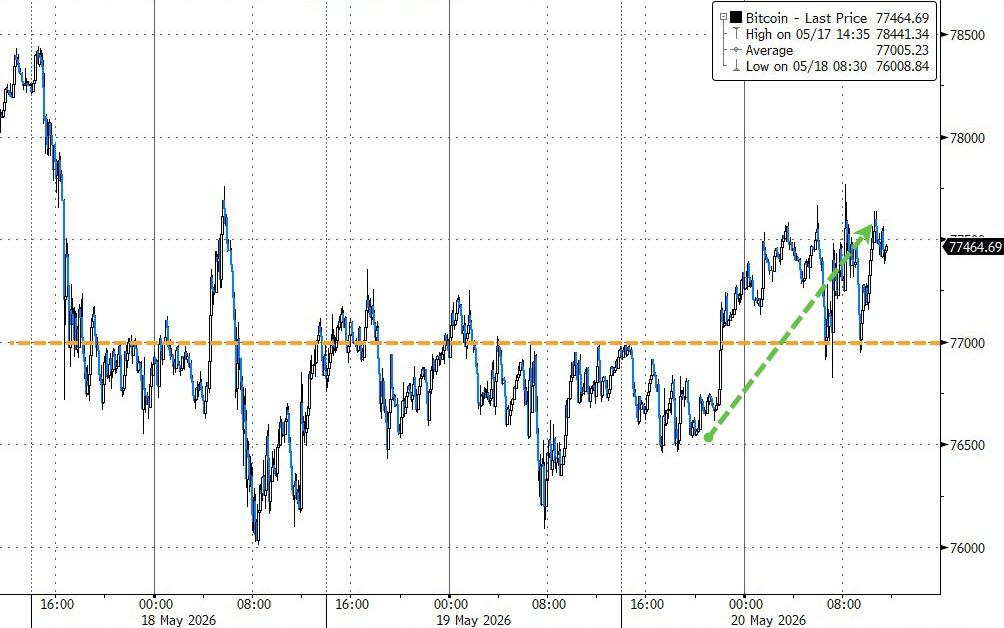
The dollar took a hit on the day, which gave gold a lift back above $4,500. Bitcoin followed the risk-on mood as well, tracking big tech and pushing back above $77,500.
All told, markets seem to be climbing that familiar “wall of worry”—balancing strong economic data, shifting rate expectations, and ongoing geopolitical uncertainty.
But with so many moving parts, the big question remains: how long can this rally hold together before the next curveball hits?
2. Current domestic “Buy” Cycle (effective 5/20/2025); International “Buy” Cycle (effective 5/8/25)
Our domestic bullish cycle that began on November 21, 2023, concluded on April 3, 2025, following a market downturn triggered by President Trump’s tariff policy announcement.
This development caused significant declines across major indexes and broader market indices. However, markets subsequently rebounded, culminating in a new domestic “Buy” signal taking effect May 20, 2025.
Concurrently, our International Trend Tracking Index (TTI) experienced parallel volatility. On April 4, 2025, it breached critical thresholds, prompting a “Sell” recommendation. This position reversed as global markets recovered, with the International TTI regaining sufficient momentum to issue a new “Buy” signal effective May 8, 2025.
3. Trend Tracking Indexes (TTIs)
The bulls took control right out of the gate and never looked back, driving stocks steadily higher throughout the session.
It was a strong day across the board, with most sectors finishing comfortably in the green.
Metals were fully in on the move as well, joining the rally instead of lagging.
Our TTIs also participated nicely, pushing higher and widening the gap between their current levels and their underlying trend lines—a solid sign of continued upward momentum.
This is how we closed 05/20/2026:
Domestic TTI: +5.53% above its M/A (prior close +4.39%)—Buy signal effective 5/20/25.
International TTI: +9.34% above its M/A (prior close +8.36%)—Buy signal effective 5/8/25.
All linked charts above are courtesy of Bloomberg via ZeroHedge.
———————————————————-
WOULD YOU LIKE TO HAVE YOUR INVESTMENTS PROFESSIONALLY MANAGED?
Do you have the time to follow our investment plans yourself? If you are a busy professional who would like to have his portfolio managed using our methodology, please contact me directly to get more details.
Contact Ulli