
- Moving the market
The major indexes dipped into the red early as simmering U.S.-Iran tensions and a mixed reaction to Walmart’s results kept traders on edge.
Even though Walmart shares rose about 2% after beating Q4 expectations, its full-year earnings outlook came in disappointingly light, which weighed on sentiment.
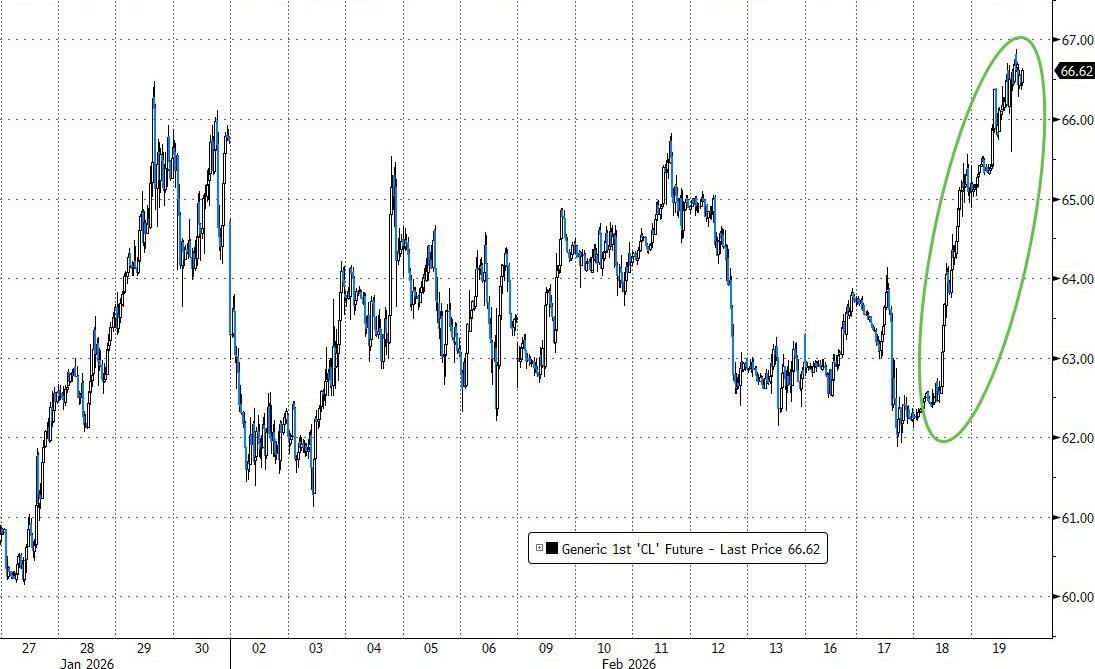
Oil prices climbed back above $66 amid the Iran standoff over its nuclear program, adding a little more caution.
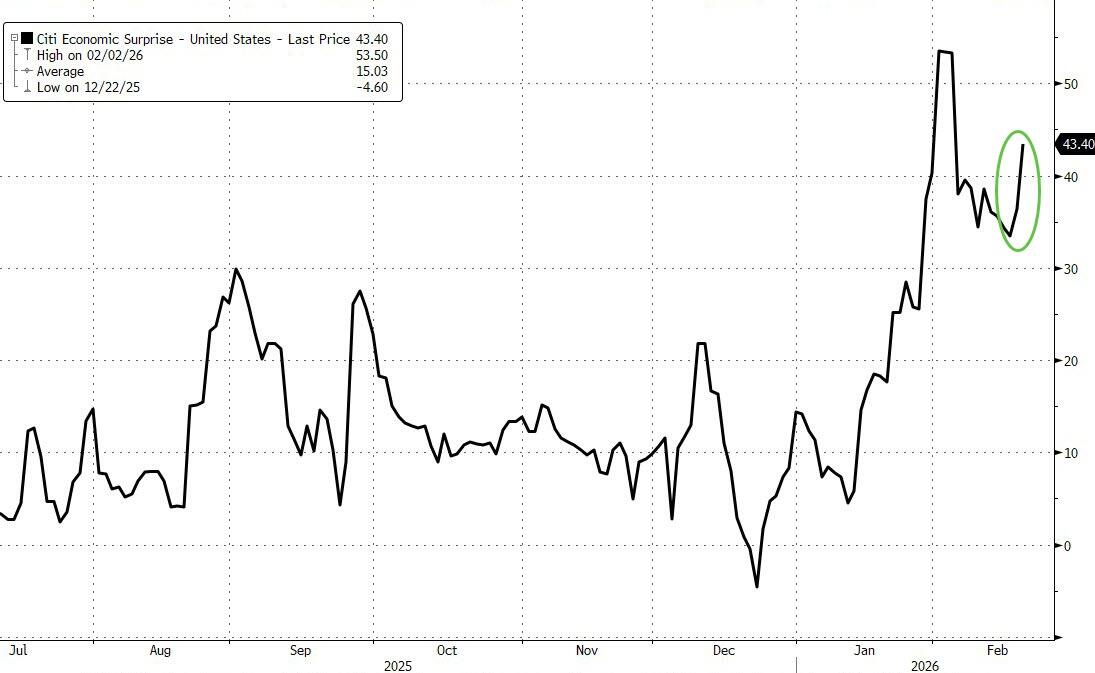
Wall Street was coming off a strong winning session yesterday (thanks to Mag 7 strength, financials, and energy), but today the macro picture was a bit of a mixed bag—good jobless claims, weak housing, and a big trade deficit.
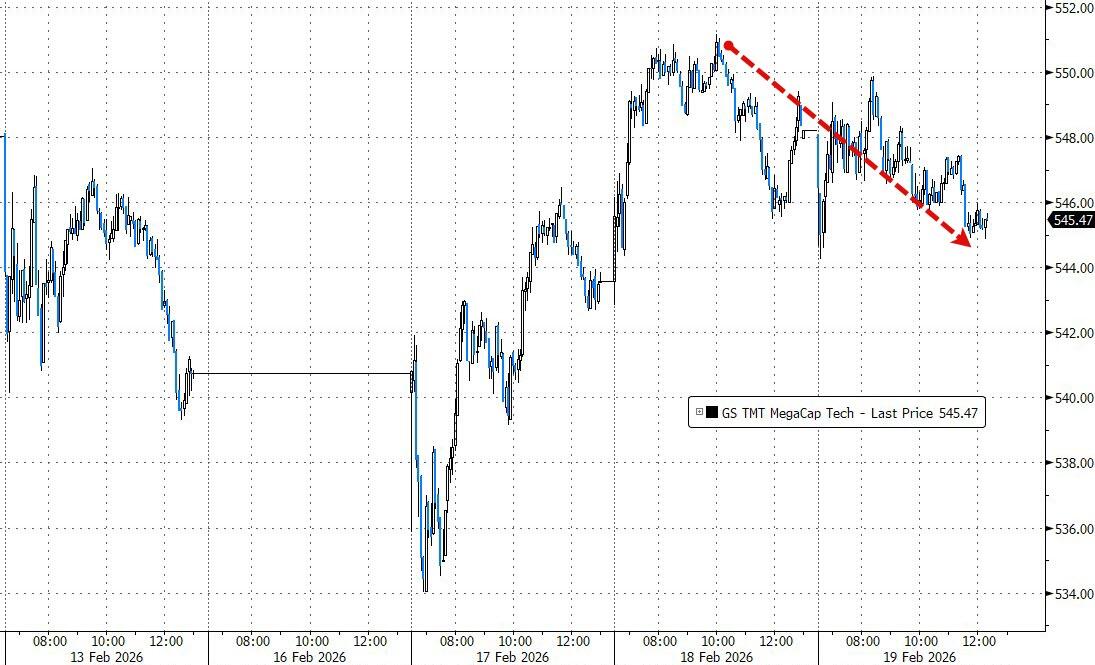
Overall, U.S. data outperformed expectations, yet equities still lagged. The Dow led the downside, and mega-cap tech kept sliding along with it.
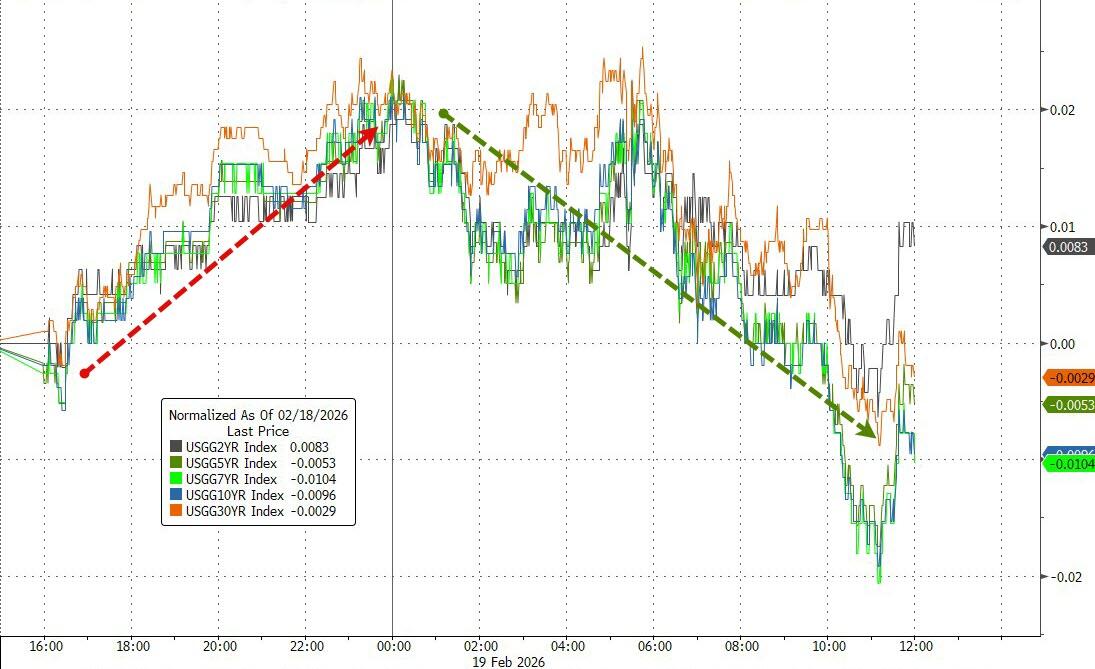
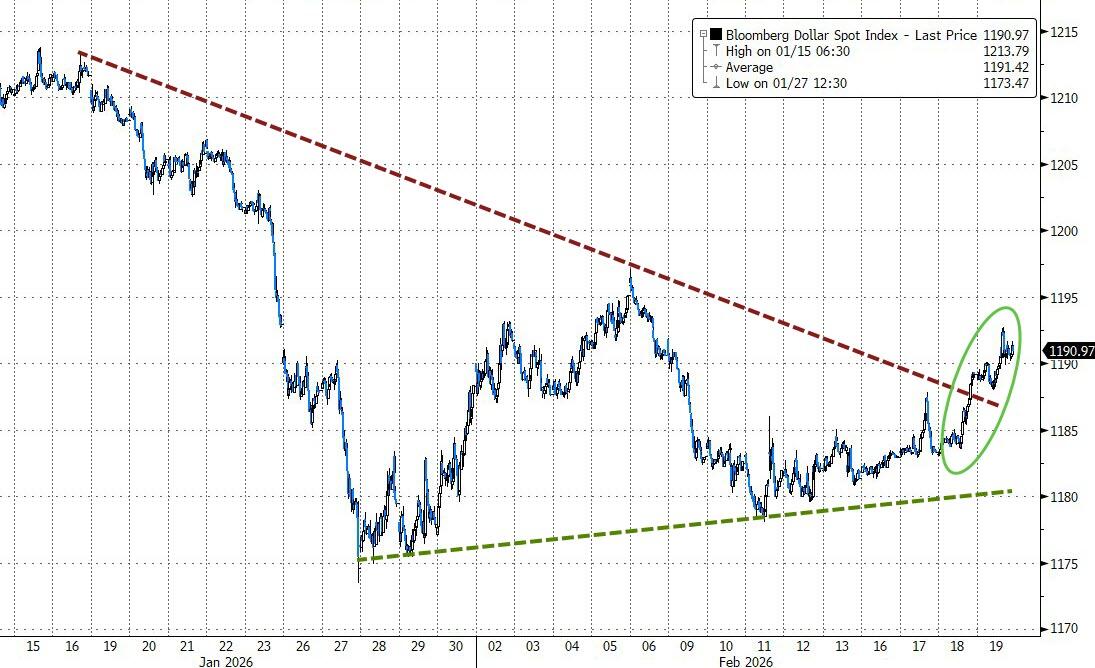
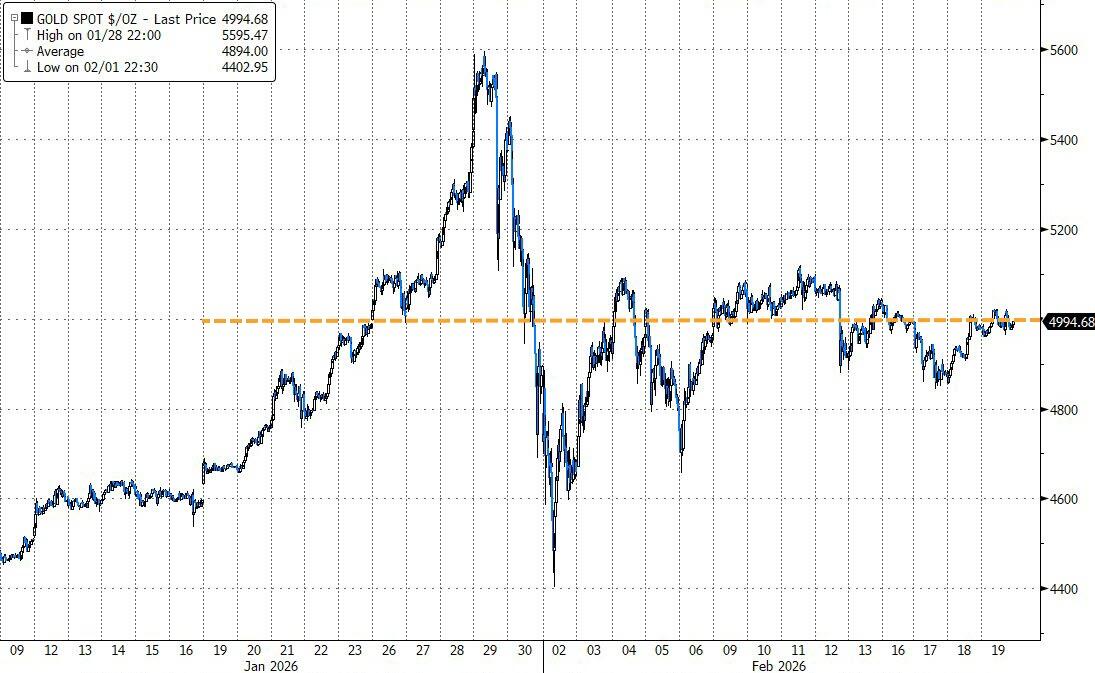
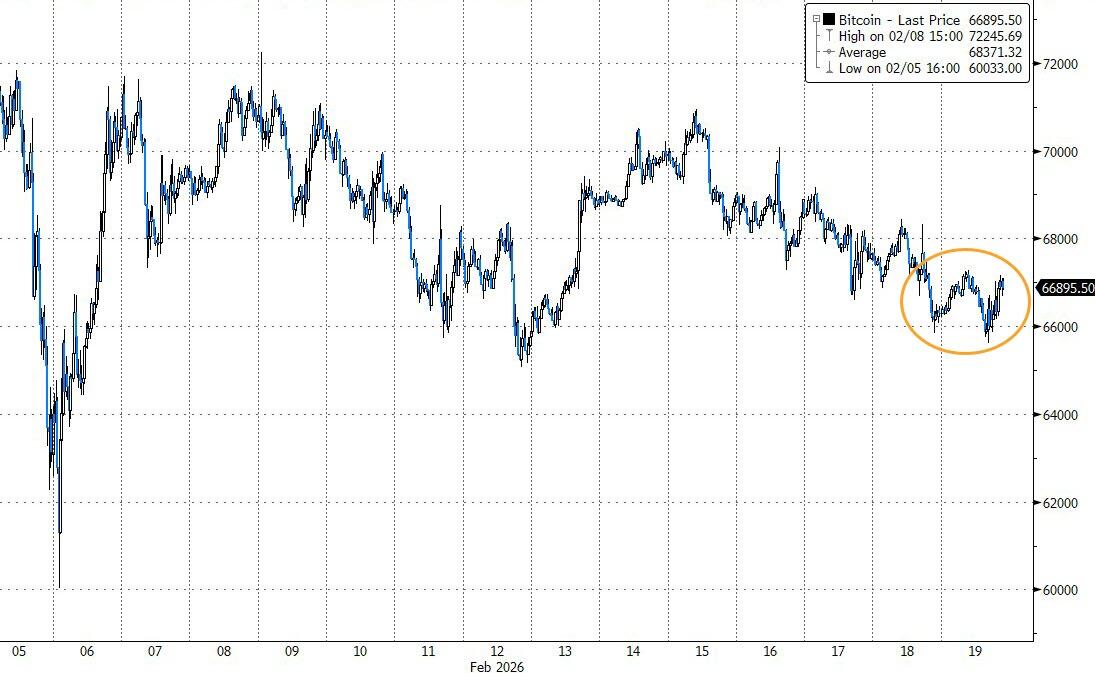
Bond yields eased back, the dollar extended its gains, but precious metals shrugged it off: gold climbed back above $5,000, silver picked up a modest gain, and Bitcoin clawed its way above $67k for a decent advance.
Traders are now locked in on tomorrow’s data barrage—Q4 GDP, personal income & spending, new home sales, and more. Some of these could definitely move the needle.
2. Current domestic “Buy” Cycle (effective 5/20/2025); International “Buy” Cycle (effective 5/8/25)
Our domestic bullish cycle that began on November 21, 2023, concluded on April 3, 2025, following a market downturn triggered by President Trump’s tariff policy announcement.
This development caused significant declines across major indexes and broader market indices. However, markets subsequently rebounded, culminating in a new domestic “Buy” signal taking effect May 20, 2025.
Concurrently, our International Trend Tracking Index (TTI) experienced parallel volatility. On April 4, 2025, it breached critical thresholds, prompting a “Sell” recommendation. This position reversed as global markets recovered, with the International TTI regaining sufficient momentum to issue a new “Buy” signal effective May 8, 2025.
3. Trend Tracking Indexes (TTIs)
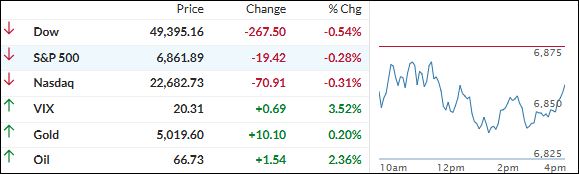
The Dow led the downside, while the S&P 500 and Nasdaq also closed in the red with moderate losses.
Tech names were mixed, but the broader market felt the weight of some profit-taking after recent highs. Gold eked out a small gain and held above $5,000, while oil climbed 2.4% to $66.73 on ongoing supply concerns.
Our portfolios held up reasonably well thanks to the metals’ exposure, but the equity side gave back a little ground today.
This is how we closed 02/19/2026:
Domestic TTI: +8.39% above its M/A (prior close +8.62%)—Buy signal effective 5/20/25.
International TTI: +12.15% above its M/A (prior close +12.38%)—Buy signal effective 5/8/25.
All linked charts above are courtesy of Bloomberg via ZeroHedge.
———————————————————-
WOULD YOU LIKE TO HAVE YOUR INVESTMENTS PROFESSIONALLY MANAGED?
Do you have the time to follow our investment plans yourself? If you are a busy professional who would like to have his portfolio managed using our methodology, please contact me directly to get more details.
Contact Ulli