
- Moving the market
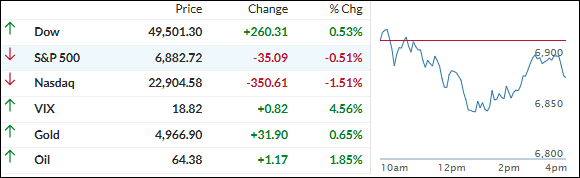
The S&P 500 opened pretty flat while traders kept rotating out of tech stocks, sending the Nasdaq sharply lower.
The main trigger was AMD sliding 14% after its Q1 forecast came in softer than some analysts hoped, which piled more pressure on the sector. Broadcom dipped 3%, Micron fell 8%, and the rest of the chip/AI crowd followed suit.
ADP’s private payrolls report for January came in weak—just +22,000 jobs added vs. the +45,000 economists expected.
That added to the cautious mood, though the official nonfarm payrolls number won’t drop this week due to the partial government shutdown (which ended Tuesday when Trump signed the funding bill).
All eyes are now on Alphabet (reporting after the bell today) and Amazon (Thursday).
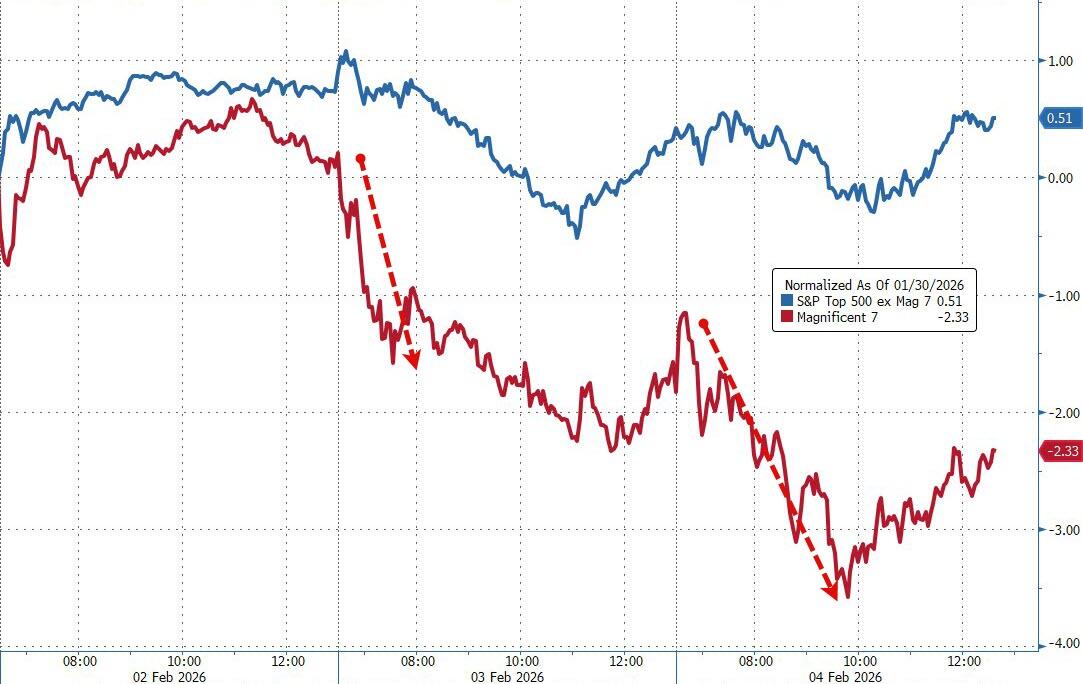
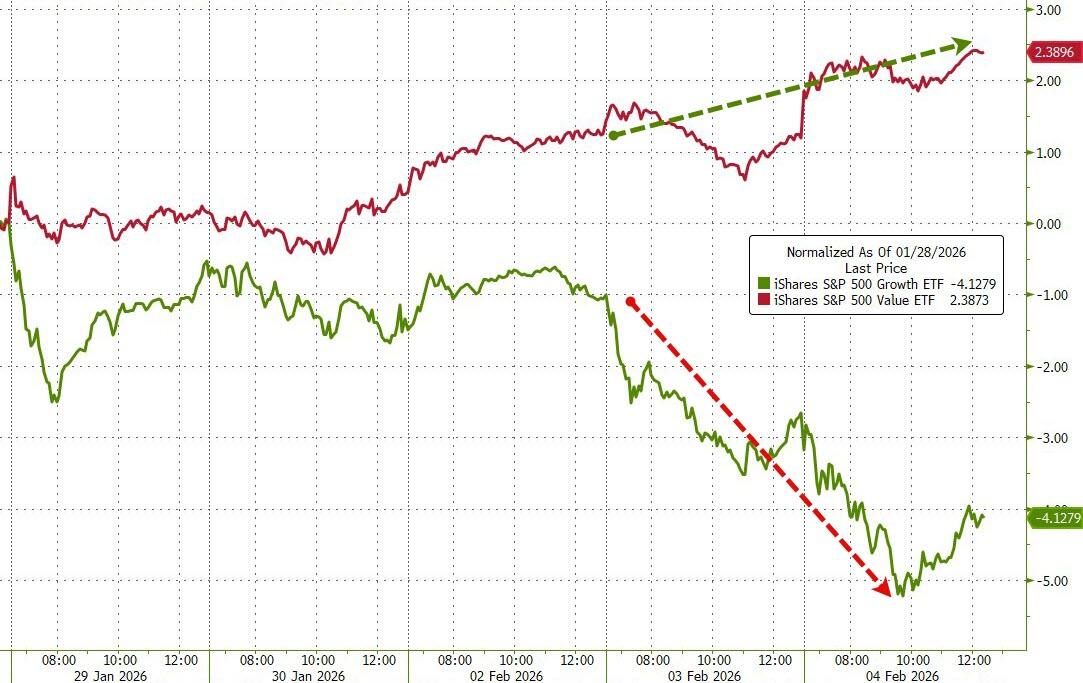
The Mag 7 underperformed the rest of the S&P 493 again, and growth stocks in general got outsold by value names.
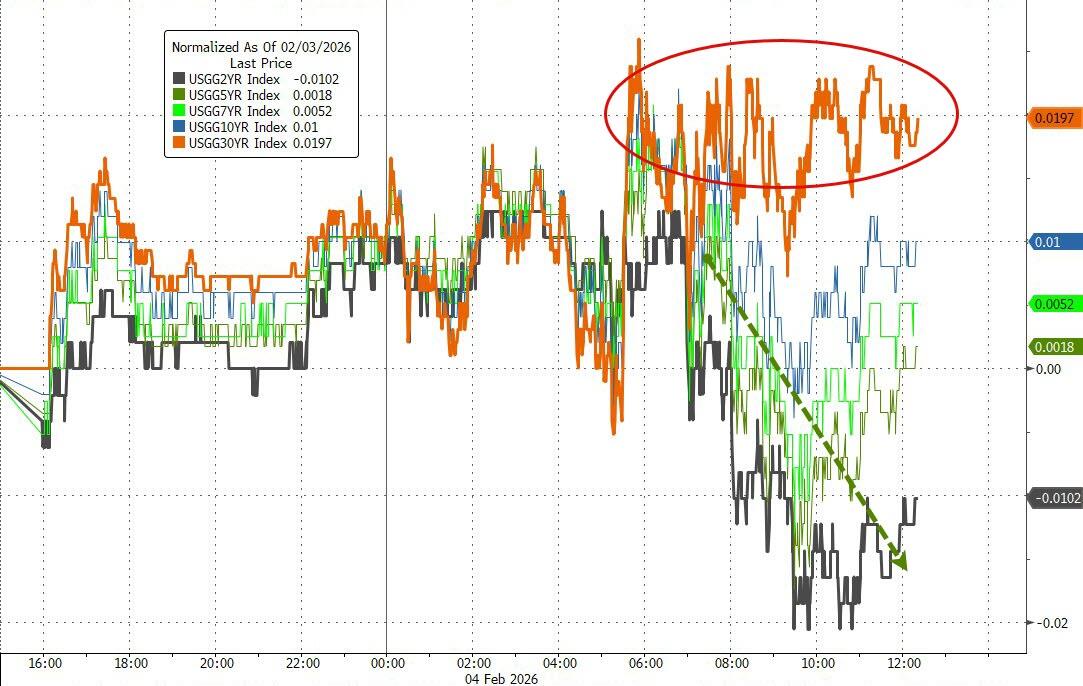
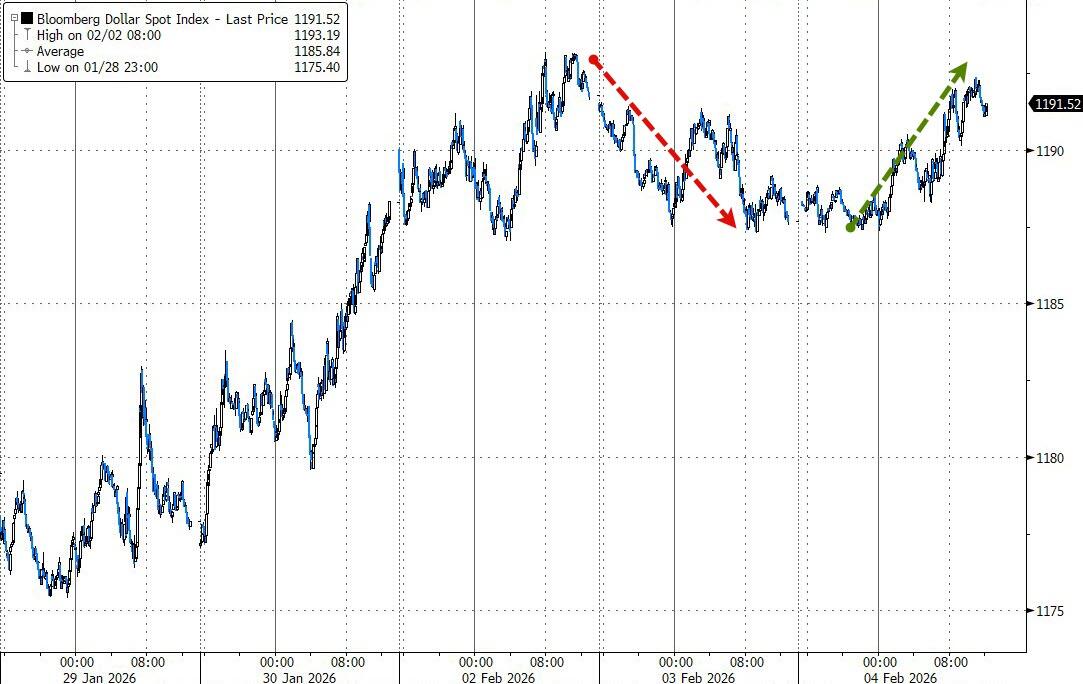
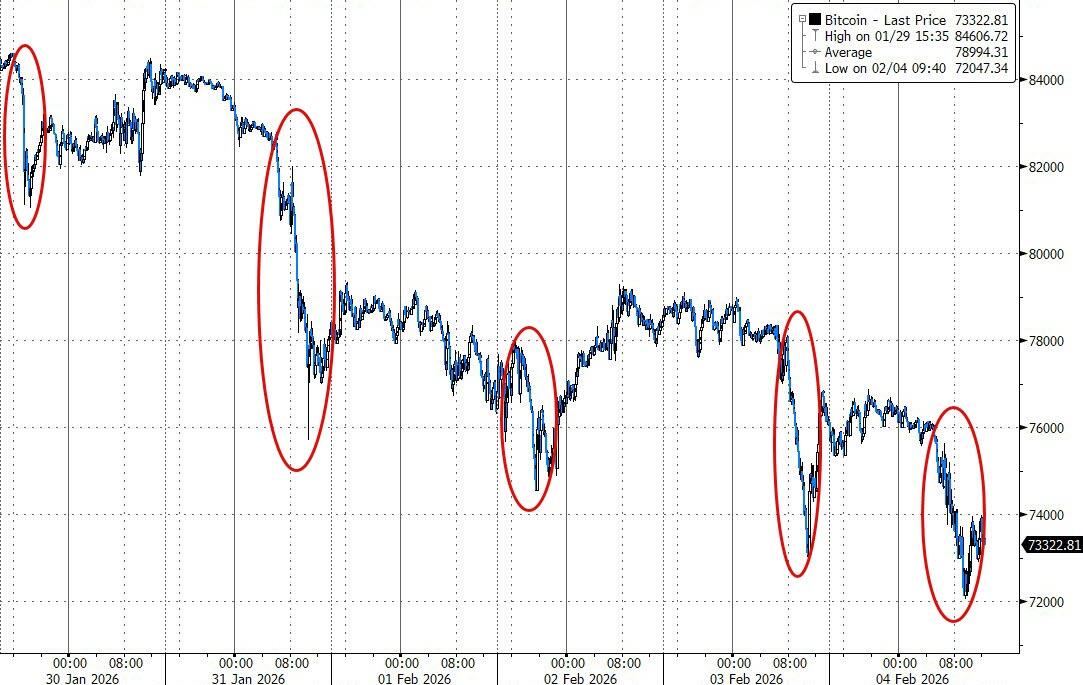
Bond yields were mixed (long end up, short end down), the dollar clawed back yesterday’s losses, and crypto kept bleeding—Bitcoin hit a new low around $72K after bouncing briefly.
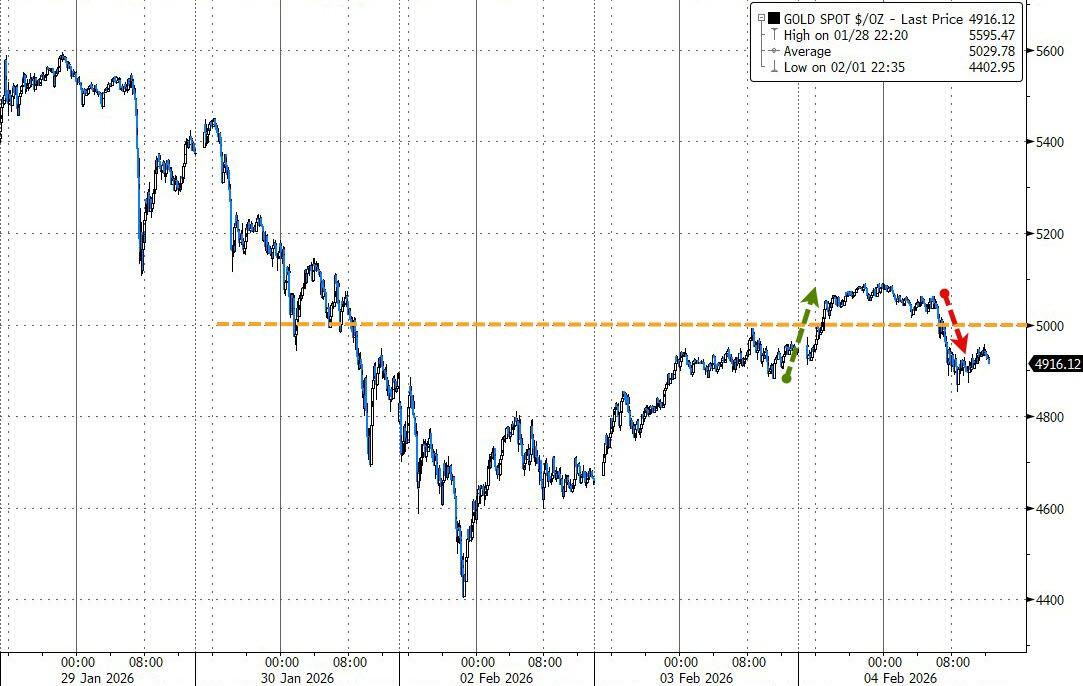
On the bright side, precious metals held up nicely: gold climbed back above $5,000 (though it couldn’t hold), and silver eked out almost a 3% gain.
With tech continuing to lag, value and small caps picking up the slack, and our TTIs still advancing, does this feel like a healthy broadening of the rally into more stable areas… or are you starting to think the growth/tech side needs a real spark to keep the overall bull intact?
2. Current domestic “Buy” Cycle (effective 5/20/2025); International “Buy” Cycle (effective 5/8/25)
Our domestic bullish cycle that began on November 21, 2023, concluded on April 3, 2025, following a market downturn triggered by President Trump’s tariff policy announcement.
This development caused significant declines across major indexes and broader market indices. However, markets subsequently rebounded, culminating in a new domestic “Buy” signal taking effect May 20, 2025.
Concurrently, our International Trend Tracking Index (TTI) experienced parallel volatility. On April 4, 2025, it breached critical thresholds, prompting a “Sell” recommendation. This position reversed as global markets recovered, with the International TTI regaining sufficient momentum to issue a new “Buy” signal effective May 8, 2025.
3. Trend Tracking Indexes (TTIs)
The day opened mixed again, but the Dow found its groove and stuck to a bullish path all the way to the close—even though it dipped briefly into the red mid-session.
The rest of the market couldn’t quite keep up. Tech stayed under pressure, with the Nasdaq leading the downside and dragging the broader averages lower.
The one bright spot?
TTIs completely ignored the tech weakness. Both moved higher, and the domestic one showed real upside momentum today.
This is how we closed 02/04/2026:
Domestic TTI: +7.71% above its M/A (prior close +6.78%)—Buy signal effective 5/20/25.
International TTI: +12.14% above its M/A (prior close +11.82%)—Buy signal effective 5/8/25.
All linked charts above are courtesy of Bloomberg via ZeroHedge.
———————————————————-
WOULD YOU LIKE TO HAVE YOUR INVESTMENTS PROFESSIONALLY MANAGED?
Do you have the time to follow our investment plans yourself? If you are a busy professional who would like to have his portfolio managed using our methodology, please contact me directly to get more details.
Contact Ulli