
ETF Tracker StatSheet
You can view the latest version here.
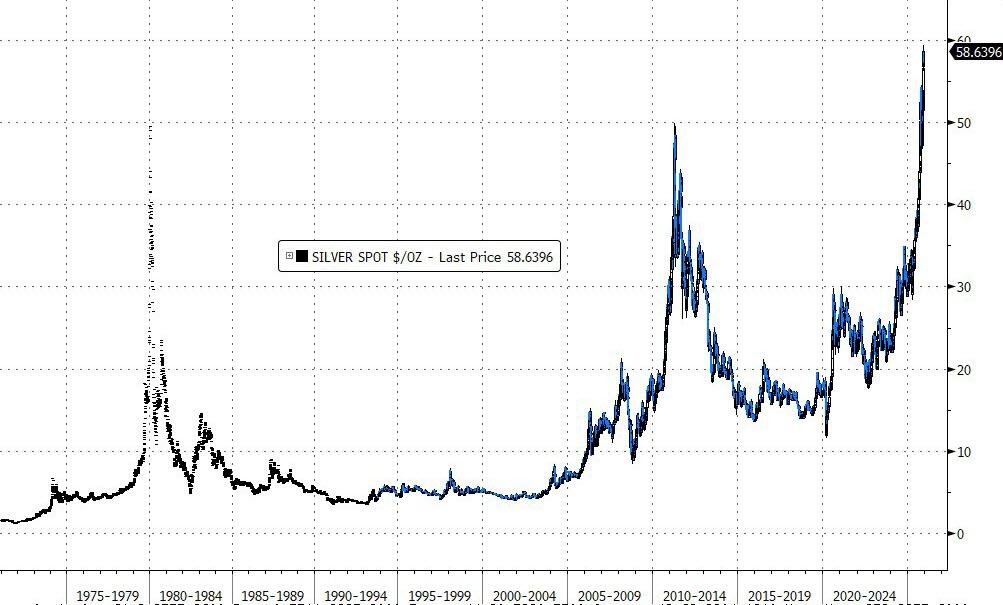
SILVER ALMOST $60, GOLD HOLDS $4,200 – METALS STILL SHINING
- Moving the market
We started strong and never really let up, locking in a fourth straight green day as everyone chewed on fresh inflation data that landed softer than expected.
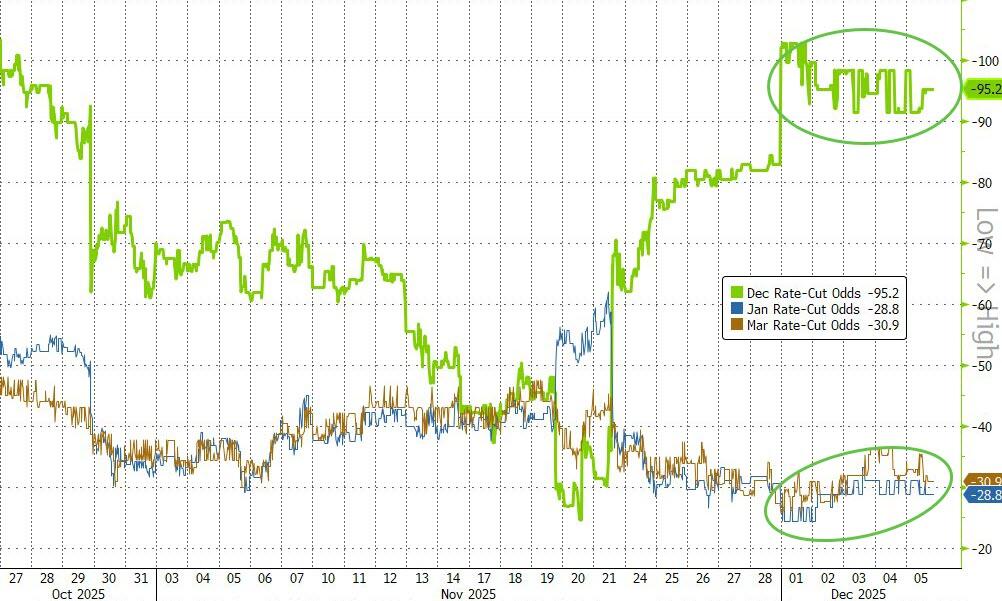
The big one was the delayed September Core PCE (the Fed’s favorite gauge) coming in at 2.8% year-over-year – below the 2.9% estimate.
Tame inflation + recent weak jobs numbers = pretty much locks in that quarter-point cut next Wednesday. The University of Michigan consumer sentiment survey beat expectations too, giving another little tailwind.
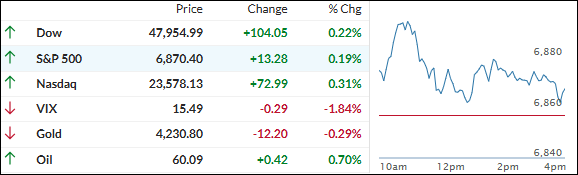
Stocks followed the usual script: Small Caps and Nasdaq led the week, while the S&P was the laggard (barely green after some late selling and plenty of intraday chop).
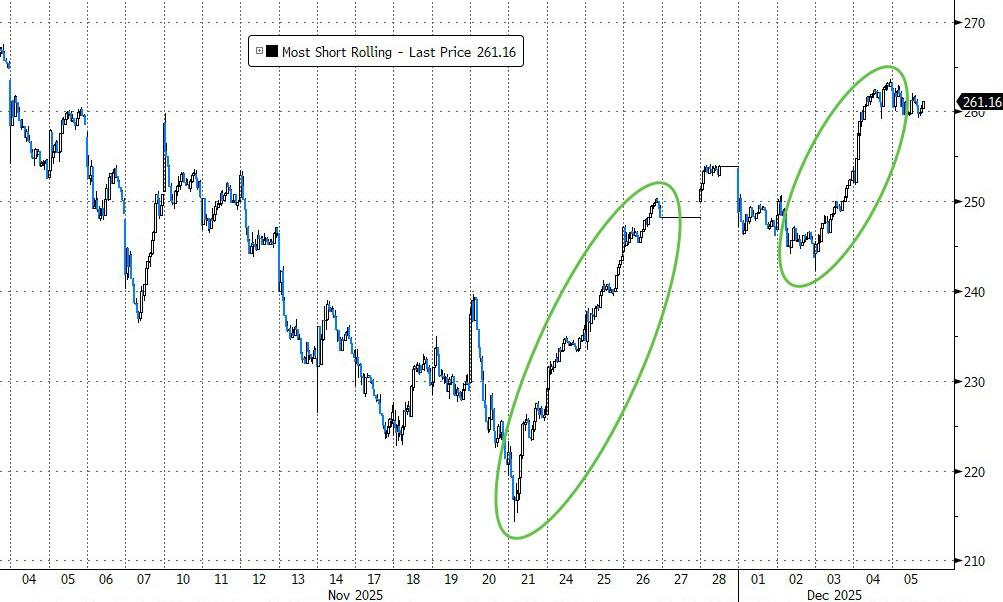
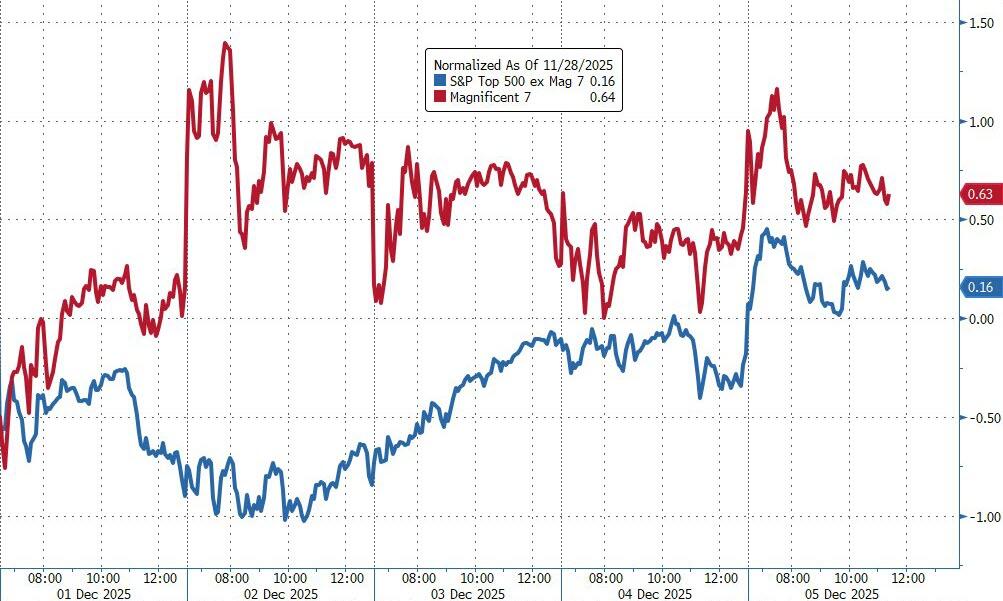
A massive two-week short squeeze – the biggest since August 2022 – helped the Mag 7 crush the rest of the S&P 493.
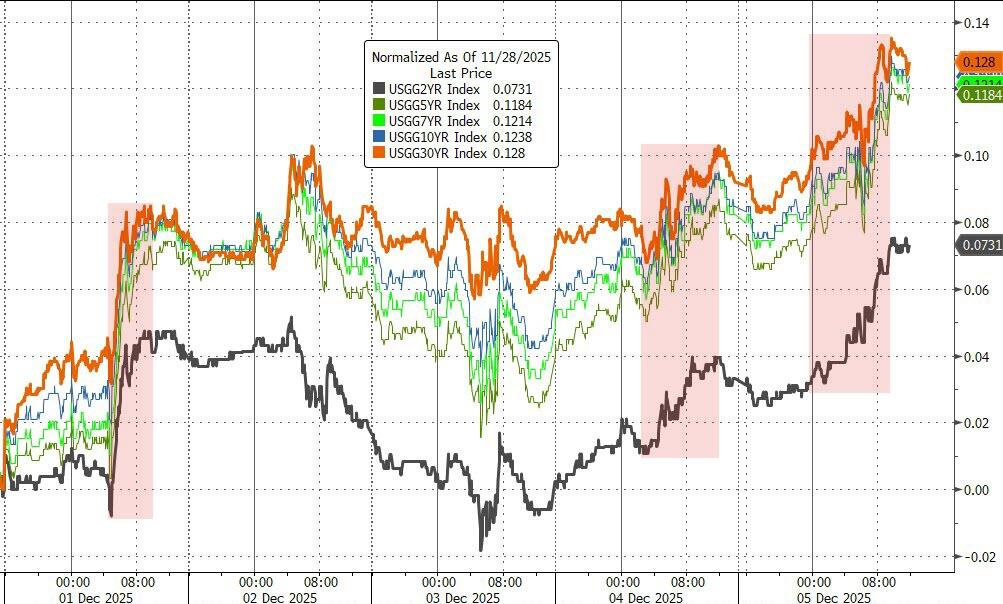
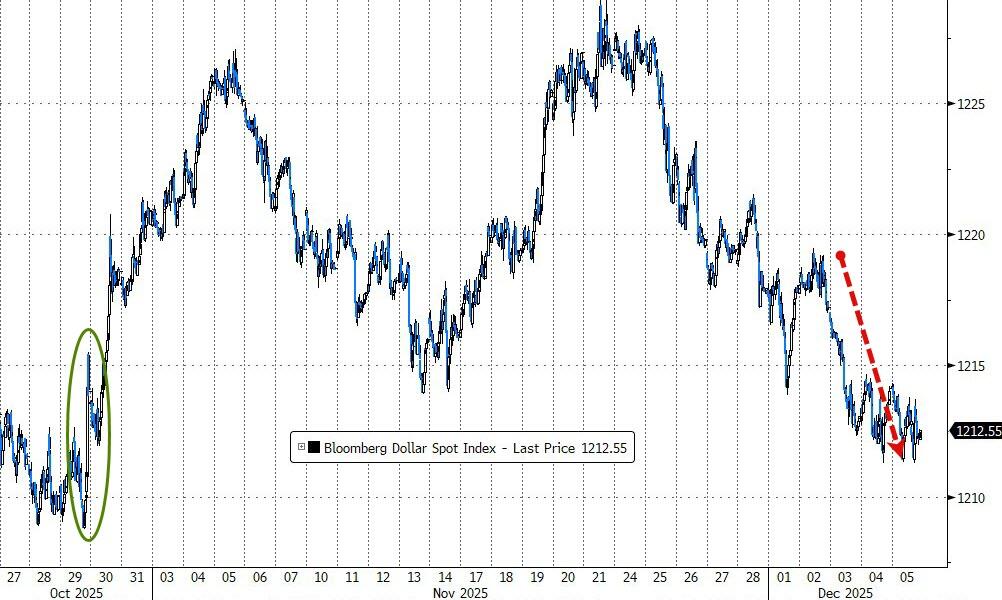
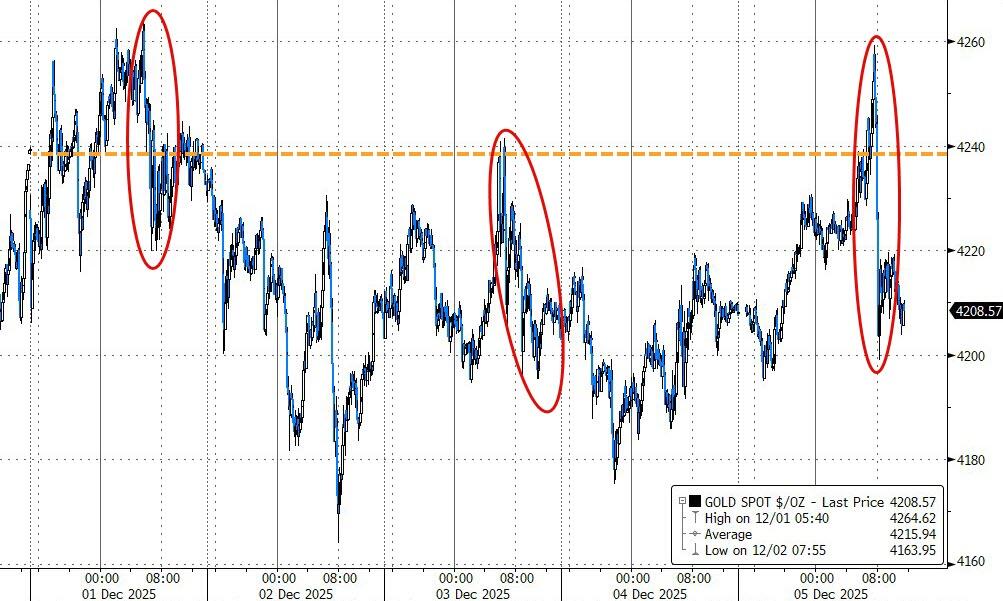
Bond yields rose on the week, the dollar fell for the fourth time in five weeks, gold gave back a little but stayed comfy above $4,200, and silver was the real rockstar – blasted to a new record high, nearly kissing $60 before settling just under.
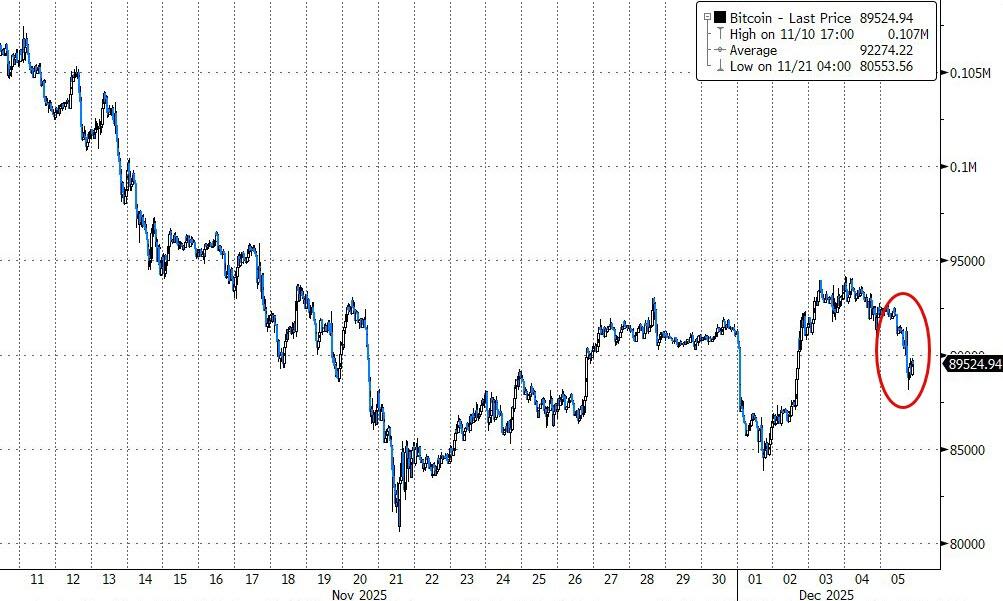
Bitcoin cooled off from mid-week highs around $94K and closed the week below $90K.
Quick thought as we’re heading into Fed week:
With the cut basically priced in and inflation looking cooperative, are we setting up for the classic “buy the rumor, sell the news” move next Wednesday, or will the Santa rally just keep rolling right through it?
2 Current domestic “Buy” Cycle (effective 5/20/2025); International “Buy” Cycle (effective 5/8/25)
Our domestic bullish cycle that began on November 21, 2023, concluded on April 3, 2025, following a market downturn triggered by President Trump’s tariff policy announcement.
This development caused significant declines across major indexes and broader market indices. However, markets subsequently rebounded, culminating in a new domestic “Buy” signal taking effect May 20, 2025.
Concurrently, our International Trend Tracking Index (TTI) experienced parallel volatility. On April 4, 2025, it breached critical thresholds, prompting a “Sell” recommendation. This position reversed as global markets recovered, with the International TTI regaining sufficient momentum to issue a new “Buy” signal effective May 8, 2025.
3. Trend Tracking Indexes (TTIs)
We kicked off on a cheerful note, and the major indexes actually hung onto that early pop all the way to the close.
Gains were pretty modest—nothing to write home about—but tech was the clear leader from bell to bell, doing most of the heavy lifting.
Because the rally stayed so narrow and the broader market basically moved sideways, our TTIs just chilled.
They dipped a tiny, totally immaterial amount—nothing that changes the picture.
This is how we closed 12/05/2025:
Domestic TTI: +6.41% above its M/A (prior close +6.43%)—Buy signal effective 5/20/25.
International TTI: +9.65% above its M/A (prior close +10.07%)—Buy signal effective 5/8/25.
All linked charts above are courtesy of Bloomberg via ZeroHedge.
———————————————————-
WOULD YOU LIKE TO HAVE YOUR INVESTMENTS PROFESSIONALLY MANAGED?
Do you have the time to follow our investment plans yourself? If you are a busy professional who would like to have his portfolio managed using our methodology, please contact me directly to get more details.
Contact Ulli