
ETF Tracker StatSheet
You can view the latest version here.
TARIFF SHOCK ROCKS MARKETS, BUT SILVER AND BITCOIN SHINE
- Moving the market
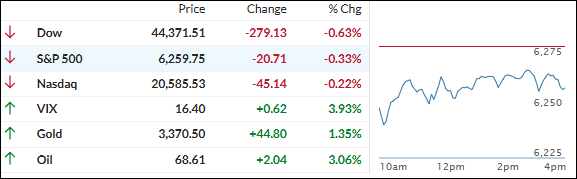
Markets stumbled out of the gate today, led by the Dow, after Trump announced a surprise 35% tariff on Canadian goods—blaming fentanyl as the reason—and warned of even steeper duties if Canada retaliates. That move reignited tariff tensions and quickly erased yesterday’s recovery.
Trump didn’t stop there. He floated the idea of raising blanket tariffs on all remaining countries to 15–20%, up from the 10% level traders had grown used to. Still hanging in the air: his next move on the European Union.
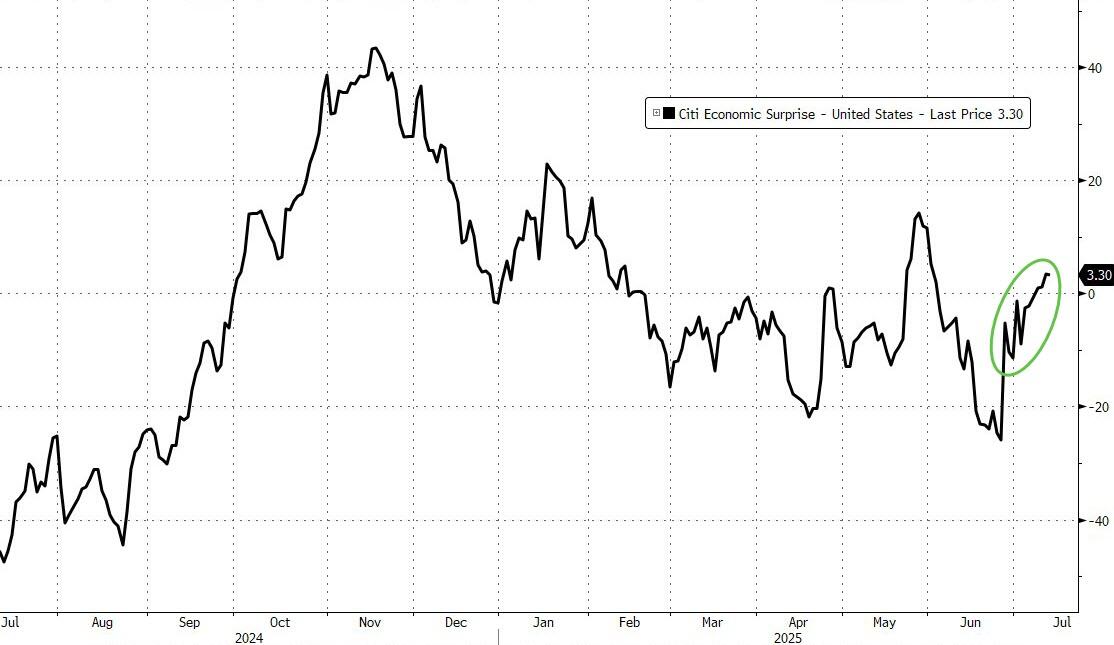
Meanwhile, U.S. macro data showed a slight uptick, but it wasn’t enough to offset the renewed trade uncertainty. All major indexes ended the day lower.
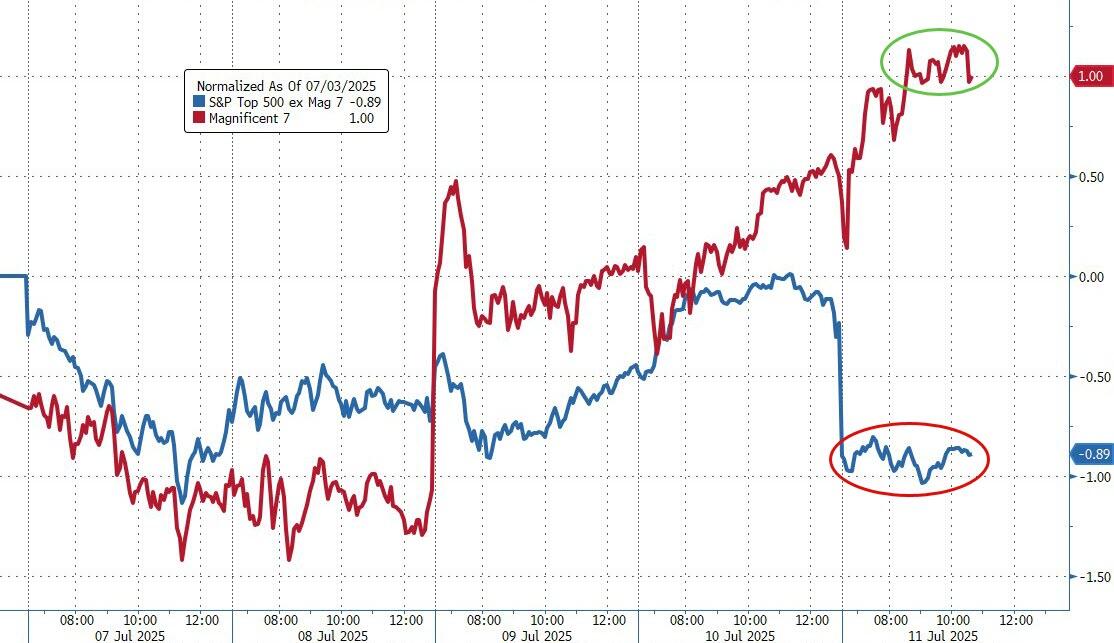
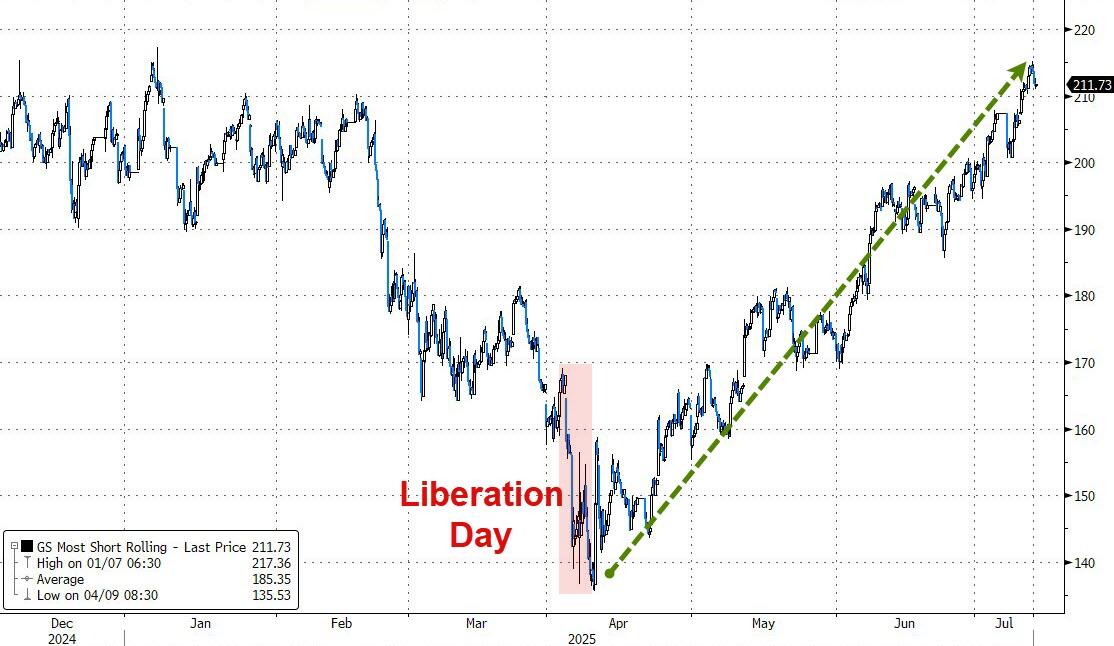
Interestingly, the “Magnificent 7” tech giants bucked the trend, gaining 1% on the week—even as the other 493 S&P stocks lost about 1%. That divergence came despite a short squeeze lifting some of the most heavily bet-against names.
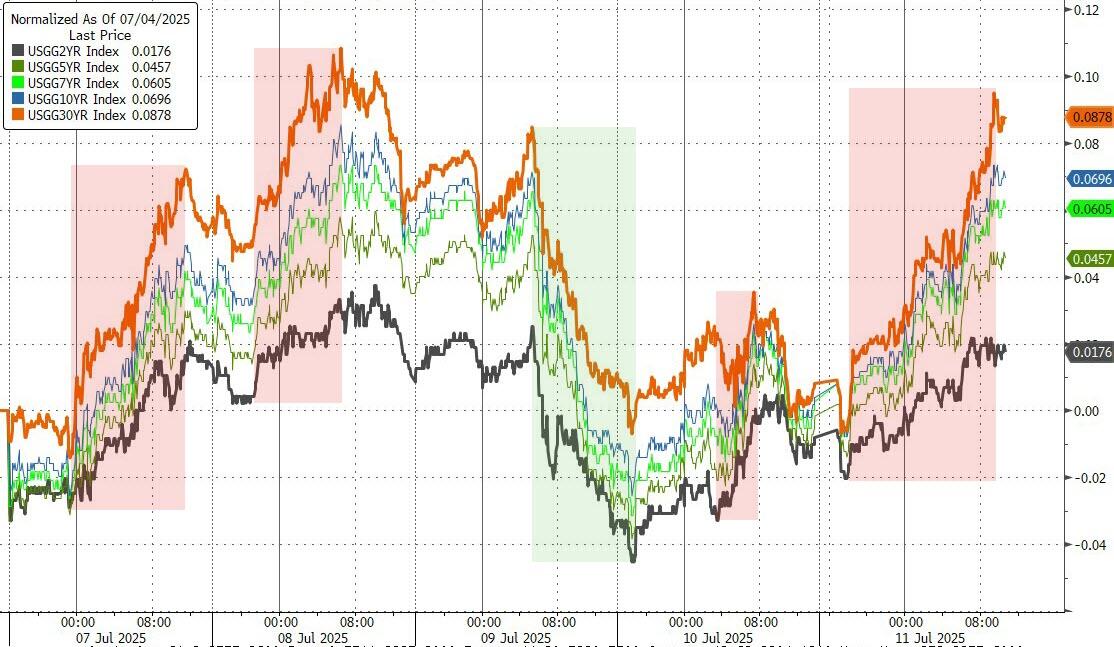
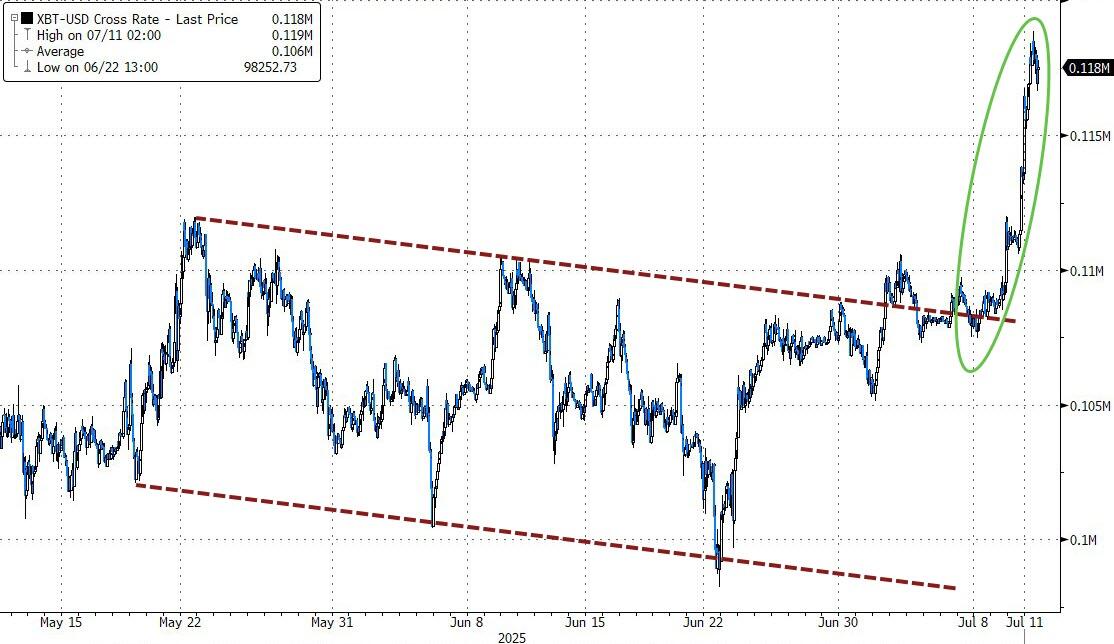
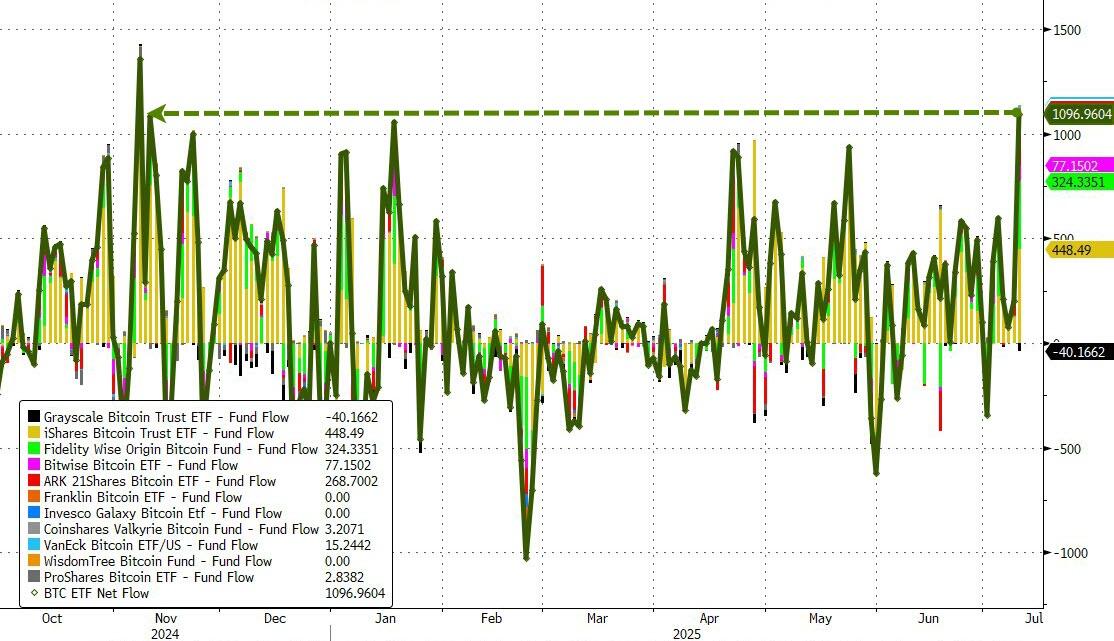
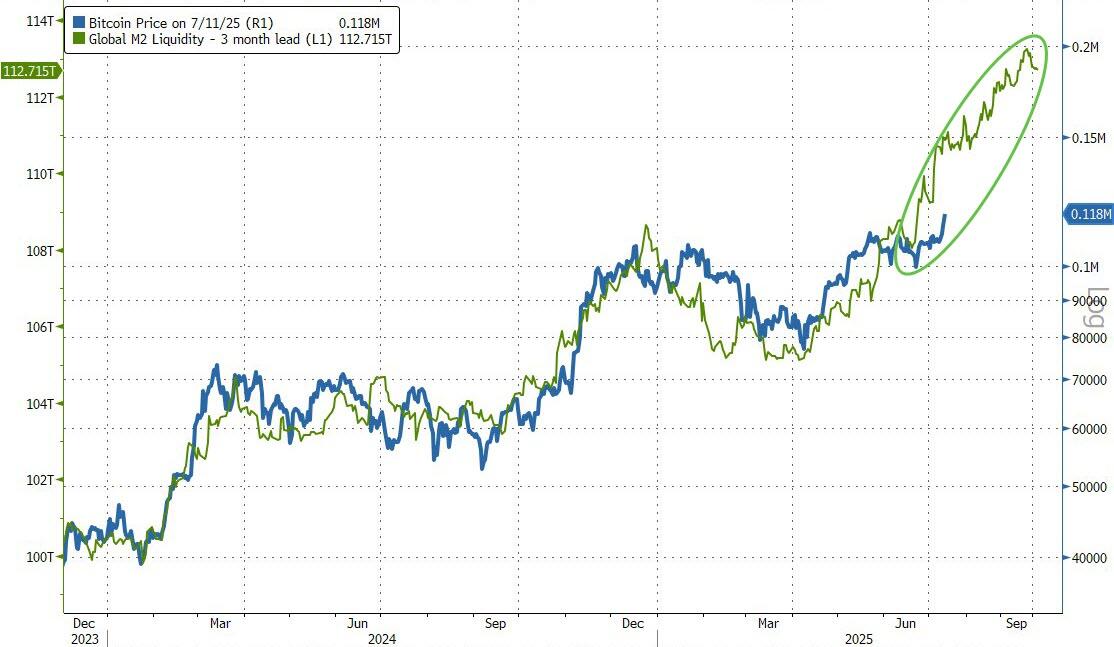
Bond yields climbed, but that didn’t stop Bitcoin from blasting through its range to hit a new all-time high above $118K, fueled by strong ETF inflows and rising liquidity—something I’ve been flagging for a while.
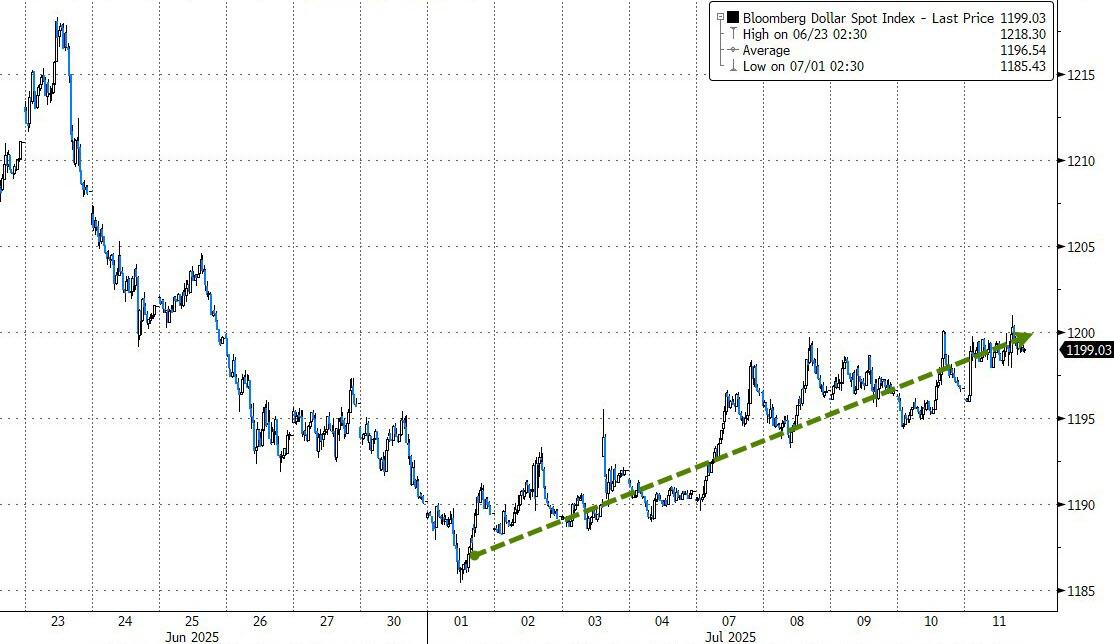
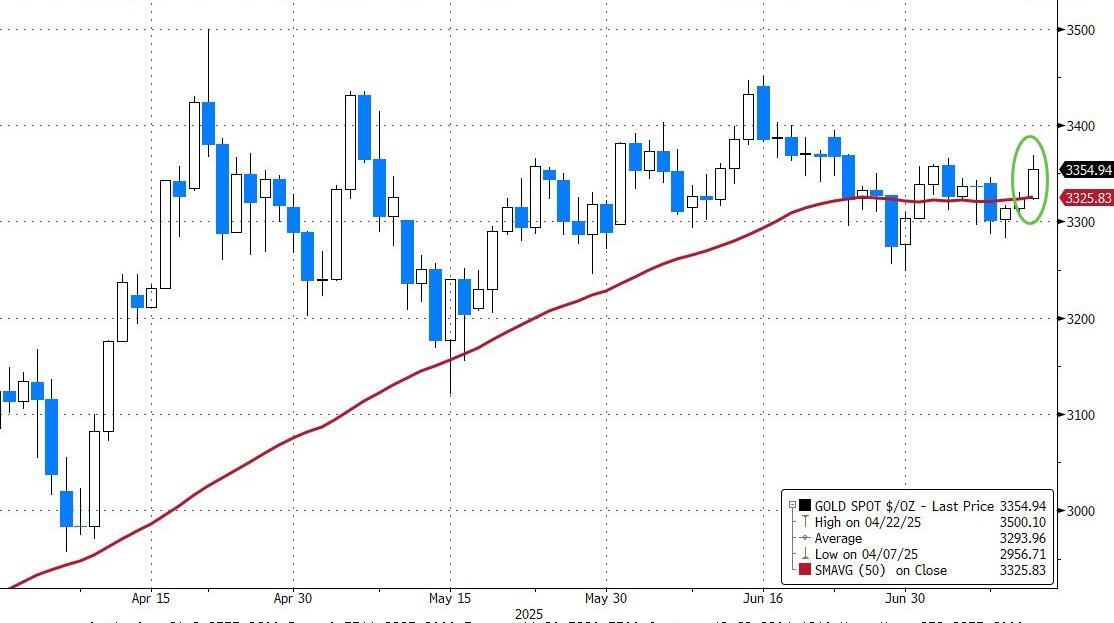
The dollar had its best week since February, though it’s still hovering near three-year lows. Gold stayed strong, rising for the third straight day, and logging two weeks of gains, supported by its 50-day moving average.
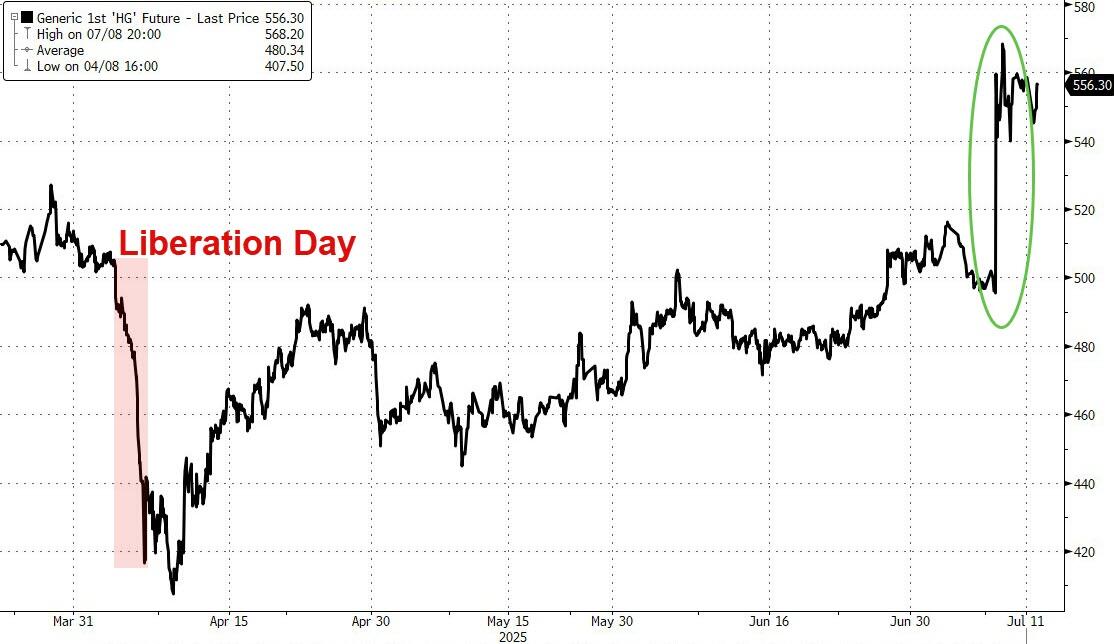
But the real stars of the commodity space were copper and silver. Copper surged to a record high after Trump’s earlier 50% tariff announcement, and silver jumped 3.8% today—breaking above $38 for the first time since 2011.
So, is this the breakout moment traders have been waiting for?
2. Current domestic “Buy” Cycle (effective 5/20/2025); International “Buy” Cycle (effective 5/8/25)
Our domestic bullish cycle that began on November 21, 2023, concluded on April 3, 2025, following a market downturn triggered by President Trump’s tariff policy announcement.
This development caused significant declines across major indexes and broader market indices. However, markets subsequently rebounded, culminating in a new domestic “Buy” signal taking effect May 20, 2025.
Concurrently, our International Trend Tracking Index (TTI) experienced parallel volatility. On April 4, 2025, it breached critical thresholds, prompting a “Sell” recommendation. This position reversed as global markets recovered, with the International TTI regaining sufficient momentum to issue a new “Buy” signal effective May 8, 2025.
3. Trend Tracking Indexes (TTIs)
Nervous traders kept the pressure on stocks, with the major indexes ending the day—and the week—in the red.
Still, the pullback was mild and didn’t signal any major shift in momentum.
Our TTIs also dipped slightly but continue to hold comfortably above their trend lines, suggesting the broader uptrend remains intact.
This is how we closed 07/11/2025:
Domestic TTI: +4.83% above its M/A (prior close +5.83%)—Buy signal effective 5/20/25.
International TTI: +8.38% above its M/A (prior close +9.69%)—Buy signal effective 5/8/25.
All linked charts above are courtesy of Bloomberg via ZeroHedge.
———————————————————-
WOULD YOU LIKE TO HAVE YOUR INVESTMENTS PROFESSIONALLY MANAGED?
Do you have the time to follow our investment plans yourself? If you are a busy professional who would like to have his portfolio managed using our methodology, please contact me directly to get more details.
Contact Ulli