- Moving the markets
Weakness prevailed right from the get-go, when retail stocks were dragged lower due to Target reporting a decline in sales causing their stock price to dive some 13%. Shoppers are struggling with high inflation ahead of the biggest shopping season of the year.
On the other hand, US Retail Sales soared 1.3% MoM in October, which seems to indicate that consumers are willing to spend, yet Target’s report points towards slower consumption. Go figure…
Other economic data painted an ugly picture with US Homebuilder Confidence collapsing in October and Homebuyer Confidence simply biting the dust, as ZeroHedge explained. To add more pain to a shrinking economy, we learned that US Industrial Production unexpectedly contracted last month, while Capacity Utilization slowed.
None of the above will potentially support bullish market sentiment, once this quarter ends, but for the time being more upside momentum is a possibility during this seasonally strong period of the year.
Today, it was the Fed’s Mary Daly singing these hawkish tunes:
- Somewhere between 4.75 and 5.25 seems a reasonable place to think about as we go into the next meeting. And so that does put it in the line of sight that we would get to a point where we would raise and hold.
- Pausing is off the table right now, it’s not even part of the discussion. Right now, the discussion is, rightly, in slowing the pace.
Daly also warned the ‘peak inflationistas’:
- One month of data does not a victory make.
With the exception of the 2-year, bond yields fell and pulled the 10-year down by 8bps to end the day at 3.695%. The US Dollar was flat and so was gold, which is strongly correlated to it, i.e., if the dollar drops, gold rallies and vice versa.
To review where we are in historical context, here is the latest update of the 2008/2009 analog.
2. ETFs in the Spotlight
In case you missed the announcement and description of this section, you can read it here again.
It features some of the 10 broadly diversified domestic and sector ETFs from my HighVolume list as posted every Saturday. Furthermore, they are screened for the lowest MaxDD% number meaning they have been showing better resistance to temporary sell offs than all others over the past year.
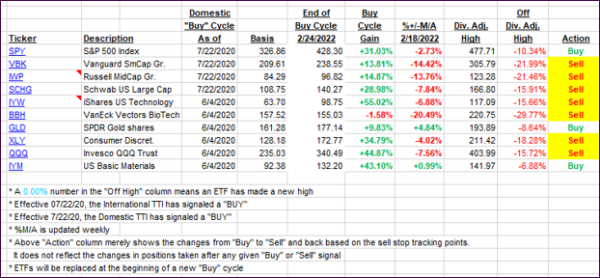
The below table simply demonstrates the magnitude with which these ETFs are fluctuating above or below their respective individual trend lines (%+/-M/A). A break below, represented by a negative number, shows weakness, while a break above, represented by a positive percentage, shows strength.
For hundreds of ETF choices, be sure to reference Thursday’s StatSheet.
For this closed-out domestic “Buy” cycle (2/24/2022), here’s how some of our candidates have fared. Keep in mind that our Domestic Trend Tracking Index (TTI) signaled a “Sell” on that date, which overrode the existing “Buys” shown for SPY and IYM:

Click image to enlarge.
Again, the %+/-M/A column above shows the position of the various ETFs in relation to their respective long-term trend lines, while the trailing sell stops are being tracked in the “Off High” column. The “Action” column will signal a “Sell” once the -12% point has been taken out in the “Off High” column, which has replaced the prior -8% to -10% limits.
3. Trend Tracking Indexes (TTIs)
Our TTIs hit the skids, as Target’s dismal announcement, along with poor economic data points, dominated downside market direction.
This is how we closed 11/16/2022:
Domestic TTI: +0.78% above its M/A (prior close +1.86%)—Sell signal effective 02/24/2022.
International TTI: +0.02% above its M/A (prior close +0.78%)—Sell signal effective 03/08/2022.
Disclosure: I am obliged to inform you that I, as well as my advisory clients, own some of the ETFs listed in the above table. Furthermore, they do not represent a specific investment recommendation for you, they merely show which ETFs from the universe I track are falling within the specified guidelines.
All linked charts above are courtesy of Bloomberg via ZeroHedge.
Contact Ulli