- Moving the markets
Another early rally bit the dust with the major indexes surrendering morning gains and the S&P 500 and Nasdaq also giving back yesterday’s advances.
Added CNBC:
The S&P 500 is down 2% for the week on inflation fears as a Tuesday CPI report showed price increases not seen since 1981. The Nasdaq Composite is off 3.7% and the Dow is flat for the week.
Spiking bond yields pulled the rug out from under equities, with the 10-year adding 13 basis points to push the rate to 2.83%, a multi-year high, as inflation exacted its pound of flesh—again. The widely held 20-year bond ETF TLT got spanked again and lost 2% on the day bringing its YTD losses to -18.51%. Ouch!
As much as traders would have liked to push the 8.5% CPI and 11.2% PPI numbers on the back burner, the reality of a variety of bearish data points set in, as well as speculation on how the Fed will now respond, and south we went.
Not helping the bulls was the release of US Retail Sales Growth, which was the slowest in 13 months with online spending plunging, as ZH pointed out.
Twitter was headline news, as Elon Musk offered to buy the company, but rumors played havoc with the price, as this chart shows, while $2.1 trillion in options expirations did their number on market volatility.
Another roller coaster ride occurred in the ever-ongoing battle between “value” and “growth,” as well as in the “most shorted stocks” arena, but it the end, it turned out to be a losing week.
As yields rose, the US Dollar stormed higher and pulled gold slightly lower. The energy complex gained for the week, with oil prices surging, including Natural Gas, which almost went vertical.
I hope you will enjoy a calm Easter weekend, because the markets will be anything but calm, when trading resumes next Monday.
2. ETFs in the Spotlight
In case you missed the announcement and description of this section, you can read it here again.
It features some of the 10 broadly diversified domestic and sector ETFs from my HighVolume list as posted every Saturday. Furthermore, they are screened for the lowest MaxDD% number meaning they have been showing better resistance to temporary sell offs than all others over the past year.
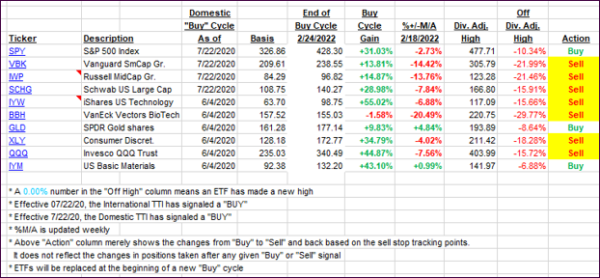
The below table simply demonstrates the magnitude with which these ETFs are fluctuating above or below their respective individual trend lines (%+/-M/A). A break below, represented by a negative number, shows weakness, while a break above, represented by a positive percentage, shows strength.
For hundreds of ETF choices, be sure to reference Thursday’s StatSheet.
For this just closed-out domestic “Buy” cycle, here’s how some of our candidates have fared:

Click image to enlarge.
Again, the %+/-M/A column above shows the position of the various ETFs in relation to their respective long-term trend lines, while the trailing sell stops are being tracked in the “Off High” column. The “Action” column will signal a “Sell” once the -12% point has been taken out in the “Off High” column, which has replaced the prior -8% to -10% limits.
3. Trend Tracking Indexes (TTIs)
Our Domestic TTI slipped and sits only a tad above its long-term trend line, while the International one has dropped further into bear market territory.
The major trend direction is mired in uncertainty, so we will hold our current positions subject to our trailing sell stops.
This is how we closed 04/14/2022:
Domestic TTI: +0.22% above its M/A (prior close +1.04%)—Sell signal effective 02/24/2022.
International TTI: -0.81% below its M/A (prior close -0.47%)—Sell signal effective 03/08/2022.
Disclosure: I am obliged to inform you that I, as well as my advisory clients, own some of the ETFs listed in the above table. Furthermore, they do not represent a specific investment recommendation for you, they merely show which ETFs from the universe I track are falling within the specified guidelines.
All linked charts above are courtesy of Bloomberg via ZeroHedge.
Contact Ulli