- Moving the markets
After Friday’s levitation to start the month of October on a positive note, much of that enthusiasm waned, as the mood soured thereby pushing the major indexes into the red. The Dow fared the best and the Nasdaq the worst, because of higher interest rates exacting another pound of flesh from this sector.
Unless bond yields do an about face and head south again, the Nasdaq won’t have much of a chance to recover. Right now, one of our tech holdings is nibbling at its trailing sell stop and will be liquidated upon breaking through this predetermined level.
Added Jim Paulsen, a chief investment strategist:
The financial markets are adjusting leadership to reflect another Covid-induced reopening cycle. That is, commodities are rising, bond yields are rising, cyclical sectors and small cap stocks are outpacing, and technology and growth stocks in general are underperforming.
Of course, the entire stock market is operating at extremely lofty levels, so it’s as no surprise that corrections will come into play. The question in my mind is whether these are just temporary pullbacks, or is something more sinister brewing in the background that will pull equities much lower and into bear market territory?
I think the odds currently are favoring that scenario when considering the barrage of unknowns that is bombarding the markets daily. For example, the ever-increasing inflation risks, Federal Reserve tapering, rising bond yields, supply chain disruptions, the debt ceiling anxiety, the Evergrande bond default and higher taxes all add poison to this cocktail called the stock market.
Fortunately, we don’t have to guess which way things will turn. Because we will let our trailing sell stops and Trend Tracking Indexes (TTIs) be our guide to advise us when it’s time to reduce our risk by moving to the safety of the sidelines.
Is this chart indicating that we are getting close?
You can read this week’s posting schedule here.
2. ETFs in the Spotlight
In case you missed the announcement and description of this section, you can read it here again.
It features some of the 10 broadly diversified domestic and sector ETFs from my HighVolume list as posted every Saturday. Furthermore, they are screened for the lowest MaxDD% number meaning they have been showing better resistance to temporary sell offs than all others over the past year.
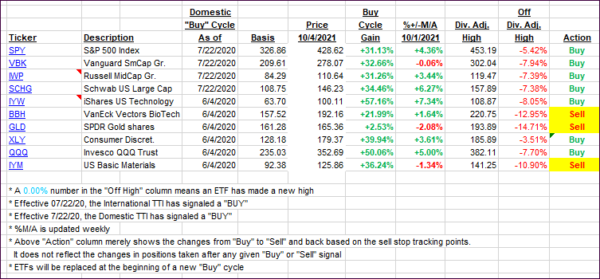
The below table simply demonstrates the magnitude with which these ETFs are fluctuating above or below their respective individual trend lines (%+/-M/A). A break below, represented by a negative number, shows weakness, while a break above, represented by a positive percentage, shows strength.
For hundreds of ETF choices, be sure to reference Thursday’s StatSheet.
For this current domestic “Buy” cycle, here’s how some our candidates have fared:

Click image to enlarge.
Again, the %+/-M/A column above shows the position of the various ETFs in relation to their respective long-term trend lines, while the trailing sell stops are being tracked in the “Off High” column. The “Action” column will signal a “Sell” once the -8% point has been taken out in the “Off High” column. For more volatile sector ETFs, the trigger point is -10%.
3. Trend Tracking Indexes (TTIs)
Our TTIs reversed and gave back Friday’s gains.
This is how we closed 10/04/2021:
Domestic TTI: +3.85% above its M/A (prior close +4.51%)—Buy signal effective 07/22/2020.
International TTI: +1.48% above its M/A (prior close +1.79%)—Buy signal effective 07/22/2020.
Disclosure: I am obliged to inform you that I, as well as my advisory clients, own some of the ETFs listed in the above table. Furthermore, they do not represent a specific investment recommendation for you, they merely show which ETFs from the universe I track are falling within the specified guidelines.
All linked charts above are courtesy of Bloomberg via ZeroHedge.
Contact Ulli