
- Moving the markets
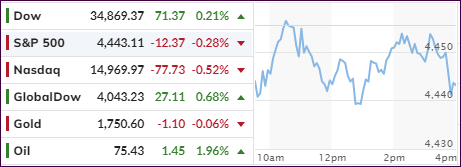
An early bounce faded throughout the session with only the Dow maintaining bullish tendencies, while the S&P 500 and Nasdaq drifted aimlessly below their respective unchanged lines.
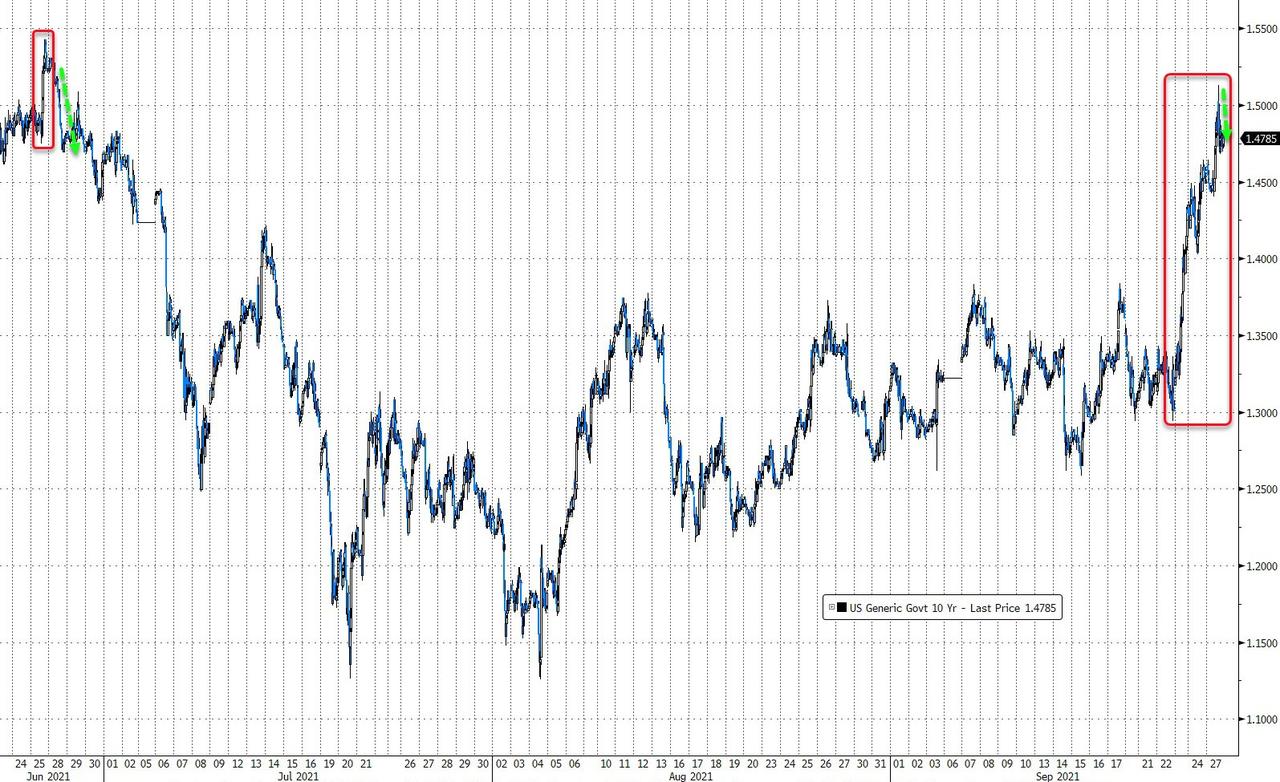
The final week of a volatile September caused this divergence in the major indexes with growth/tech stocks struggling as bond yields spiked, with the 10-year briefly breaking through the 1.5% marker and reaching its highest point since June.
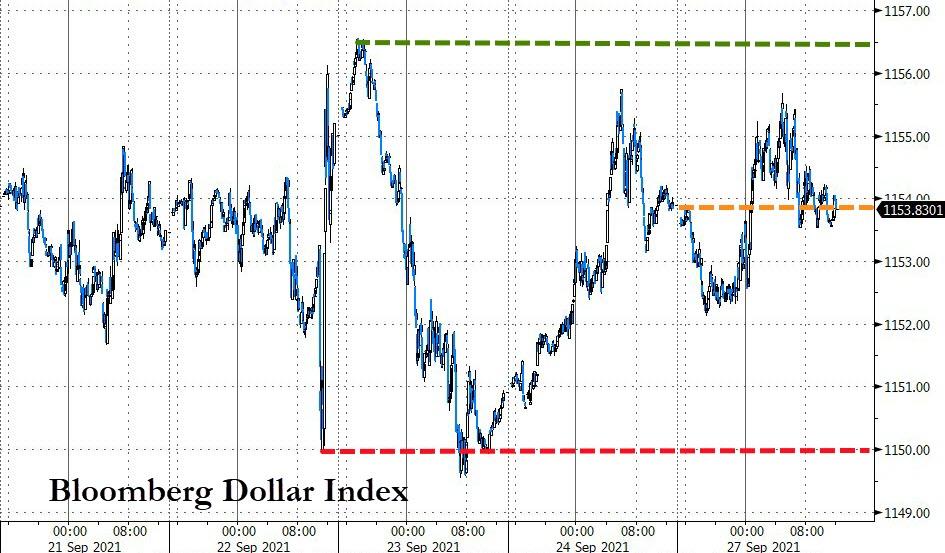
The US Dollar rode the roller-coaster all day but stayed range bound and closed just about unchanged. Gold gave up its early gains and dipped back to the unchanged line, as surging bond yields took the starch out from any upward momentum.
The rise in yields benefited some sectors such as the financials (XLF) and the Commodity Index (CRB), each of which added +1.36% for the day. The value ETF RPV finally showed some signs of life by gaining an impressive +2.19%, but in that sector those kinds of advances can be wiped out in a hurry, as we have witnessed this year.
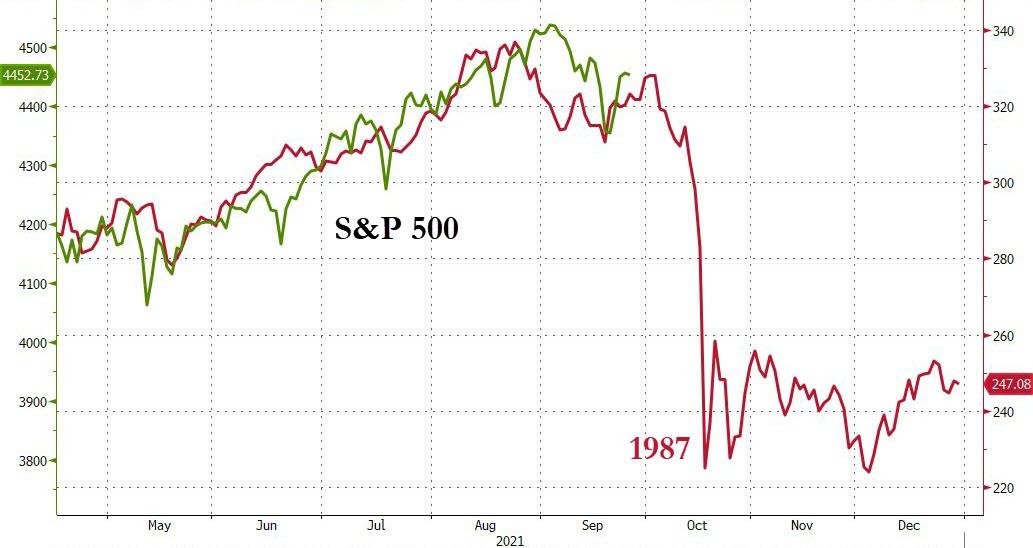
This week will not only mark the end of September, but on the menu are a host of items that can push markets around in a hurry. I am talking about the ongoing US Debt ceiling/government shutdown/infrastructure bill narrative, all of which might be coming to a head by the end of this week.
As ZeroHedge pointed out tongue-in-cheek, “maybe a 20% plus drop in stocks down to the level as shown in this chart may get the warring parties to agree on something.”
We will find out.
2. ETFs in the Spotlight
In case you missed the announcement and description of this section, you can read it here again.
It features some of the 10 broadly diversified domestic and sector ETFs from my HighVolume list as posted every Saturday. Furthermore, they are screened for the lowest MaxDD% number meaning they have been showing better resistance to temporary sell offs than all others over the past year.
The below table simply demonstrates the magnitude with which these ETFs are fluctuating above or below their respective individual trend lines (%+/-M/A). A break below, represented by a negative number, shows weakness, while a break above, represented by a positive percentage, shows strength.
For hundreds of ETF choices, be sure to reference Thursday’s StatSheet.
For this current domestic “Buy” cycle, here’s how some our candidates have fared:
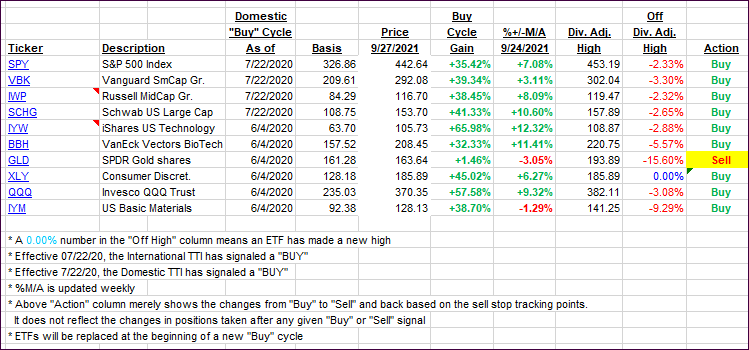
Click image to enlarge.
Again, the %+/-M/A column above shows the position of the various ETFs in relation to their respective long-term trend lines, while the trailing sell stops are being tracked in the “Off High” column. The “Action” column will signal a “Sell” once the -8% point has been taken out in the “Off High” column. For more volatile sector ETFs, the trigger point is -10%.
3. Trend Tracking Indexes (TTIs)
Our TTIs gained despite the markets going nowhere.
This is how we closed 09/27/2021:
Domestic TTI: +6.69% above its M/A (prior close +6.34%)—Buy signal effective 07/22/2020.
International TTI: +3.90% above its M/A (prior close +3.20%)—Buy signals effective 07/22/2020.
Disclosure: I am obliged to inform you that I, as well as my advisory clients, own some of the ETFs listed in the above table. Furthermore, they do not represent a specific investment recommendation for you, they merely show which ETFs from the universe I track are falling within the specified guidelines.
All linked charts above are courtesy of Bloomberg via ZeroHedge.
Contact Ulli