- Moving the markets
The futures markets last night already indicated positive numbers, a trend which continued into the regular session. The major indexes opened higher and never looked back, which resulted in a solid bounce back after yesterday’s thrashing.
Most of Monday’s losses were recovered, as dip buyers stepped in to take advantage of the Dow’s worst day in some eight months. Prior concerns, that a Covid revival would slow down the economic rebound, was alleviated by rising bond yields, with the 10-year crawling back above its 1.20% level, thereby indicating expansion rather than contraction.
Of course, as fickle as the markets are, this merely represents just one moment in time, and opinions could change in a hurry. However, right now on this Tuesday, traders viewed events through rose-colored glasses.
The rebound was broad based with financials staging a nice comeback, as XLF stormed back and scored a +2.53% gain. That was closely followed by RPV (value), which added +2.44%. Small Caps (VBK) stole the limelight with a resurgence of +2.67%.
And, as usually is the case during sharp rebounds, a monster short-squeeze contributed to today’s advances. The US Dollar index ended only slightly higher due to a sell-off into the close.
The precious metals played in opposite ballparks. Gold managed to eke out a small gain and remain above its $1,800 level, while Silver was taken out behind the barn and spanked into oblivion.
Right now, it looks liked the bulls have gained the upper hand again, or could this graph be describing the situation more accurately?
2. ETFs in the Spotlight
In case you missed the announcement and description of this section, you can read it here again.
It features some of the 10 broadly diversified domestic and sector ETFs from my HighVolume list as posted every Saturday. Furthermore, they are screened for the lowest MaxDD% number meaning they have been showing better resistance to temporary sell offs than all others over the past year.
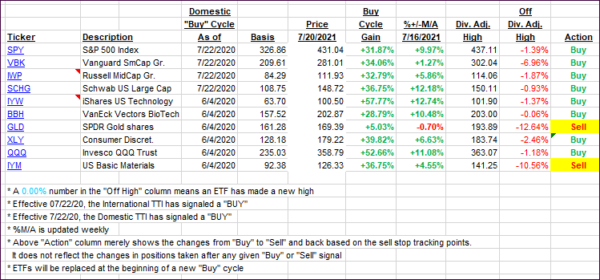
The below table simply demonstrates the magnitude with which these ETFs are fluctuating above or below their respective individual trend lines (%+/-M/A). A break below, represented by a negative number, shows weakness, while a break above, represented by a positive percentage, shows strength.
For hundreds of ETF choices, be sure to reference Thursday’s StatSheet.
For this current domestic “Buy” cycle, here’s how some our candidates have fared:

Click image to enlarge.
Again, the %+/-M/A column above shows the position of the various ETFs in relation to their respective long-term trend lines, while the trailing sell stops are being tracked in the “Off High” column. The “Action” column will signal a “Sell” once the -8% point has been taken out in the “Off High” column. For more volatile sector ETFs, the trigger point is -10%.
3. Trend Tracking Indexes (TTIs)
Our TTIs bounced back as if yesterday never happened.
This is how we closed 07/20/2021:
Domestic TTI: +9.65% above its M/A (prior close +7.61%)—Buy signal effective 07/22/2020.
International TTI: +5.15% above its M/A (prior close +4.10%)—Buy signals effective 07/22/2020.
Disclosure: I am obliged to inform you that I, as well as my advisory clients, own some of the ETFs listed in the above table. Furthermore, they do not represent a specific investment
recommendation for you, they merely show which ETFs from the universe I track are falling within the specified guidelines.
All linked charts above are courtesy of Bloomberg via ZeroHedge.
Contact Ulli