
- Moving the markets
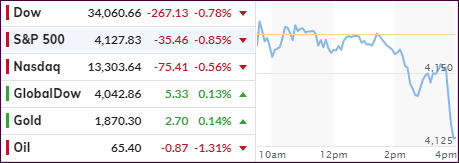
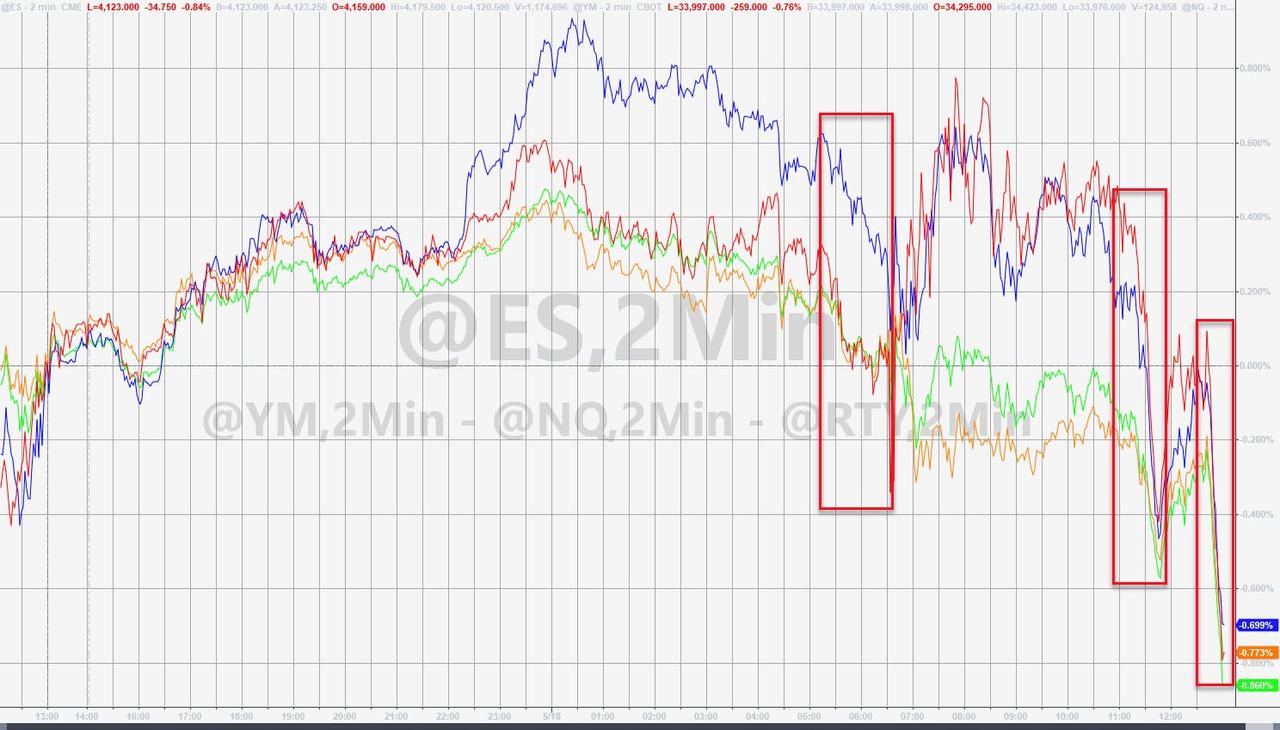
Despite desperate attempts to cling to the unchanged line, bearish forces proved too overwhelming today and pulled the major indexes into the red. This was especially disappointing for the Nasdaq, which had sported a solid rally early on but lost upward momentum and ended up diving into the close.
Despite better-than-expected earnings from the likes of Walmart, Macy’s and Home Depot, some econ data provided the offset. Housing Starts plummeted 9.5% to 1.569 million units last month, a worse drop than the 1.7 million number expected.
While growth-heavy stocks have taken a hit lately, value could not right the sinking ship today, as the broad based RPV ETF also succumbed to bearish forces along with Small Caps.
Inflation and its potentially ill effects are on traders’ minds. Much anxiety exists ahead of tomorrow’s release of the Fed minutes from their last meeting, which will be dissected for any reference of what policy makers might be thinking in terms of the recent CPI/PPI data releases.
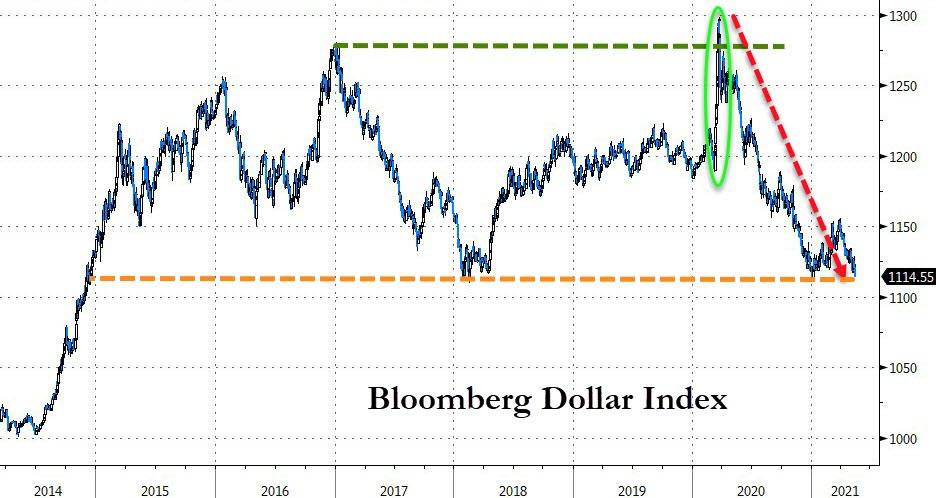
The US Dollar continued its swan dive imitation and dropped back to its lowest level since January, which also represents a major support point. Once taken out, it’s a long way down to the lows made in 2014.
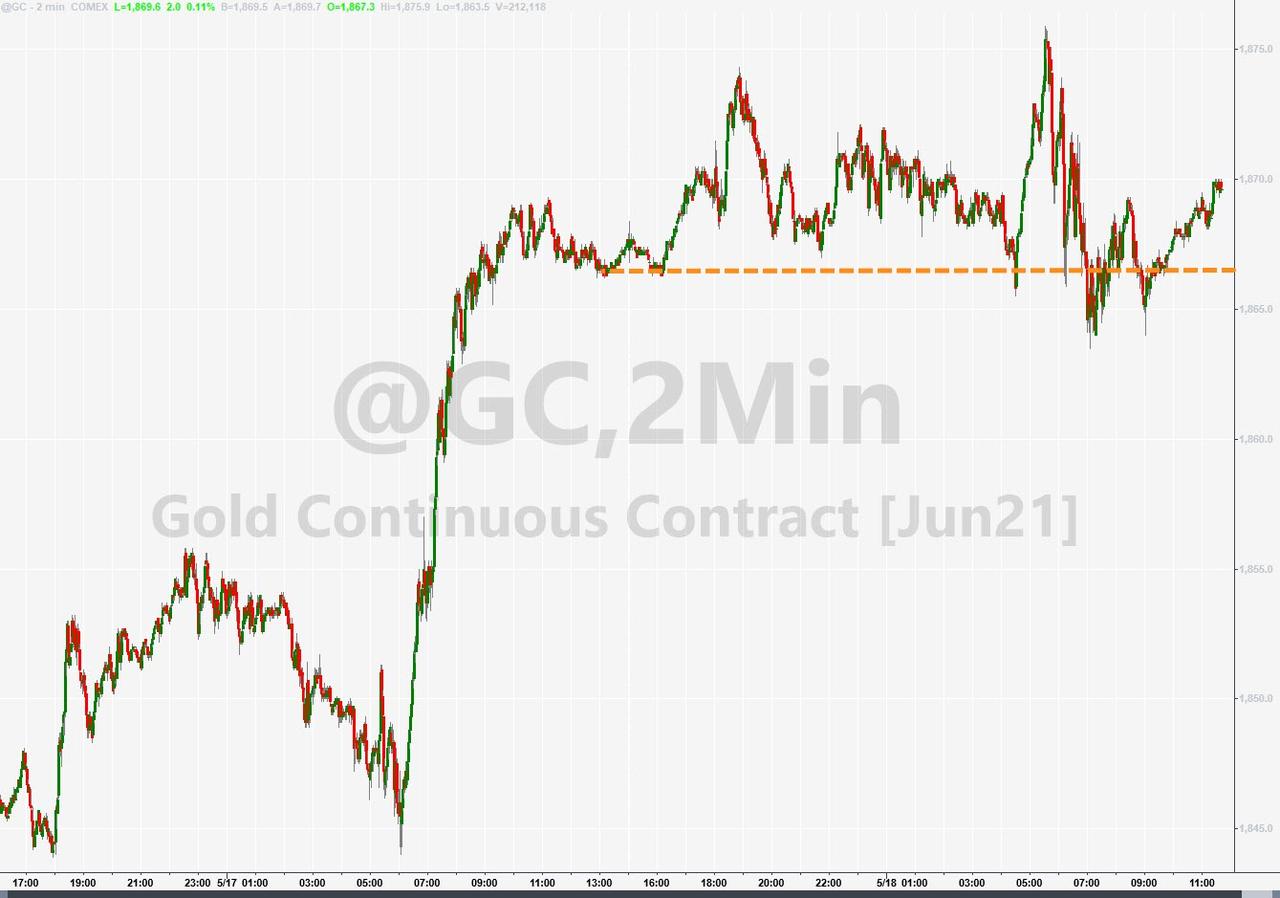
This brings me to one of the few green closes we saw today, namely gold. With bond yields holding steady, and the dollar getting clobbered, GLD managed to eke out a modest 0.19% gain. As inflationary forces take hold and are eventually admitted to by the powers to be, we may finally reach the moment in time where the precious metal will shine brightly more often.
2. ETFs in the Spotlight
In case you missed the announcement and description of this section, you can read it here again.
It features some of the 10 broadly diversified domestic and sector ETFs from my HighVolume list as posted every Saturday. Furthermore, they are screened for the lowest MaxDD% number meaning they have been showing better resistance to temporary sell offs than all others over the past year.
The below table simply demonstrates the magnitude with which these ETFs are fluctuating above or below their respective individual trend lines (%+/-M/A). A break below, represented by a negative number, shows weakness, while a break above, represented by a positive percentage, shows strength.
For hundreds of ETF choices, be sure to reference Thursday’s StatSheet.
For this current domestic “Buy” cycle, here’s how some our candidates have fared:
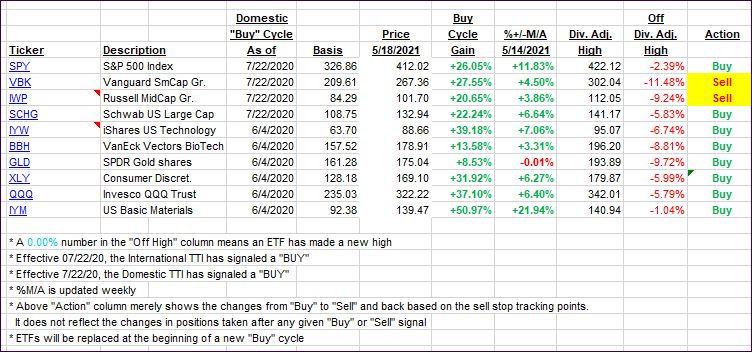
Click image to enlarge.
Again, the %+/-M/A column above shows the position of the various ETFs in relation to their respective long-term trend lines, while the trailing sell stops are being tracked in the “Off High” column. The “Action” column will signal a “Sell” once the -8% point has been taken out in the “Off High” column. For more volatile sector ETFs, the trigger point is -10%.
3. Trend Tracking Indexes (TTIs)
Our TTIs again went opposite ways with the International one rising at the same time as the Domestic one slipped.
This is how we closed 05/18/2021:
Domestic TTI: +17.15% above its M/A (prior close +18.19%)—Buy signal effective 07/22/2020.
International TTI: +16.45% above its M/A (prior close +16.05%)—Buy signals effective 07/22/2020.
Disclosure: I am obliged to inform you that I, as well as my advisory clients, own some of the ETFs listed in the above table. Furthermore, they do not represent a specific investment recommendation for you, they merely show which ETFs from the universe I track are falling within the specified guidelines.
All linked charts above are courtesy of Bloomberg via ZeroHedge.
Contact Ulli