- Moving the markets
The tech sector was spanked today, as rising bond yields raised concerns about high equity valuations and a potential increase in inflation. The benchmark 10-year bond yield jumped as much as 8 basis points intra-day to 1.49% but pulled back slightly and finished the session at 1.47%.
I have pointed to surging yields as the Achilles tendon of equities, which can bring this tech bull market to an end in a hurry. CNBC called it this way:
The continuous rise in bond yields is raising concerns about equity valuations and a pickup in inflation. Higher bond yields can hit technology stocks particularly hard as they have been relying on easy borrowing for superior growth.
Bucking the sell-off has been the value sector, which I discussed in my most recent client newsletter. Our latest portfolio addition, namely IJS, did exactly that today by advancing +1.28%, while all three major indexes ended in the red.
Especially the Nasdaq was hit hard, and its price dropped through the 50-day M/A resistance level with the index now being down some 5% from Monday’s exuberant highs.
In economic news, ADP reported that 117k new jobs were added in the private sector, which was far less than expectations of 225k.
The US Dollar climbed as bond yields rose, thereby pushing precious metals down with Gold barely hanging on to its $1,700 level.
Despite Monday’s “feel good” rally (or was it a dead cat bounce?), volatility and uncertainty have increased with the markets being in a mess and impossible to read. That simply means that the next move has a 50/50 chance of being either up or down.
Have your trailing sell stops identified, and be ready to pull the trigger should the need arise.
2. ETFs in the Spotlight
In case you missed the announcement and description of this section, you can read it here again.
It features some of the 10 broadly diversified domestic and sector ETFs from my HighVolume list as posted every Saturday. Furthermore, they are screened for the lowest MaxDD% number meaning they have been showing better resistance to temporary sell offs than all others over the past year.
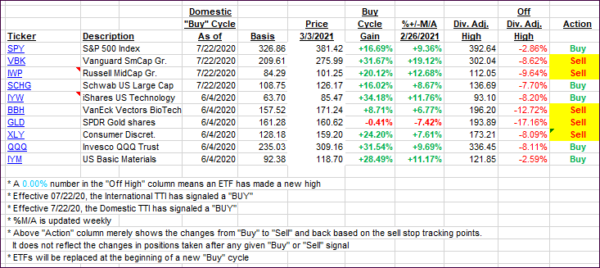
The below table simply demonstrates the magnitude with which these ETFs are fluctuating above or below their respective individual trend lines (%+/-M/A). A break below, represented by a negative number, shows weakness, while a break above, represented by a positive percentage, shows strength.
For hundreds of ETF choices, be sure to reference Thursday’s StatSheet.
For this current domestic “Buy” cycle, here’s how some our candidates have fared:

Click image to enlarge.
Again, the %+/-M/A column above shows the position of the various ETFs in relation to their respective long-term trend lines, while the trailing sell stops are being tracked in the “Off High” column. The “Action” column will signal a “Sell” once the -8% point has been taken out in the “Off High” column. For more volatile sector ETFs, the trigger point is -10%.
3. Trend Tracking Indexes (TTIs)
Our TTIs went opposite ways with the Domestic one dipping and the International one gaining.
This is how we closed 3/3/2021:
Domestic TTI: +17.13% above its M/A (prior close +17.73%)—Buy signal effective 07/22/2020.
International TTI: +17.39% above its M/A (prior close +16.81%)—Buy signals effective 07/22/2020.
Disclosure: I am obliged to inform you that I, as well as my advisory clients, own some of the ETFs listed in the above table. Furthermore, they do not represent a specific investment recommendation for you, they merely show which ETFs from the universe I track are falling within the specified guidelines.
Contact Ulli