
- Moving the markets
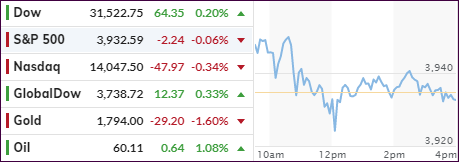
Despite the Dow eking out a modest gain, the markets were lacking enthusiasm, which spread to our favorite ETFs as well. Small- and MidCaps were down along with the Nasdaq and gold.
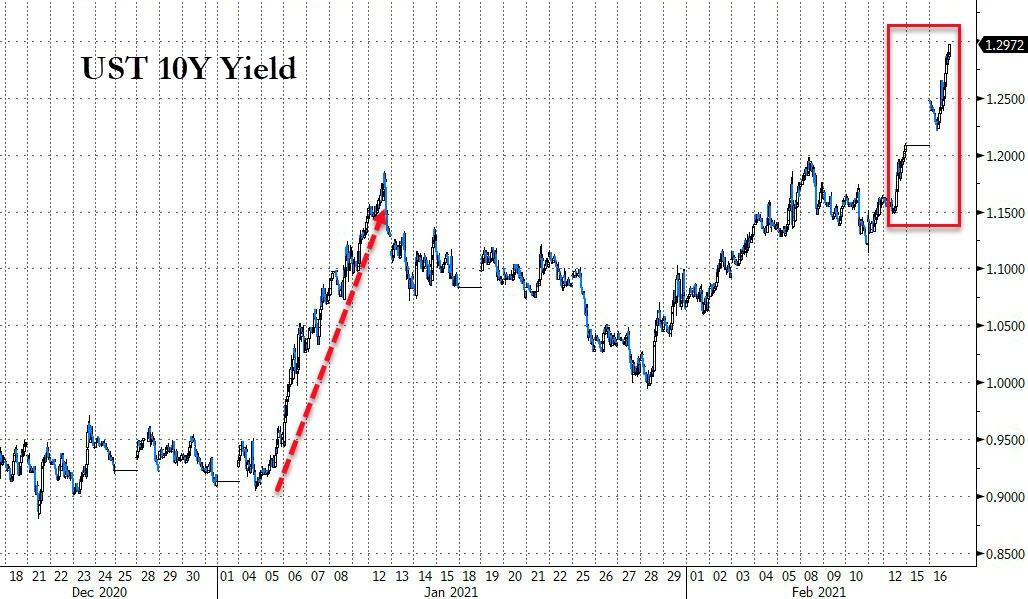
There simply was no place to hide, as the widely held Bond ETF TLT got slammed -1.57% and took out a southerly trending support line, which started in September. Or, put in other words, bond yields surged, thereby not only keeping a lid on equity advances but on gold as well.
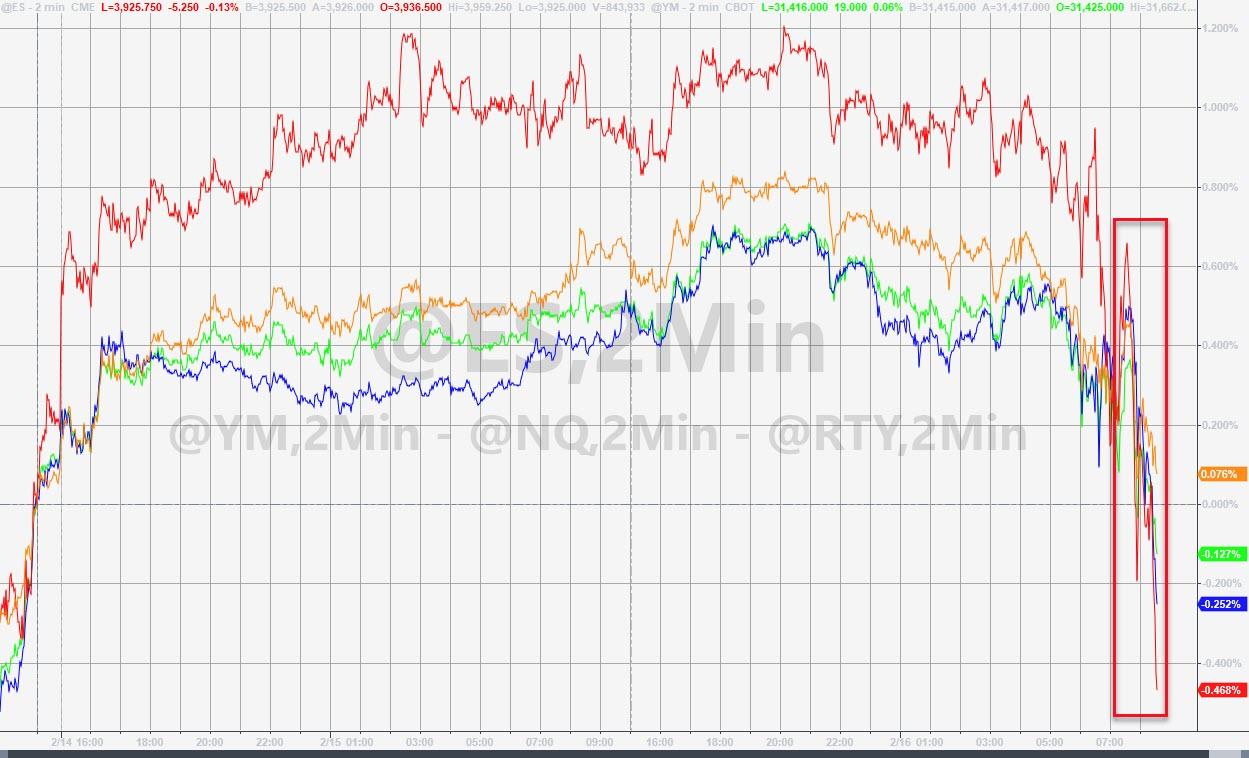
The 10-year yield spiked to 1.30% this morning, a level not seen since last February, thereby crushing bond prices, which move in an inverse direction. That in turn took the starch out of equities, with the S&P hugging its trend line but slipping into the red at the close.
Early in the day, things looked bright with all three major indexes hitting record highs. Nevertheless, remember that, if yields continue to levitate, stocks become less attractive. The higher yield scenario would also present a threat to the tech sector, which has profited in this low-rate ecosystem.
Commented well-known strategist Art Hogan:
“The market can digest rising yields, especially when they are going up for the right reason, but not when they go up in a linear fashion.”
And that will be the fly in the ointment, as CNBC added:
Many worry that a rebound in rates could hinder the economic recovery from the pandemic-induced recession as companies and consumers may find it increasingly expensive to borrow. Others wonder if a deluge of fiscal stimulus could spark a rise in prices after a decade of dormant inflation.
Bond yields are the arena to watch, because if this upward trend continues, there will be a fallout effect in equities. The unanswered question is “when?”
2. ETFs in the Spotlight
In case you missed the announcement and description of this section, you can read it here again.
It features some of the 10 broadly diversified domestic and sector ETFs from my HighVolume list as posted every Saturday. Furthermore, they are screened for the lowest MaxDD% number meaning they have been showing better resistance to temporary sell offs than all others over the past year.
The below table simply demonstrates the magnitude with which these ETFs are fluctuating above or below their respective individual trend lines (%+/-M/A). A break below, represented by a negative number, shows weakness, while a break above, represented by a positive percentage, shows strength.
For hundreds of ETF choices, be sure to reference Thursday’s StatSheet.
For this current domestic “Buy” cycle, here’s how some our candidates have fared:
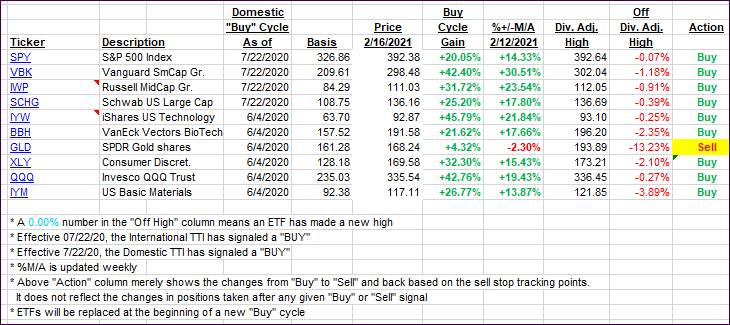
Click image to enlarge.
Again, the %+/-M/A column above shows the position of the various ETFs in relation to their respective long-term trend lines, while the trailing sell stops are being tracked in the “Off High” column. The “Action” column will signal a “Sell” once the -8% point has been taken out in the “Off High” column. For more volatile sector ETFs, the trigger point is -10%.
3. Trend Tracking Indexes (TTIs)
Our TTIs showed a mixed picture with the International one rallying, while the Domestic one ended just about unchanged.
This is how we closed 2/16/2021:
Domestic TTI: +18.72% above its M/A (prior close +18.63%)—Buy signal effective 07/22/2020.
International TTI: +18.95% above its M/A (prior close +17.58%)—Buy signal effective 07/22/2020.
Disclosure: I am obliged to inform you that I, as well as my advisory clients, own some of the ETFs listed in the above table. Furthermore, they do not represent a specific investment recommendation for you, they merely show which ETFs from the universe I track are falling within the specified guidelines.
Contact Ulli